NHS Workforce Race Equality Standard - For 31 March 2020 - Bridgewater ...
←
→
Page content transcription
If your browser does not render page correctly, please read the page content below
NHS Workforce Race Equality Standard
For 31 March 2020
Contents
Page
Number
Introduction 2
Our Results – 31 March 2020 3
Indicator 1: Staff Pay 5
Indicator 2: Recruitment 7
Indicator 3: Disciplinary 8
Indicator 4: Training 8
Indicator 9: Board 9
NHS Staff Survey 2019 Results
Indicator 5: Bullying & Harassment: Public 10
Indicator 6: Bullying & Harassment: Staff 11
Indicator 7: Equal Opportunities 13
Indicator 8: Discrimination 15
Comparison of WRES Results 2015 – 2020 17
Covid 19 and #BlackLivesMatter 19
Our Action Plan 2020 – 2023 20
Contact Details 20
1|Page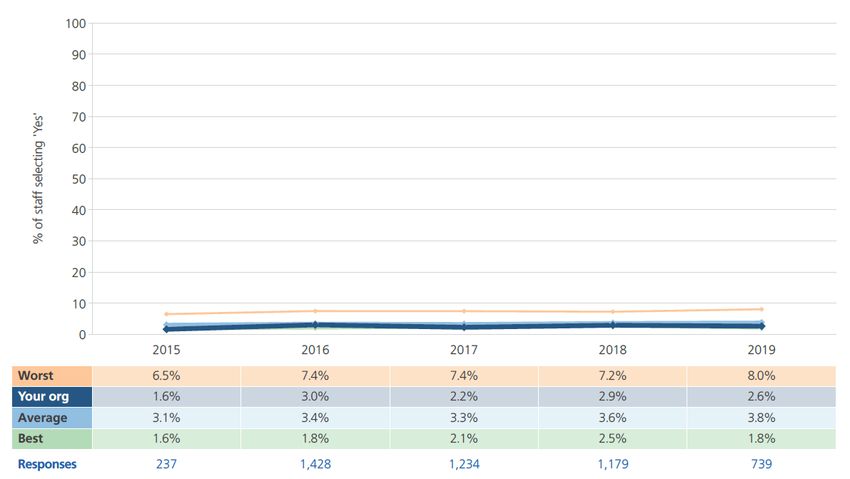
Introduction
Welcome to our NHS Workforce Race Equality Standard Report and Action Plan 2020.
The Standard was mandated in April 2015 and requires all NHS Trusts to publish information on
race equality within their organisations and to take steps to address areas of inequality identified;
thereby improving future results and most importantly the real, lived experience of Black, Asian,
and Minority Ethnic staff.
The Standard was mandated in recognition of continuing inequality for Black, Asian, and Minority
Ethnic staff within the NHS despite years of initiatives to improve this. Across all indicators these
members of staff continue to experience worse outcomes when compared to White staff. And
evidence shows that this impacts on patients, with poor staff experience leading to poor patient
experience.
The Standard focuses on nine indicators:
career progression and representation at higher pay levels
recruitment
formal disciplinary processes
non-mandatory training and personal development
harassment, bullying and abuse from patients/public
harassment, bullying and abuse from other staff
equal opportunities
discrimination
board level representation
This report provides the results for these nine indicators and our action plans areas for 2020-23 in
relation to race equality in employment.
We can’t look at race equality in the NHS in 2020 without considering the disproportionate impact
of Covid 19 on Black, Asian and Minority Ethnic staff, nor can we ignore the #BlackLivesMatters
movement. Together they have shone a light on race inequality, discrimination and racism across
our society and throughout organisations, including the NHS. On page 20 we provide more detail
on what we are doing in relation to race equality in Bridgewater as we move forwards through
2020 and beyond.
Throughout this document we will use the abbreviations WRES for the Workforce Race Equality
Standard, BAME for Black, Asian and Minority Ethnic, ESR for Electronic Staff Record, EDI for
Equality, Diversity and Inclusion, and AfC for Agenda for Change.
If you have any questions, queries or comments, please see our contact details at the end of the
report.
2|Page
Our Results – 31 March 2020
We have provided in the table to follow a summary of our results against the nine indicators of the
WRES. The pages to follow provide further detail and a brief analysis, including looking at results
since 2015 against each indicator.

                                          Table 1: Summary WRES Results 2020

Indicator

1.   Percentage of staff in each AfC Band 1-9 or Medical and Dental pay grades, compared with the
     percentage of staff in the workforce overall

     Disaggregated by non-clinical staff, clinical staff, and medical and dental staff

                                                Non-clinical                             Clinical

                                   White          BAME           N/S           White     BAME            N/S

AfC1                                0%              0%            0%            0%         0%            0%

AfC2                               5.8%
Indicator
2. Relative likelihood of being appointed from 1.39 times more likely to be appointed if you are White
shortlisting across all posts
3. Relative likelihood of entering formal disciplinary 2.4 times more likely to enter formal disciplinary
processes processes if you are BAME
4. Relative likelihood of accessing non-mandatory 0.6 times more likely to access this training if you are
training/CPD BAME
5. Percentage of staff experiencing bullying, BAME 28.0%
harassment and abuse from
patients/relatives/public in last 12 months White 23.1%
6. Percentage of staff experiencing bullying, BAME 20.0%
harassment and abuse from staff in last 12 months
White 20.8%
7. Percentage believing the Trust provides equal BAME 70.6%
opportunities for career progression and promotion
White 89.6%
8. In the last 12 months personally experiencing BAME 16.0%
discrimination from manager/team leader/other
colleagues White 4.9%
9. Percentage difference between Board membership White -25.6%
and overall workforce
BAME 3.4%
Disaggregated by voting and non-voting members
Not Stated 22.2%
4|PageIndicator 1: Staff Pay
This indicator looks at pay, what percentage (%) of White staff and BAME staff are in each of the
pay bands 1 to 9, in medical and dental posts, and very senior manager posts (including executive
board members).
These figures are compared with the overall workforce.
Non-Clinical Staff:
The figure below shows all non-clinical staff as at 31 March 2020, showing BAME, White and
ethnicity unknown staff by pay band:
Figure 1: All Non-Clinical Staff As At 31 March 2020
As can be seen numbers of BAME staff are low overall in non-clinical roles, 3.0% out of 507
non-clinical staff are BAME.
We have a number of non-clinical staff records that have no ethnicity recorded.
Most BAME non-clinical staff are in clerical roles, we are unable to provide more detail as
the low numbers make staff potentially personally identifiable.
Most BAME staff in non-clinical roles are in Agenda for Change (AfC) Band 2, with small
numbers in Bands 3, 5 and 6, but these are all very small numbers of staff.
There are no BAME staff above Band 8b, i.e. in senior or executive non-clinical roles.
The ‘Other’ staff are all Board Executives and Non-Executives; with one apprentice and one
member of bank staff in ‘Under Band 1’. All are White or Not Stated.
5|PageClinical Staff:
The figure below shows all clinical staff as at 31 March 2020, showing BAME, White and ethnicity
unknown staff by pay band:
Figure 2: All Clinical Staff As At 31 March 2020
As can be seen again the numbers of BAME staff are low at 3.5% of all 1,400 clinical staff.
There are 68 staff records where ethnicity is not recorded.
The majority of BAME clinical staff are in AfC Bands 5 and 6, there are very few BAME staff
above Band 6 in clinical roles.
45% of BAME clinical staff are in frontline roles as Community Nurses and Community
Practitioners.
Medical and Dental Staff:
The table to follow shows our medical and dental workforce, as can be seen the percentage of
BAME staff is significantly higher than in our overall workforce. Over half of these staff are bank
GPs and just over 11% are in Dental Officer roles.
Table 2: Medical and Dental Staff By Ethnicity as Percentage (%)
BAME White Not Stated
37.6% 54.6% 7.8%
6|PageIndicator 2: Recruitment
This indicator looks at recruitment, to see how more likely White applicants are to be
successful and to be appointed when compared to BAME staff.
(A likelihood figure above one would show that White applicants are more likely to be
appointed than BAME applicants).
Our likelihood figure for this year is 1.39. This means that White staff are 1.39 times more likely to
be recruited than BAME staff. This is small deterioration on our figure of 1.28 last year.
The figure below shows ethnicity at each stage of recruitment and the table to follow shows the
percentage by ethnicity at each stage of the recruitment process. This includes both internal and
external recruitment of all vacancies advertised through NHS Jobs.
Figure 3: Recruitment April 2019 to March 2020 Showing Ethnicity
Table 3: Recruitment by Ethnicity as a Percentage of the Total at Each Stage
Application Shortlisting Successful
BAME 11.6% 7.4% 5.1%
White 87.7% 92.2% 88.2%
Not Stated 0.7% 0.4% 6.7%
As can be seen the percentage of BAME applicants falls through each stage of the
recruitment process.
7|Page The percentage of BAME staff recruited is higher than the overall Trust workforce figures,
but it equates to a very small number of staff, 13 overall in the period.
We remain challenged with ethnicity reporting in staff records as can be seen in the table
above, the percentage of applicants not disclosing ethnicity in the equal opportunities
monitoring form is very low at under 1%, but rises to 6.7% by the time a staff record is
created for the new starter. This is reflective of a problem with transfer of data from NHS
Jobs to ESR rather than reflective of an unwillingness to state ethnicity. Improving our data
is one of the important actions we are working on in 2020.
As a Trust we are not a sponsor organisation so are unable to accept Tier 2 applicants in
recruitment, this means that many applications from overseas have to be rejected as we
are legally unable to accept them. As part of our commitment to race equality we are
looking at how we can support increased BAME applications from in our communities, and
success through recruitment processes for these applicants.
Indicator 3: Disciplinary
This indicator looks at disciplinary processes in the Trust, at how more likely BME staff are
to be involved in formal disciplinary processes when compared with White staff.
(A likelihood figure above one would show that BME staff are more likely to be in formal
disciplinary processes than White staff).
Our result for this year is 2.4, a small improvement on last year’s figure of 2.72. While this result
shows that BAME staff are more likely to enter formal disciplinary proceedings caution should be
used due to the very small number of staff involved in formal disciplinary overall, less than 20 staff
in total.
In 2019 we started work on implementing Just and Learning Culture in Bridgewater, work on this
has paused as a result of the Covid 19 pandemic but planning is in place to resume this in
summer 2020. Merseycare who are leaders in this area are close neighbours and as such we are
ideally placed to access best practice and support in delivering this project and sustaining
improvements in disciplinary processes and overall just culture across the Trust.
Indicator 4: Non-Mandatory Training and Development
This indicator looks at non-mandatory training and development opportunities, and how
more likely White staff are to take part in these opportunities compared to BME staff.
(A likelihood figure above one would show that White staff are more likely to take part in
these opportunities than BME staff).
In 2020 we have used the data from the Online Learner Management system and can identify that
in total 710 members of staff accessing non-mandatory training in this period, of these 68 (9.6%)
were BAME.
8|PageThis gives a result of 0.60 meaning that in 2019/20 BAME staff were more likely to access these
opportunities than White staff. This is an improvement on the previous year.
In previous years we have taken a different approach to checking data for this indicator, we feel
this new approach, available following a great deal of valuable work from staff, is a more robust
way of measuring for this result going forward. We know that during this period the availability of
non-mandatory training and personal development opportunities for staff has reduced due to
changes within the Education and Professional Development team, we hope going forward that
more opportunities and more diversity of opportunity will exist to support staff development.
Indicator 9: Board
This indicator looks at our Board of Directors, and what the difference is, in percentage,
compared with the workforce
The following table shows the percentage difference between our Board membership and our
overall workforce. A minus figure shows under-representation compared to workforce and a
positive figure over-representation – however we need to be caution, as whole the Trust is under-
representative of the communities we serve, and Board membership numbers are very small.
Table 4: Showing Board Ethnicity Representation Compare to Overall Workforce Representation
White BAME Not Stated
Board -25.6% 3.4% 22.2%
The Board is committed to race equality for both workforce and for BAME communities and
has signed up to the Greater Manchester Race Equality Charter and the Race At Work
Charter.
In 2020 the Board approved the WRES: A Model Employer Action Plan, the planned
actions and targets for the Trust to work towards the next ten years. The Trust was not set
a target by the national WRES team as the overall percentages of BAME staff in pay bands
made the creation of targets impossible; however we recognised that our data in the WRES
since 2015 shows under-representation of BAME staff in higher pay bands and successful
recruitment; over-representation in disciplinary figures; and consistently worse figures in
NHS Staff Survey indicators, for this reason we chose to set ourselves actions and targets
to improve race equality in our workforce.
As a result of the Covid 19 pandemic and its disproportionate impact on BAME staff in the
NHS and wider communities, and the momentum of the #BlackLivesMatter movement this
action plan, along with the Trust’s Equality, Diversity & Inclusion Strategy Action Plan are
being refreshed in summer 2020 to reflect our new understanding of race equality issues,
and stronger actions to improve race equality and reduce inequality in our workforce and
our communities.
9|PageNHS Staff Survey 2019 Results
As a result of Covid 19 the reporting of NHS Staff Survey Indicators has been suspended for 2020,
however the results themselves are already available and relate very importantly to the issues
raised by the #BlackLivesMatter movement – the inequality and ill-health caused by racism,
bullying, harassment, discrimination and unequal access to services and employment. So we have
made the decision to provide our results within this report.
Indicator 5: Bullying, Harassment and Abuse – Patients, Relatives and the Public
This indicator looks at the percentage of staff who have experienced harassment, bullying
or abuse from patients, relatives or other members of the public in the last year.
(NHS Staff Survey 2019)
The figure below looks at the trend in this indicator from 2015 (when numbers responding were too
low to report, so register as zero) to 2019.
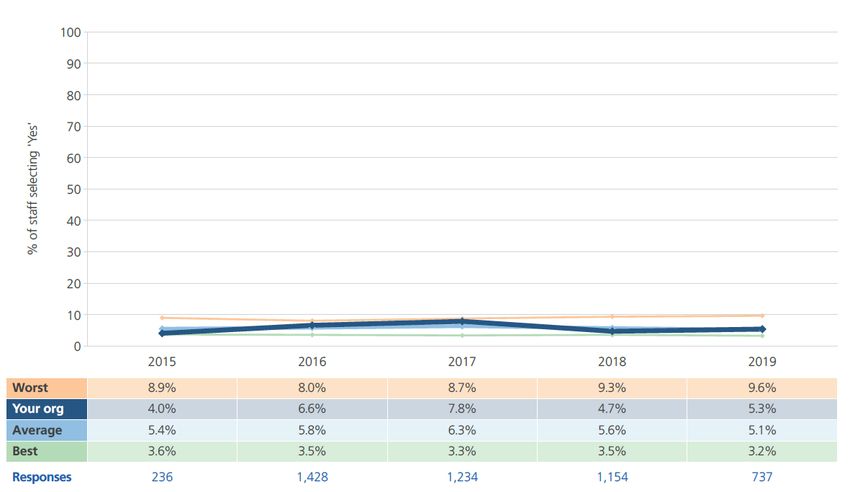
Figure 4: Bullying, Harassment and Abuse from Patients/Relatives/Public from 2015 - 2019
Overall the Trust’s result in this indicator was 23.2%. There were 25 responses from BAME
staff to this question.
As can be seen BAME staff have since 2017 reported a higher rate of bullying, abuse and
harassment from patients, relatives and the public.
There was a large jump in 2018 that has returned to a lower figure in this year’s Survey.
However, even given the low numbers of staff who responded to the Survey this figure is
still too high, no one should be subjected to these behaviours in the workplace.
10 | P a g eIndicator 6: Bullying, Harassment and Abuse – Other Staff
This indicator looks at what percentage of staff have experienced harassment, bullying or
abuse from other staff in the last year.
(NHS Staff Survey 2019)
The figure below looks at the trend since 2015 for this indicator, (please note in 2015 as for above
numbers responding were too low for reporting so a zero figure was returned).
Figure 5: Bullying, Harassment and Abuse from Staff from 2015 - 2019
As can be seen in the figure above the results for both BAME and White staff are very
similar in most years, with BAME staff for the last two years reporting slightly lower figures
than White staff. For both groups this figure rose in 2019.
However these figures do show us that a fifth of the 25 BAME staff responding to the
Survey reported experiencing bullying, harassment or abuse from their colleagues,
manager or other staff, figures that shouldn’t be ignored.
Further analysis of the Survey data shows that 12% of BAME staff and 10.9% of White staff
reported bullying, harassment or abuse from their manager, and 12% of BAME staff and
13.7% of White staff from other staff members.
Please see further narrative on this theme on the following page.
11 | P a g eNHS Staff Survey Bullying & Harassment Theme:
The table to follow looks at the bullying, harassment and abuse theme overall for the Trust since
2015:
Figure 6: Bullying and Harassment Overall 2015 - 2019
As can be seen the Trust is broadly reflective of the average for its comparator group and
has remained steady at between 8% and 8.5%.
However this looks at bullying and harassment overall rather than by specific protected
characteristic group, we must not forget the impact that these behaviours have on certain
groups, and how the rates are increasing both for our staff and more generally in the
population where racial hate crime and overt racism generally are both on the rise.
We have also looked at bullying and harassment by directorate and have identified four
areas where figures are higher than average – Corporate Operations, Corporate
Safeguarding, Halton Children’s and Oldham. The numbers of staff within some of these
teams are very low so caution should be used if assigning significance to the figures, but
any form of bullying and harassment impacts on the individual and we need to ensure we
have a clear message that these behaviours will not be tolerated and staff should report if
they experience or witness these events.
The Trust has a Dignity & Respect at Work Policy that sets out informal and formal processes for
addressing these areas of misconduct. And the Violence & Aggression Policy considers services.
The Trust has an anti-bullying and harassment campaign (BABAH), this includes resources like
manager toolkits, online reporting, and an app for reporting through a smart phone. But numbers
reporting via these processes do not correlate with those in the NHS Staff Survey. Work is being
undertaken to strengthen the zero tolerance message and more actions regarding education on
areas such as racism, micro-aggressions and weathering are being planned as the EDI Strategy is
refreshed as a result of Covid 19.
12 | P a g eIndicator 7: Equal Opportunities
This indicator looks at the percentage of staff who believe the Trust provides equal
opportunities for career progression or promotion.
(NHS Staff Survey 2019)
The figure to follow shows our results for this indicator for BAME staff from 2015 to 2019.
Figure 7: Equal Opportunities Results 2015 - 2019
As can be seen this indicator has shown a sharp decline for BAME staff.
Up to two years ago BAME staff consistently reported a higher satisfaction rate than White
staff, but for two years this has decreased with a 15.1% decrease between 2018 and 2019.
At 70.6% this result is the lowest it has been since WRES reporting began.
There were 17 BAME staff who responded to this question in the Survey.
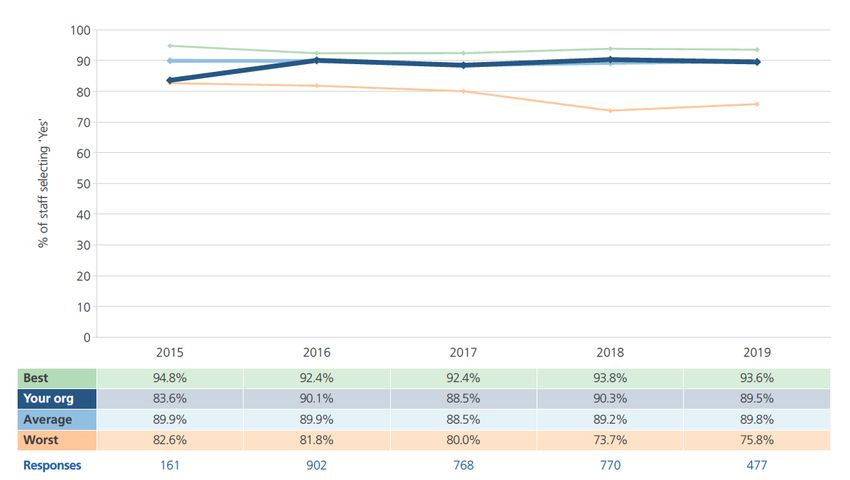
On the following page we have shown the NHS Staff Survey 2019 Report figure detailing the
overall Trust result for equal opportunities since 2015. As can be seen the Trust has remained
around average for its comparator group, but up to the year 2018 BAME staff consistently reported
higher results than White staff.
Engagement with our BAME staff will enable us to identify what barriers or issues they face in
career progression and promotion, and from that we can work in partnership to deliver career
development actions that are effective for the diverse staff represented in our BAME cohort.
13 | P a g eFigure 8: Showing Equal Opportunities Regardless of Ethnicity, Religion, Age, Gender, Sexual Orientation or Age
14 | P a g eIndicator 8: Discrimination
This indicator looks at what percentage of staff have personally experienced discrimination
at work from their manager or team leader, or from another member of staff.
(NHS Staff Survey 2019)
The figure to follow shows our results for this indicator from 2015 to 2019.
Figure 9: Discrimination Figures from 2015 to 2019
As can be seen there has been a sharp increase in this figure since 2018, nearly doubling
the reported incidence of discrimination from colleagues experienced by BAME staff.
There were 25 responses from BAME staff to this Survey question.
As stated previously the Trust has policies, for example Equal Opportunities and Dignity &
Respect at Work, and processes such as BABAH that should protect staff from discrimination.
The following page looks at the discrimination theme overall for the Trust, firstly discrimination
from patients/families/public and secondly from manager/team leader/colleagues. As you will see
reporting generally for the second is worse than for the first with more staff stating they have
experienced discrimination internally to the Trust rather than for the patients and communities we
serve.
15 | P a g eFigure 10: Showing Discrimination from Patients/Families/Public Reported by all Staff
Figure 11: Showing Discrimination from Other Staff Reported by all Staff
16 | P a g eComparison of WRES Results 2015 - 2020
To follow is a set of comparison tables showing the Bridgewater WRES results from the start of
the WRES in 2015 to the most current results as at 31 March 2020.
Caution should be used when comparing the data as the Trust has changed a great deal in six
years, with a significant number of staff and services leaving the Trust to become part of
integrated care organisations in Bolton and Wigan, or transferring out as services have moved to
new providers.
Indicator 1: Staff Pay
The tables to follow shows the numbers of BAME non-clinical and clinical staff since 2015 when
WRES reporting began.
Table 5: BAME Non-Clinical Staff By Pay Band 2015 to 2020
BAME Non-Clinical Staff
Pay Band 2015 2016 2017 2018 2019 2020
All AfC Pay Bands 18 18 16 20 19 15
Very Senior Manager 0 0 0 0 0 0
Where figures are below 10 an * is used to protect personal identities
Table 6: BAME Clinical Staff By Pay Band 2015 - 2020
BAME Clinical Staff
Pay Band 2015 2016 2017 2018 2019 2020
All AfC Pay Bands 42 39 44 31 52 49
Very Senior Manager 0 0 0 0 0 *
Medical and Dental (All) 22 20 25 24 18 53
Where figures are below 10 an * is used to protect personal identities
It should be noted in the table above that the large increase in BAME Medical and Dental staff is
due to the inclusion this year of bank staff previously excluded in the validation data provided by
NHS England.
17 | P a g eIndicator 2: Recruitment
The table to follow shows the likelihood of BAME staff being recruited from shortlisting from 2015
to 2020. Also provided is the actual number of BAME staff and White staff recruited
Recruitment of BAME Staff 2015 - 2020
2015 2016 2017 2018 2019 2020
Likelihood 1.85 1.72 1.30 1.24 1.28 1.39
Total BAME Staff 12 24 31 24 23 13
Recruited
Total White Staff 241 532 498 418 395 224
Recruited
Total Not Stated Staff 3 160 120 30 10 17
Recruited
Where figures are below 10 an * is used to protect personal identities
Indicator 3: Disciplinary
The table to follow shows the likelihood of BAME staff entering formal disciplinary processes from
2015 to 2020. We are unable to show actual numbers as they are so low as to be personally
identifiable
BAME Staff Formal Disciplinary 2015 - 2020
2015 2016 2017 2018 2019 2020
Likelihood 6.46 4.93 3.83 1.99 2.72 2.40
Indicator 4: Non-Mandatory Training and Development
The table to follow shows the likelihood of BAME staff completing non-mandatory training and
development opportunities between 2015 and 2020
BAME Staff Undertaking Non-Mandatory Training and Development 2015 - 2020
2015 2016 2017 2018 2019 2020
Likelihood 0.0 0.55 0.90 1.10 1.74 0.60
No data
available
18 | P a g eCovid 19 and #BlackLivesMatter
As the Covid 19 pandemic developed through March and April it became apparent that the impact
on BAME communities of infection rate, severity of symptoms and tragically mortality was
disproportionate when compared to the White majority population.
Public Health England where tasked with reviewing data and evidence in relation to the impact of
the virus on different communities and on 2nd June 2020 published their ‘Disparities in the risk and
outcome of Covid 19’ report. The report laid bare the disparities faced by different groups of
people, not just BAME but also those related to age, gender and deprivation. For most groups the
inequality from Covid replicated inequality in mortality seen more generally, but for BAME
communities the disparity was stark as mortality is generally lower than in the White population but
Covid 19 mortality is anything up to four times higher than for the White majority population.
As this report was released in the UK over in the US protests began following the unlawful killing
George Floyd. This #BlackLivesMatter movement gathered momentum across the World as
people took to the streets to highlight inequality, racism and the impacts these have on BAME life,
health and wellbeing.
In the NHS and in social care correspondingly high Covid mortality figures have been seen in staff.
The first 10 reported deaths in NHS staff were all in individuals from BAME backgrounds. While
the NHS has a higher representation of BAME staff nationally when compared to the general
population (24% as opposed to 13%) death rates were still disproportionately high.
A number of risk factors have been suggested and these were reiterated in the stakeholder
engagement that accompanied the Disparities report (Beyond The Data: Understanding the impact
of Covid 19 on BAME groups):
Socio-economic factors – deprivation, housing, lived environment etc.
Increased exposure risk – BAME staff more likely to be frontline workers than managers
Increased risk of complications and death - from co-morbidities more prevalent in some
BAME communities, particularly those living in more deprived areas
Racism, discrimination, stigma, fear and lack of trust in public services such as the NHS
What Covid 19 has made clear is that longstanding racial inequality and health inequality is at the
heart of our society, and it is maintained and enforced by structural and institutional racism that
prevents change. While #BlackLivesMatter has been widely supported by leaders and
organisations, including across the NHS, as a Trust, as the NHS, as an anchor organisation in
communities, we must use this momentum to action plan and make changes that will have long
term positive impacts on our BAME communities and our staff. This report and the information
provided on the WRES results since 2015 show that Bridgewater has work to do, as we write and
publish this WRES report we are working to develop an action plan that we can deliver in
partnership (using the stakeholder recommendations from Beyond The Data) with our staff, our
communities and the organisations we work alongside from public, private and voluntary sector.
Covid 19 has shone a light on inequality; it is up to us now to address it.
19 | P a g eOur Action Plan 2020
You will find to follow our overarching planned areas of action for WRES for 2020/21. This plan is
not detailed as we are working through summer 2020 to refresh our WRES:A Model Employer,
EDI Equality Objectives, and EDI Strategy to ensure all actions in relation to race, disability,
gender etc. are captured as a result of the inequalities, barriers and issues that have been
magnified as a result of Covid and #BlackLivesMatters, and also the opportunities that have
opened up as a result of integration and partnership working enacted during the pandemic and the
changes to working practices that have been enabled for our workforce.
As the framework for our planning we have the five keys areas of focus set down by NHS Chief
People Officer, Prerana Issar in May – protection of staff, engagement, representation,
recovery/rehabilitation, and communications.
We are working to ensure our equality plans are at the heart of our refresh of our workforce and
service delivery strategies as we move into a different future, plans that will address inequality in
our communities and in employment.
And we need to engage with our staff groups, listening to what they want us to address and focus
on, before we finalise our strategy and plans.
As our refreshed EDI Strategy, Objectives and Delivery Plan are approved they will be published
on our website at http://bridgewater.nhs.uk/aboutus/equalitydiversity-2/
Draft WRES Action Areas 2020 – 2023:
Data collection
Ongoing protection and bespoke support for BAME staff
Ongoing staff engagement through our newly established Workforce Race Equality Network
Development of representation, scrutiny, and diverse voice pathways
Career development and talent management – new NHS recruits and existing staff
Just and learning culture
Cultural competence programme
Zero tolerance/anti bullying and discrimination
Thank you for taking the time to read our 2020 WRES report. Should you have any queries or
questions or if you would like to request the contents of this report in another language or format,
please contact our Equality & Inclusion Manager in the first instance, details below.
Paula Woods (Director of Workforce and Organisational Development) paula.woods1@nhs.net
Ruth Besford (Equality & Inclusion Manager) ruth.besford@nhs.net
20 | P a g eYou can also read