Invivo photoacoustic flowmetry at depths of the diffusive regime based on saline injection
←
→
Page content transcription
If your browser does not render page correctly, please read the page content below
In vivo photoacoustic flowmetry at
                 depths of the diffusive regime based
                 on saline injection

                 Yong Zhou
                 Joemini Poudel
                 Guo Li
                 Lihong V. Wang

Downloaded From: https://www.spiedigitallibrary.org/journals/Journal-of-Biomedical-Optics on 28 Jan 2021
Terms of Use: https://www.spiedigitallibrary.org/terms-of-use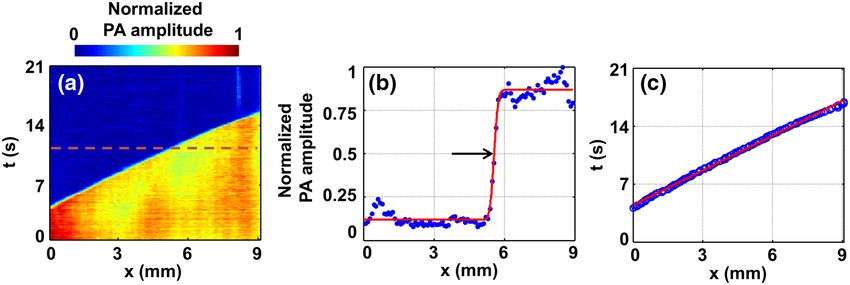
Journal of Biomedical Optics 20(8), 087001 (August 2015)

                In vivo photoacoustic flowmetry at depths of
                the diffusive regime based on saline injection
                Yong Zhou, Joemini Poudel, Guo Li, and Lihong V. Wang*
                Washington University in St. Louis, Department of Biomedical Engineering, Optical Imaging Laboratory, 1 Brookings Drive, Campus Box 1097,
                St. Louis, Missouri 63130, United States

                              Abstract. We propose a saline injection-based method to quantify blood flow velocity in vivo with acoustic-
                              resolution photoacoustic tomography. By monitoring the saline–blood interface propagating in the blood vessel,
                              the flow velocity can be resolved. We first demonstrated our method in phantom experiments, where a root mean
                              square error of prediction of 0.29 mm∕s was achieved. By injecting saline into a mouse tail vein covered with
                              1 mm chicken tissue, we showed that the flow velocity in the tail vein could be measured at depths, which is
                              especially pertinent to monitoring blood flow velocity in patients undergoing intravenous infusion. © 2015 Society of
                              Photo-Optical Instrumentation Engineers (SPIE) [DOI: 10.1117/1.JBO.20.8.087001]

                              Keywords: saline injection; blood flow velocity; acoustic-resolution photoacoustic tomography; intravenous infusion.
                              Paper 150337R received May 18, 2015; accepted for publication Jul. 20, 2015; published online Aug. 12, 2015.

                                                                                                   size. In typical OR-PAT, the spatial resolution is comparable
                Photoacoustic tomography (PAT) is a modality that provides im-                     to the size of red blood cells (RBCs). Thus, when RBCs
                aging in either two dimensions (2-D) or three dimensions.1–5                       flow into and out of the detection voxel, the PA signal changes
                Combining the advantages of optical excitation and acoustic                        are observable. By monitoring how fast the signal changes,17 the
                detection, PAT can image rich optical absorption contrast in bio-                  flow velocity can be calculated. However, in AR-PAT, the large
                logical tissues at depths. To date, PAT has been widely used for                   detection voxel contains many more RBCs than in OR-PAT.
                both structural and functional biological imaging in many differ-                  Because the number of RBCs inside the detection voxel can
                ent fields, including hematology,6 oncology,7 dermatology,8                        be assumed to follow a Poisson distribution,18 a larger mean
                ophthalmology,9 and gastroenterology.10 Depending on the                           number of RBCs leads to a smaller relative RBC number change
                limiting factor for spatial resolution, PAT can be divided into                    and, therefore, a smaller PA signal change. For example, if there
                optical-resolution PAT (OR-PAT) and acoustic-resolution PAT                        are 10,000 RBCs in the detection voxel, the PA signal change
                (AR-PAT). In OR-PAT, the optical focus is much tighter than                        due to the RBC number change would be only ∼1%, so the sys-
                the acoustic focus, and a high spatial resolution can be achieved.                 tem would need a signal-to-noise ratio of >100 to measure the
                AR-PAT provides a lower spatial resolution, defined by the                         flow velocity.
                acoustic focus. Whereas in biological tissue ultrasound suffers                        Although challenging, different methods have been proposed
                much less scattering than light, AR-PAT can achieve deep im-                       to achieve blood flow measurement with AR-PAT, including PA
                aging with a depth-to-resolution ratio of >100.1 So far, with                      Doppler (PAD) flowmetry19–21 and ultrasonically encoded PA
                high resolution, OR-PAT has imaged a variety of important bio-                     flowgraphy (UE-PAF).22 Based on the PAD effect, different
                logical parameters in vivo, such as the oxygen saturation of                       PAD shifts have been observed from particles moving with dif-
                hemoglobin (sO2 ),11 blood flow velocity,12,13 pulse wave veloc-                   ferent flow speeds, and the Doppler theory allows the flow
                ity,14 and the metabolic rate of oxygen (MRO2 ).9 However,                         speeds to be calculated. However, to observe the PAD shift,
                although AR-PAT has imaged sO2 at depths, it still cannot pro-                     the moving particles have to be very sparse. Thus, this method
                vide in vivo blood flow information. In addition, in order to cal-                 cannot measure the flow velocity of whole blood. But by using
                culate MRO2 with PAT, flow must be measured, which makes it                        ultrasound to encode the PA signals, UE-PAF can achieve whole
                even more important to quantify flow.                                              blood flow imaging in deep tissue. In UE-PAF, modulated ultra-
                                                                                                   sound is focused into the blood vessel to create a heating source.
                    There are two fundamental reasons why it is difficult for AR-
                                                                                                   Because PA signals are proportional to temperature, the PA sig-
                PAT to measure blood flow velocity. First, unlike ultrasound,
                                                                                                   nals from the heated area will increase.23 By monitoring the
                PAT almost has no speckles.15,16 If the target has a smooth boun-
                                                                                                   increased PA signals along the blood vessel, the flow speed
                dary with respect to the wavelengths of the PA waves, the boun-
                                                                                                   in the blood vessel can be measured. However, this method’s
                dary signals of the target will stand out, while the speckles inside
                                                                                                   complexity has limited it to phantoms and, to date, no in vivo
                the target are largely suppressed. Because blood vessels in bio-
                                                                                                   data have been reported.
                logical tissues usually have smooth boundaries, it is challenging
                                                                                                       In this paper, we present a new method to measure blood
                for PAT to extract blood flow information merely based on
                                                                                                   flow velocity deep in biological tissues. To increase the PA sig-
                speckle fluctuations. Second, AR-PAT has a lower spatial res-
                                                                                                   nal changes due to flowing RBCs, saline is injected into the
                olution than OR-PAT and, therefore, a larger detection voxel
                                                                                                   blood stream. As a result, at the saline–blood interfaces (SBIs),

                *Address all correspondence to: Lihong V. Wang, E-mail: lhwang@wustl.edu           1083-3668/2015/$25.00 © 2015 SPIE

                Journal of Biomedical Optics                                               087001-1                                         August 2015   •   Vol. 20(8)

Downloaded From: https://www.spiedigitallibrary.org/journals/Journal-of-Biomedical-Optics on 28 Jan 2021
Terms of Use: https://www.spiedigitallibrary.org/terms-of-use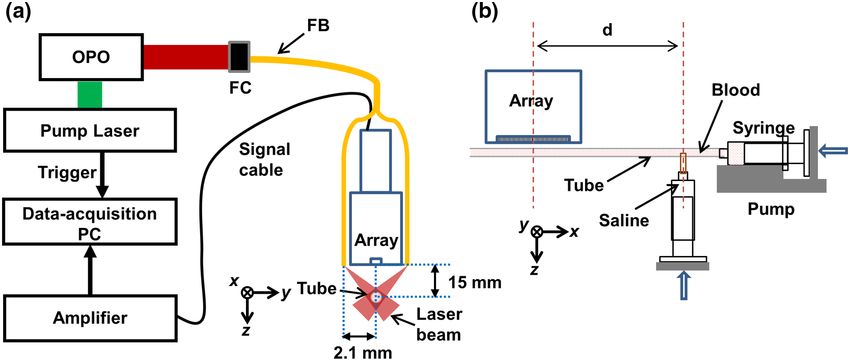
Zhou et al.: In vivo photoacoustic flowmetry at depths of the diffusive regime based on saline injection

                                       Fig. 1 Schematic of (a) the photoacoustic tomography system and (b) saline injection. FB, fiber bundle;
                                       FC, fiber coupler; OPO, optical parametric oscillator. d was 15 cm in the phantom experiment.

                the PA signals have sharp changes—blood’s PA signal is strong,                         Figure 1(b) shows a schematic of saline injection in phantom
                while saline’s signal is negligibly low. Thus, by monitoring the                   experiments. A silicone tube (300 μm inner diameter) filled with
                time course of the PA signals from the interface, the flow veloc-                  blood was used to mimic the blood vessel. The blood was
                ity in the blood stream can be quantified. In addition, because                    pumped into the tube through a syringe, and the flow speed was
                saline is widely used for intravenous infusion, no extra saline                    controlled by a syringe pump. A second syringe was employed
                injection is needed in such patients.                                              to perpendicularly inject saline solution into the tube. The dis-
                    We employed a typical AR-PAT system24 to demonstrate this                      tance between the injection point and the center of the field of
                idea. As shown in Fig. 1(a), the light source was a tunable optical                view (FOV) was set to 15 cm, so the injection disturbance to the
                parametric oscillator laser with a repetition rate of 20 Hz. For deep              flow was minimized.
                tissue imaging, 680 nm light was chosen for the experiments.                           The flow velocity was extracted in three steps from the PA
                The light was first coupled into an optical fiber bundle, which                    signals of the SBI. First, the whole process of the interface
                was divided into two rectangular strips (20 mm × 1.25 mm) at                       propagation through the FOV of the transducer array was moni-
                the output end. The incident pulse fluence on the tissue surface                   tored. At each time point, a 2-D image of the blood vessel was
                was controlled to be ∼10 mJ∕cm2 , which was less than the                          acquired and then converted to a one-dimensional (1-D) ampli-
                safety limit set by the American National Standards Institute                      tude image via the Hilbert transformation, followed by taking
                (20 mJ∕cm2 ) at this wavelength. A linear-array transducer con-                    the absolute value and then the peak amplitude. By piecing
                taining 256 elements (LZ250, Visualsonics Inc.) was used to                        together all the 1-D images at consecutive time points, a final
                detect the PA signals. Thus, each laser pulse generated a two-                     2-D amplitude image of the SBI was achieved, as shown in
                dimensional (2-D) PA image. With a central frequency around                        Fig. 2(a). Note that the x axis is the displacement along the
                21 MHz and a 78% one-way bandwidth, this transducer array                          blood vessel and the y axis is time. Second, at each time point,
                had an axial resolution of 86 μm. With a size of 23 mm × 3 mm                      the 1-D PA amplitude of the phantom blood vessel was fitted by
                and a cylindrical focus at 15 mm, this transducer array provided                   an error function to extract the location of the SBI, as indicated
                a lateral resolution of 119 μm and an elevational resolution                       by the mean value of the error function in Fig. 2(b). Last, by
                of 1237 μm.7                                                                       tracking the SBI along the phantom blood vessel, we calculated

                                       Fig. 2 Steps to extract the flow velocity. (a) Time course of the photoacoustic (PA) amplitude of the blood
                                       vessel in the phantom experiment. (b) Blue dots, one-dimensional PA amplitude along the dashed line in
                                       (a); red line, error function fitting; black arrow, the mean value of the error function. The mean value
                                       represents the saline–blood interface (SBI). (c) Blue circles, time course of the SBIs; red line, linear fitting.

                Journal of Biomedical Optics                                               087001-2                                               August 2015   •   Vol. 20(8)

Downloaded From: https://www.spiedigitallibrary.org/journals/Journal-of-Biomedical-Optics on 28 Jan 2021
Terms of Use: https://www.spiedigitallibrary.org/terms-of-use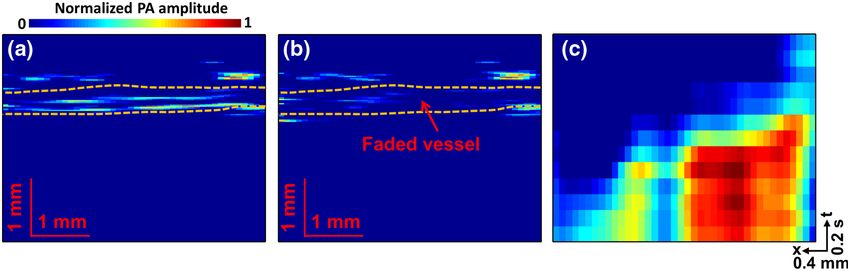
Zhou et al.: In vivo photoacoustic flowmetry at depths of the diffusive regime based on saline injection
the blood stream flow velocity. As shown in Fig. 2(c), although our method can measure deep blood flow with high accuracy.
only two measurements of the SBI sufficed to calculate the Thus, we concluded that our method should be able to measure
blood flow velocity, multiple measurements could improve blood flow velocity in vivo.
the accuracy by linear fitting. We then measured blood flow velocity in a mouse tail vein in
Phantom experiments were first performed to demonstrate vivo to show the detection ability of the saline injection-based
the capability of our method in flow measurement. To confirm method. Again, a slice of chicken breast tissue (∼1 mm) was put
that our method can measure blood flow in biological tissue at atop the tail vein to increase the measurement depth. Saline was
depths of the optical diffusive regime,25 fresh chicken breast tis- injected into the tail vein with a home-made catheter to induce
sue with a thickness of ∼2 mm was laid atop the phantom blood the SBI for blood flow measurement. The distance between the
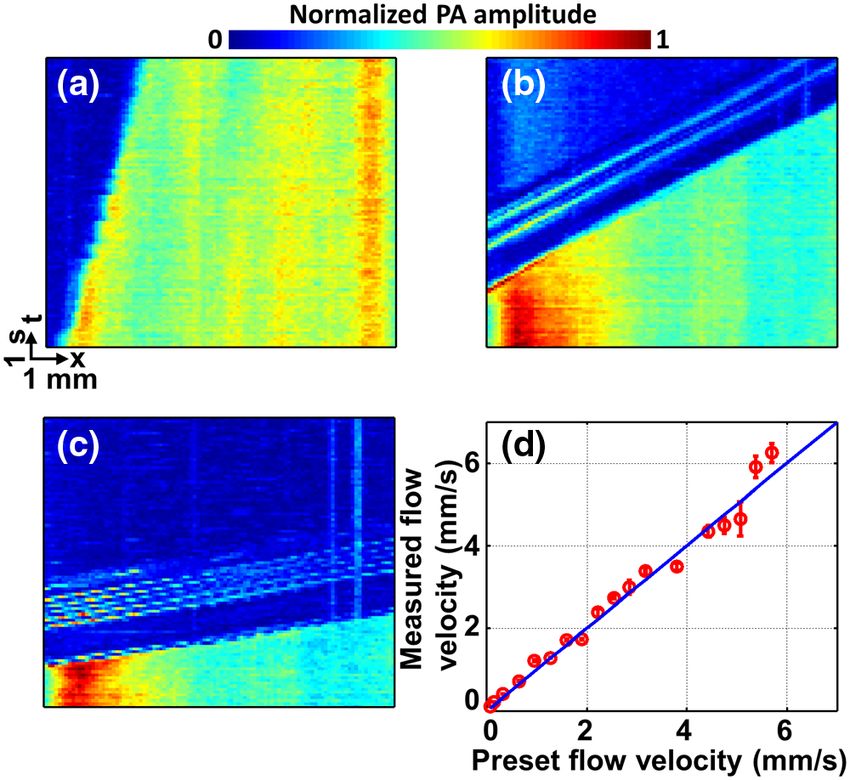
vessel. Figures 3(a)–3(c) show three representative 2-D ampli- injection spot and the imaging window was ∼3 cm. During the
tude images of the SBI, with blood stream flow velocities of 0.2, experiment, an infrared lamp kept the mouse warm, and a
1.3, and 4.5 mm∕s. Because of the strong optical absorption dif- breathing anesthesia system (E–Z Anesthesia, Euthanex) kept
ference between blood and saline, SBIs were imaged by PAT the mouse motionless. All experimental animal procedures
with high contrast, as shown in Figs. 3(a)–3(c). Thus, by linear were carried out in conformity with laboratory animal protocols
fittings of the SBI spatial-temporal locations, our measured approved by the Animal Studies Committee of Washington
blood flow velocities agreed well with the preset values, as University in St. Louis. As shown in Fig. 4(a), before saline
shown in Fig. 3(d). The root mean square error of prediction injection, the whole tail vein in the FOV could be clearly
(RMSEP)26 was calculated to be 0.29 mm∕s, indicating that observed. However, when the saline flushed in, there were
almost no signals from the blood vessel because of the low
absorption of saline, as shown in Fig. 4(b). The total SBI propa-
gation process in the FOV is shown in Video 1. Again, the SBI’s
spatial-temporal location can be clearly imaged by PAT, as
shown in Fig. 4(c). Based on the same procedure as in the phan-
tom experiments, the blood flow velocity was quantified to
be ∼4.5 mm∕s.
With an ∼10 mm FOV along the lateral direction, the system
has a frame rate of 10 Hz. Limited by the system’s memory, a
maximum of 1000 continuous frames can be stored. If we use
the lateral resolution (119 μm) as the minimum displacement
that the system can separate, the minimum flow speed the sys-
tem can measure is ∼119 μm∕50 s ¼ 2.38 μm∕s. For the maxi-
mum flow speed, in theory it should be around 50 mm∕s based
on the current frame rate and FOV along the lateral direction.
Here we require that the SBI be imaged twice in order to mea-
sure the flow speed, for both the minimum and maximum flow
estimation.
In summary, to our knowledge and for the first time, we
achieved deep blood flow measurement in vivo with AR-PAT.
SBIs were created by injecting saline into the blood vessel,
and the blood flow velocity was measured by monitoring a
single SBI propagation in the blood stream. Our phantom
Fig. 3 Phantom experiments. Time course of the PA amplitude of the
blood with flow velocity at (a) 0.2, (b) 1.3, and (c) 4.5 mm∕s in a ves- experiments showed that we could achieve a highly accurate
sel. (d) Measured flow velocity versus preset flow velocity. Red measurement of blood flow velocity in deep biological tissue,
circles, experimental measurement; blue line, ideal fit if the measured with an RMSEP of 0.29 mm∕s. The in vivo mouse experiments
and preset velocities are identical. indicated that we could potentially measure blood flow in
Fig. 4 In vivo experiments. PA images of the tail vein (a) before saline injection and (b) after saline injec-
tion. The saline propagation process is shown in (Video 1, MOV, 0.8 MB) [URL: http://dx.doi.org/10.1117/
1.JBO.20.8.087001.1]. Dashed lines indicate the vessel region. (c) Time course of the PA amplitude of
the tail vein when the saline flushed in.
Journal of Biomedical Optics 087001-3 August 2015 • Vol. 20(8)
Downloaded From: https://www.spiedigitallibrary.org/journals/Journal-of-Biomedical-Optics on 28 Jan 2021
Terms of Use: https://www.spiedigitallibrary.org/terms-of-useZhou et al.: In vivo photoacoustic flowmetry at depths of the diffusive regime based on saline injection
humans. Based on saline injection, our method is particularly 15. Z. J. Guo, L. Li, and L. H. V. Wang, “On the speckle-free nature of
suitable for blood flow quantification in patients already under- photoacoustic tomography,” Med. Phys. 36(9), 4084–4088 (2009).
16. Z. J. Guo, Z. Xu, and L. H. V. Wang, “Dependence of photoacoustic
going intravenous infusion. Considering the difficulty that
speckles on boundary roughness,” J. Biomed. Opt. 17(4), 046009
ultrasound encounters in measuring slow blood flow and sO2 , (2012).
PA-based deep flow and sO2 measurement opens a window for 17. J. J. Yao et al., “In vivo photoacoustic imaging of transverse blood flow
MRO2 quantification in humans, which may lead to significant by using Doppler broadening of bandwidth,” Opt. Lett. 35(9), 1419–
applications, such as noninvasive tumor screening and blood 1421 (2010).
disorder diagnosis. 18. Y. Zhou et al., “Calibration-free absolute quantification of particle con-
centration by statistical analyses of photoacoustic signals in vivo,” J.
Biomed. Opt. 19(3), 37001 (2014).
Acknowledgments 19. S. L. Chen et al., “Photoacoustic correlation spectroscopy and its appli-
The authors would like to thank Professor James Ballard for cation to low-speed flow measurement,” Opt. Lett. 35(8), 1200–1202
manuscript editing. This work was sponsored in part by (2010).
National Institutes of Health grants DP1 EB016986 (NIH Direc- 20. H. Fang, K. Maslov, and L. V. Wang, “Photoacoustic Doppler effect
from flowing small light-absorbing particles,” Phys. Rev. Lett.
tor’s Pioneer Award), R01 CA186567 (NIH Director’s Trans- 99(18), 184501 (2007).
formative Research Award), R01 EB016963, S10 RR026922, 21. J. Brunker and P. Beard, “Pulsed photoacoustic Doppler flowmetry
and R01 CA159959. L.V.W. has a financial interest in Micro- using time-domain cross-correlation: accuracy, resolution and scalabil-
photoacoustics, Inc. and Endra, Inc., which, however, did not ity,” J. Acoust. Soc. Am. 132(3), 1780–1791 (2012).
support this work. 22. L. D. Wang et al., “Ultrasonically encoded photoacoustic flowgraphy in
biological tissue,” Phys. Rev. Lett. 111(20), 204301 (2013).
23. A. Sheinfeld and A. Eyal, “Photoacoustic thermal diffusion flowmetry,”
References Biomed. Opt. Express 3(4), 800–813 (2012).
24. A. Needles et al., “Development and initial application of a fully inte-
1. L. H. V. Wang and S. Hu, “Photoacoustic tomography: in vivo imaging grated photoacoustic micro-ultrasound system,” IEEE Trans. Ultrason.
from organelles to organs,” Science 335(6075), 1458–1462 (2012). Ferr. Freq. Control 60(5), 888–897 (2013).
2. J. Xia and L. H. V. Wang, “Small-animal whole-body photoacoustic 25. L. V. Wang and H. Wu, Biomedical Optics: Principles and Imaging,
tomography: a review,” IEEE Trans. Biomed. Eng. 61(5), 1380–1389 Wiley, Hoboken, New Jersey (2007).
(2014). 26. Y. Zhou et al., “Photoacoustic microscopy of bilirubin in tissue phan-
3. L. V. Wang, “Multiscale photoacoustic microscopy and computed toms,” J. Biomed. Opt. 17(12), 126019 (2012).
tomography,” Nat. Photonics 3(9), 503–509 (2009).
4. P. Beard, “Biomedical photoacoustic imaging,” Interface Focus 1(4), Yong Zhou is currently a graduate student in biomedical engineering
602–631 (2011). at Washington University in St. Louis, under the supervision of
5. V. Ntziachristos, “Going deeper than microscopy: the optical imaging Dr. Lihong V. Wang, Gene K. Beare Distinguished Professor. His
frontier in biology,” Nat. Methods 7(8), 603–614 (2010). research focuses on the development of photoacoustic imaging
6. M. Tang et al., “Noninvasive photoacoustic microscopy of methemoglo- systems.
bin in vivo,” J. Biomed. Opt. 20(3), 036007 (2015).
7. Y. Zhou et al., “Handheld photoacoustic probe to detect both melanoma Joemini Poudel received his BASc in biomedical engineering from
depth and volume at high speed in vivo,” J. Biophotonics 1(7) (2015). Simon Fraser University in Vancouver, Canada. He is currently a
8. Y. Zhou et al., “Handheld photoacoustic microscopy to detect mela- PhD student in biomedical engineering at Washington University in
noma depth in vivo,” Opt. Lett. 39(16), 4731–4734 (2014). St. Louis. His research interest involves application of reconstruction
9. W. Song et al., “A combined method to quantify the retinal metabolic algorithms for photoacoustic computed tomography and ultrasound
rate of oxygen using photoacoustic ophthalmoscopy and optical coher- computed tomography.
ence tomography,” Sci. Rep. 4(6525) (2014).
10. J. M. Yang et al., “Simultaneous functional photoacoustic and ultrasonic Guo Li is currently a postdoc at Washington University in St. Louis in
endoscopy of internal organs in vivo,” Nat. Med. 18(8), 1297 (2012). Dr. Lihong V. Wang’s lab. His research interests are in high-frequency
11. B. Ning et al., “Simultaneous photoacoustic microscopy of microvas- linear-array photoacoustic imaging.
cular anatomy, oxygen saturation, and blood flow,” Opt. Lett. 40(6),
Lihong V. Wang is a Gene K. Beare Distinguished Professor at
910–913 (2015). Washington University, has published 425 journal articles (h-index =
12. W. Song, W. Z. Liu, and H. F. Zhang, “Laser-scanning Doppler photo- 96, citations > 36,000), and delivered 420 keynote/plenary/invited
acoustic microscopy based on temporal correlation,” Appl. Phys. Lett. talks. His laboratory published the first functional photoacoustic CT
102(20), 203501 (2013). and three-dimensional photoacoustic microscopy. He received the
13. Y. Zhou et al., “Calibration-free in vivo transverse blood flowmetry Goodman Award for his Biomedical Optics textbook, NIH Director’s
based on cross correlation of slow time profiles from photoacoustic Pioneer Award, OSA Mees Medal, IEEE Technical Achievement
microscopy,” Opt. Lett. 38(19), 3882–3885 (2013). and Biomedical Engineering Awards, SPIE Britton Chance Biomedi-
14. C. H. Yeh et al., “Photoacoustic microscopy of blood pulse wave,” J. cal Optics Award, and an honorary doctorate from Lund University,
Biomed. Opt. 17(7), 070504 (2012). Sweden.
Journal of Biomedical Optics 087001-4 August 2015 • Vol. 20(8)
Downloaded From: https://www.spiedigitallibrary.org/journals/Journal-of-Biomedical-Optics on 28 Jan 2021
Terms of Use: https://www.spiedigitallibrary.org/terms-of-useYou can also read