Formulations 2020: Fast Disintegrating Tablets of Methylene Blue as Diagnostic Aid in Upper GI Endoscopy: Formulation and Evaluation-Sarada Anepu
←
→
Page content transcription
If your browser does not render page correctly, please read the page content below
Manuscript                           American Journal of Drug Delivery and Therapeutics                                                              2020
                                                                                                                                                       Vol.7 No.3

Formulations 2020: Fast Disintegrating Tablets of Methylene Blue as
Diagnostic Aid in Upper GI Endoscopy: Formulation and Evaluation- Sarada
Anepu
Sarada Anepu
India

Abstract                                                                           underlying pathological conditions [1]. However, suction
Barrett’s esophagus is generally evaluated by upper gastro-                        capacity, damage by spray catheter, cost, improper dye
intestinal endoscopy. In chromoendoscopy technique,                                distribution etc. stand as major drawbacks associated with
methylene blue is used by spraying along the esophagus and                         spray technique [2,3].
upper stomach. The objective of present study is to prepare                        Barrett’s esophagus (BE) is characterized by a replacement of
fast disintegrating tablets of methylene blue, which can                           the normal squamous lining of the distal esophagus with
disintegrate and dissolve rapidly in the saliva. Fast                              metaplastic columnar epithelium. The American College of
disintegrating tablets when administered 30 minutes prior to                       Gastroenterology defines BE as endoscopically recognizable
endoscopy will reach the esophagus and provide uniform                             columnar metaplasia of the esophagus, which is confirmed to
staining for easy diagnosis during endoscopy. Methods: Fast                        have intestinal metaplasia (i.e. goblet cells) in mucosal biopsy
disintegrating tablets of methylene blue were prepared by                          specimens [4].
varying concentration of superdisintegrant and sublimating                         This condition usually results from repeated damage to the
agent. Prepared tablets were evaluated after sublimation.                          esophageal lining, and the most common cause is longstanding
Dye-Excipient compatibility studies were performed, and                            gastro esophageal reflux disorder. The intestinal cells have a
stability studies were carried according to ICH guidelines.                        risk of transforming into cancer cells. As a result, people with
Prepared formulations were evaluated in healthy animals.                           BE are advised to have a periodic endoscopy to monitor early
Results: All the precompression blends showed free flowing                         warning signs of cancer. Many subjects with BE show no signs
property and hence, were used in direct compression                                or symptoms but it is a known precursor in development of
technique for tablet formulation. Tabletting parameters were                       esophageal adenocarcinoma (EAC), a malignancy with a
within the compendial limits. Disintegration times of all the                      dramatically increasing incidence over the past 50 years and
prepared tablets were less than 60 seconds indicating their                        this can be majorly attributed to lifestyle [5].
suitability as fast disintegrating tablets. In vitro dissolution                   Methylene blue (MB) is an aniline based dye which was
studies were performed in pH 6.8 phosphate buffer and tablets                      originally produced for fabric industry. It occurs as dark green
showing greater than 85% dye release in 10 minutes with                            crystals or crystalline powder, with bronze-like lustre.
minimum friability (10% camphor, 8% crospovidone). Dye-                            Solutions in water or alcohol have a deep blue colour.
excipient compatibility studies did not show any interactions.                     Methylene blue (MB) does not stain normal esophageal
Uniform staining along the esophagus indicated the suitability                     mucosa but has a strong affinity for actively absorbing
of developed methylene blue tablets. Conclusions: Prepared                         (intestinal type) epithelium such as the normal small intestine
and evaluated tablets can be administered as diagnostic aid for                    mucosa, colon and stomach. Hence, it has been used most
diagnosis of Barrett’s esophagus, 30 minutes prior to                              commonly to stain specialized intestinal metaplasia within the
endoscopy.                                                                         esophagus, enhancing the detection of Barrett’s esophagus
Keywords:       Barrett’s    esophagus,      chromoendoscopy,                      during screening and surveillance [6]. In spray technique, 0.5%
sublimation, direct compression, aniline based dye, intestinal                     w/v methylene blue solution is used for CE [7].
epithelia                                                                          However, there are reports of improper staining with
1. Introduction                                                                    methylene blue during the diagnosis by CE technique [8].
There are many indications for physiological assessment of                         Alternative methods of dye instillation can give better and
upper and lower gastrointestinal (GI) tract for which,                             superior results without economic concern. The aim of the
endoscopes are inserted directly into the organs and tissues                       present investigation is to explore the possibility of fast
are observed in detail. Hence, endoscopy is the most                               disintegrating methylene blue tablets as an alternative to
promising and widely used diagnostic tool for GI system.                           chromoendoscopic spray technique for accurate diagnosis of
However subtle lesions cannot be identified by normal                              BE.
endoscopy. Chromoendoscopy is a technique in which dye
solutions are sprayed using spray catheters. These dyes
enhance tissue characterization and easier identification of

This work is partly presented at 23rd International Conference and Exhibition on Pharmaceutical Formulations held on July 27-28, 2020 at Zurich, Switzerland.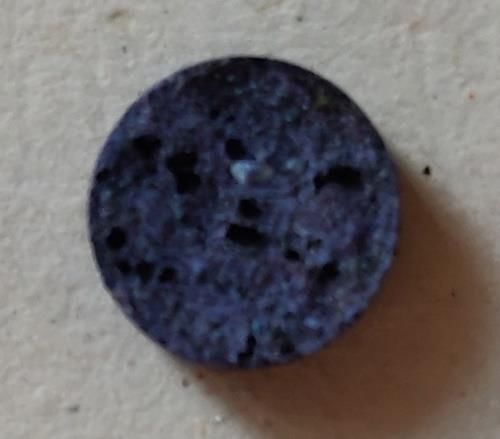
Manuscript                              American Journal of Drug Delivery and Therapeutics                                                           2020
                                                                                                                                                       Vol.7 No.3

2. MATERIALS                                                                       3.3. Dye-excipient compatibility studies
Methylene blue with CAS No: 122965-43-9, certified by                              The incompatibility if any, between the dye and the selected
biological Stain Commission was procured from Sigma Aldrich.                       excipients was studied by using FT-IR and DSC.
Camphor was used for pore formation and crospovidone was
used as super disintegrant. Saccharin was used as sweetener                        3.4. Surface characteristics
while Pearlitol SD was used as diluent. All the ingredients used                   The morphology and surface characteristics of the optimized
were of analytical grade or pharmaceutical grade.                                  tablets were studied using scanning electron microscopy
                                                                                   (SEM). All the samples were coated with gold–palladium alloy
3. Methodology:                                                                    under vacuum. Coated samples were then examined using
3.1. Analytical estimation and pre formulation study                               JSM-6610LV SEM analyzer.
UV-Visible spectrophotometric method was used for
estimation of methylene blue [9,10]. All the ingredients were                      3.5. Stability
mixed according to formulae shown in Table 1 and evaluated                         Stability testing for optimized formulations were performed on
for micromeritic properties.                                                       a fresh batch of tablets as per the ICH guidelines [11]. Twice
 3.2. Formulation of tablets                                                       the number of tablets required for various tests were packed
Powder blend equivalent to a strength of 10 mg of methylene                        in high density polyethylene (HDPE) screw capped bottles
blue was compressed into tablets on a 12-station rotary tablet-                    immediately after initial testing and loaded into the stability
punching machine (Karnavati Minipress–II automated                                 chambers Kemi-KHO-3A (Kadavil Electro Mechanical Industries,
compression machine) using 8 mm round plain punches with                           Kerala, India). The samples were withdrawn at time intervals of
optimal compression force. Compressed tablets were                                 3 and 6 months and evaluated.
subjected to the process of sublimation in an oven at 60°C for
6 hours. The compressed tablets were evaluated for general                         3.6. In vivo release studies in animal models
appearance, hardness, thickness, uniformity of weight,                             Animal specifications used in present study is shown in Table 2.
friability, disintegration test, content uniformity. The in vitro
release studies for all the formulations were performed                            Table 2: Animal specifications.
according to USP type II, paddle method (Labindia dissolution                               Species                Sprague-Dawley
test apparatus). Paddle speed was maintained at 50 rpm and
900 ml of pH 6.8 phosphate buffer was used as the dissolution                                 Weight                      220-250 g.
medium maintained at 37±0.5°C.
                                                                                              Gender                      Male

                                                                                              Groups                      2
Ingredien
                                                                                              Control                     2
ts
                                                                            MB10

(mg/tabl                                                                                      Observational               4
                MB1

                       MB2

                             MB3

                                    MB4

                                           MB5

                                                 MB6

                                                        MB7

                                                              MB8

                                                                     MB9

et)
Methylen                                                                           After suitable dose conversions, mini tablets were prepared for
               10     10     10    10      10    10    10     10    10     10
e blue                                                                             rats with 0.235 mg. of methylene blue. Tablets of 2 mm
Camphor        10     5      10    15      5     10    15     5     10     15      diameter. were compressed by using multi pin head punches
Crospovi                                                                           and evaluated. Six animals were acclimatized to experimental
               0      2      2     2       5     5     5      8     8      8       room for 5 days. On the day of experiment, two rats were used
done
Saccharin      5      5      5     5       5     5     5      5     5      5       as control and remaining 4 rats were used for observation of
                                                                                   stain pattern using developed diagnostic aid. All the animals
Magnesiu
                                                                                   were put on fast overnight, before the day of study. Four rats
m           2    2    2    2     2    2     2    2     2                   2
                                                                                   were stained using methylene blue tablets. During the
Stearate
                                                                                   administration, rat was placed in a body-restraint device,
Pearlitol
            73 76 71 66 73 68 63 70 65                                     60      which exposed the animal’s head, and jaws were lifted apart
SD
                                                                                   with a wooden tongue depressor. Subsequently, mini tablet
Total       10 10 10 10 10 10 10 10 10                                     10
                                                                                   was placed in the rat’s mouth, wetting with 2 mL of water. At
weight      0    0    0    0     0    0     0    0     0                   0
                                                                                   the same time, a gentle tension was applied to restrain the
Table 1: Composition of MB fast disintegrating tablets
                                                                                   mouth of the rat for 1 min in order to ensure complete

This work is partly presented at 23rd International Conference and Exhibition on Pharmaceutical Formulations held on July 27-28, 2020 at Zurich, Switzerland.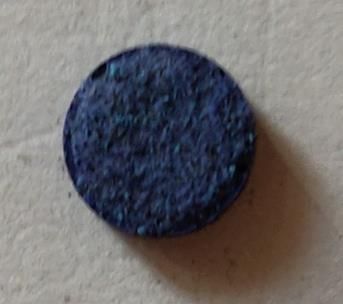
Manuscript                           American Journal of Drug Delivery and Therapeutics                                                              2020
                                                                                                                                                       Vol.7 No.3

disintegration of the tablet and thus prevented chewing. One                       Powder blend was evaluated for different flow properties [13].
animal was euthanized under anesthesia at each time interval                       The results are indicated in Table 3.
i.e. 15, 30, 60 and 120 minutes after dye instillation by sodium                   All the prepared blends showed mostly good flow properties
pentothal injection and esophagus was isolated and observed.                       which were evident from angle of repose, Hausner’s ratio and
One animal from control group was also subjected to                                CI values and hence, blends were further used for direct
euthanasia and was used to observe esophagus without                               compression.
diagnostic aid. After completion of observational studies,
carcass disposal was carried by incineration (Passco                               Table 3: Micromeritic properties of pre compression blend.
Environmental Solutions Pvt. Ltd., Pune).                                          Formulation Bulk       Tapped CI       Hausner's Angle of
                                                                                   Code         density density (%) ratio           repose°
4. RESULTS & DISCUSSION                                                                         (g/cc) (g/cc)
4.1. Analytical estimation
                                                                                   MB1              0.48        0.54         11.10 1.12           24.41
λmax of MB in pH 6.8 phosphate buffer was observed at 663
nm as represented in Fig 1. and was coinciding with the                            MB2              0.51        0.59         13.55 1.15           22.21
reported value[12]. MB obeyed Beer’s law in the concentration
range of 2-10 µg/mL in pH 6.8 phosphate buffer and standard                        MB3              0.40        0.49         18.36 1.22           24.41
curve is represented in Fig. 2.
                                                                                   MB4              0.47        0.54         12.96 1.14           24.78

                                                                                   MB5              0.48        0.53         9.43 1.10            24.76

                                                                                   MB6              0.50        0.58         13.79 1.16           23.34

                                                                                   MB7              0.51        0.60         15.00 1.17           22.25

                                                                                   MB8              0.52        0.64         18.70 1.23           23.81

                                                                                   MB9              0.57        0.66         13.60 1.15           24.12

                                                                                   MB10             0.59        0.70         15.70 1.18           24.25

Fig. 1: λmax determination of MB in pH 6.8 phosphate buffer                        4.3. Evaluation of tablets
                                                                                   The sublimation temperature and time were fixed as 60°C for 6
                                                                                   hours respectively after initial trials. Weights of the tablets
                                                                                   before and after sublimation are given below in Table. 4 and
                                                                                   images of the tablet surface before and after sublimation are
                                                                                   given in Fig. 3 and all other tableting characteristics are given
                                                                                   in Table 5.

                                                                                   Table 4: Uniformity of weight before and after sublimation.
                                                                                   Formulation Camphor Initial            Weight after % loss
                                                                                                                                      a
                                                                                   code           wt.     in tablet       sublimation in
                                                                                                                     a
                                                                                                  mg          weight                     weight
                                                                                   MB1            10          98.5±2.2    89.5±2.6       9.13
                                                                                   MB2                5              99.8±1.3        94.9±1.5           4.90

                                                                                   MB3                10             102.4±1.8       93.6±2.4           8.59
Fig. 2: Standard curve for MB estimation in pH 6.8 phosphate
buffer                                                                             MB4                15             100.8±2.4       86.2±3.3           14.43
4.2. Micromeritic properties                                                                          5              100.9±2.2       96.4±2.6           4.45
                                                                                   MB5

This work is partly presented at 23rd International Conference and Exhibition on Pharmaceutical Formulations held on July 27-28, 2020 at Zurich, Switzerland.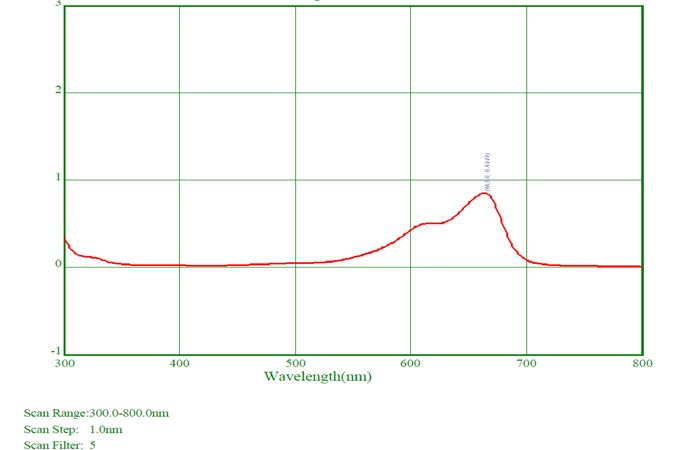
Manuscript                           American Journal of Drug Delivery and Therapeutics                                                               2020
                                                                                                                                                        Vol.7 No.3

MB6               10             99.6±1.6        90.1±2.1            9.53          can be attributed to the increased pores on tablets which
                                                                                   might have damaged the tablet integrity. Friability below 1%
MB7               15             101.9±1.8       87.9±2.6            13.9
                                                                                   was an indication of good mechanical resistance of the tablets.
MB8               5              101.6±2.6       96.6±3.1            4.92          However, in the present investigation tablets showing the
MB9               10             97.5±2.4        88.3±2.9            9.47          friability value more than 0.5% were not considered for further
                                                                                   studies.
MB10              15             98.6±1.9        84.2±3.4            14.6
                                                                                   Disintegration time (DT) of the prepared formulations was
a: mean±%deviation           n=20                                                  between 35 seconds to 84 seconds which indicated the
                                                                                   suitability for oral fast disintegrating tablets. It was dependent
                                                                                   both on the concentration of sublimating agent and
                                                                                   concentration of super disintegrant. Thus, all the prepared
                                                                                   tablets confirmed to the compendial parameters like,
                                                                                   uniformity of weight, friability, content uniformity, hardness,
                                                                                   thickness, and disintegration time.

                                                                                   4.4. In vitro dissolution study results
                                                                                    In vitro dissolution studies were performed, and results are
                                                                                   shown in Fig 4. Amount of sublimating agent and super
                                                                                   disintegrant influenced the dye release from all the
                                                                                   formulations. All the formulations from MB4 to MB9 showed
                                                                                   greater than 90% dye release in studied period. Formulations
A) Plain tablet surface before sublimation                                         MB9 and MB10 with 8% concentration of super disintegrant
                                                                                   showed about 90% release in 10 minutes while MB8 could
                                                                                   release the same in about 20 minutes. MB4, MB7, MB10 with
                                                                                   2, 5 and 8 % of super disintegrant and with 15 % camphor
                                                                                   showed more than 40, 50 and 80% dye release in 5 minutes.
                                                                                   With increased concentration of super disintegrant, faster dye
                                                                                   release was obtained and thus 8% super disintegrant
                                                                                   concentration was selected as optimum. The desired dye
                                                                                   release of greater than 85 % was achieved by MB9 and MB10
                                                                                   in the stipulated 10 minutes while remaining formulations took
                                                                                   longer period for the same. But, MB10 showed friability
                                                                                   greater than 1% among all the formulations prepared. MB9,
                                                                                   with 10 % camphor and 8% of super disintegrant was selected.
                                                                                   More than 85% dye was released in 10 minutes and about 75%
B) Surface with pores after camphor sublimation                                    was released within 5 minutes indicating its suitability for
                                                                                   staining esophagus and upper stomach. Hence, MB9 was
The percentage weight loss in tablet after sublimation was                         selected as optimized formulation and can be administered to
nearly equivalent to the quantity of camphor added, indicating                     the subject 30 minutes prior to endoscopy.
the process of sublimation of camphor. Only traces of camphor
were left confirming the suitability of selected temperature                           100
and time for complete sublimation of camphor.
                                                                                       Cummulative % dye

                                                                                           80
The hardness for all the formulations was found to be in the
range of 2.1-2.6 kg/cm2. The thickness of tablets was ranged                               60                                                   MB1
                                                                                           release

between 2.80 to 2.90 mm. Dye content was acceptable and
                                                                                           40                                                   MB2
found to be in the range of 97.3-99.3%. The friability values of
all formulations were found to be in between 0.19 to 1.02%. As                             20                                                   MB3
the concentration of camphor increased, friability increased
and all the formulations with 15% camphor showed friability                                    0
                                                                                                           0   20Time (Min)40                      60
greater than 0.5% (MB4, MB7) while MB10 showed 1.02%. This

This work is partly presented at 23rd International Conference and Exhibition on Pharmaceutical Formulations held on July 27-28, 2020 at Zurich, Switzerland.
Manuscript American Journal of Drug Delivery and Therapeutics 2020
Vol.7 No.3
4.5. Dye excipient compatibility studies:
Overlay plot of FTIR is given in Fig. 5. and data explained in
Table 6 while DSC curves are shown in Fig 6.
100
80
60
40
20
3962.18
3940.39
3925.32
3907.76
3849.60
3847.89
3785.10
3782.18
3752.61
3712.31
3398.45
3189.72
2974.16
2918.12
2852.74
1722.54
1656.00
1606.42
1553.10
1546.52
1496.27
1460.62
1434.24
1428.99
1372.58
1370.44
1324.66
1286.97
1234.38
1148.73
1126.77
1117.35
1081.47
1023.70
1019.64
955.46
882.59
881.62
843.95
810.85
753.73
721.74
707.07
671.14
670.45
639.90
630.55
587.41
577.03
4000 3500 3000 2500 2000 1500 1000
Wavenumber cm-1
D:\FTIR DATA\2019 FEB\A.Sarada.8 Methylene Blue SOLID 2/19/2019
D:\FTIR DATA\2019 FEB\A.Sarada.9 Methylene Blue Mixture SOLID 2/19/2019
Page 1/1
Fig. 7: SEM image of tablet surface A) Before sublimation
B) After Sublimation
The images clearly indicated the formation of porous surface
on the tablet after sublimation. A smooth even surface was
observed before sublimation which was replaced by
disarrangement and cracks after sublimation as shown.
4.7. Stability:
Tablets were evaluated for physical appearance, uniformity of
weight, hardness, friability, dye content and in vitro dissolution
using similar conditions as described earlier and results for
stability studies are represented in Table 7. Dissolution profiles
after long term storage conditions and accelerated storage
conditions are given in Fig 8 and Fig 9 respectively.
100
Cumulative %
80
dye release
Fig. 6: DSC thermogram A) Methylene blue B) Camphor C)
MB9
60
As the optimized formulation clearly showed retention of
characteristic bands of the dye in FT-IR, there was no physical 40
Initia
or chemical interaction between dye and selected excipient. l
Endothermic peak as observed with camphor at 200°C is 20
missing in the DSC thermogram of formulation. This can be
0
attributed due to sublimation of camphor. Endothermic peak
0 20 40 60
of methylene blue in formulation showed a slight shift to 140°C Time (min)
from 125°C in pure form.
4.6. SEM Analysis: Fig. 8: Dissolution profile of methylene blue fast disintegrating
Surface morphology of the tablets was observed before and tablets at long term storage conditions (30±2°C/70±5% RH)
after sublimation, SEM images were taken and represented in
Fig. 7.
This work is partly presented at 23rd International Conference and Exhibition on Pharmaceutical Formulations held on July 27-28, 2020 at Zurich, Switzerland.Manuscript American Journal of Drug Delivery and Therapeutics 2020
Vol.7 No.3
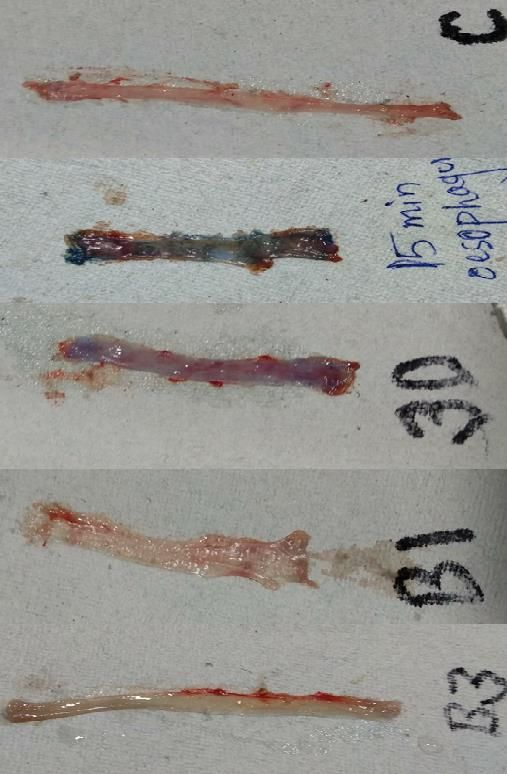
Fig 8: Esophagus at different time intervals
A) Esophagus of control group – colourless B) Esophagus of
observational group-15 minutes after dye C) Esophagus of
observational group-30 minutes after dye D) Esophagus of
observational group-60 minutes after dye E) Esophagus of
observational group-90 minutes after dye
In the presence of disease condition, methylene blue is
absorbed by the intestinal cells lining up the esophagus.
However, as there is no disease condition in these rats,
methylene blue release was observed but not persistent.
Simulation of Barrett’s esophagus condition in rats involves
critical procedures and ethical issues and hence, disease
condition was not studied in the present investigation.
Dissolution profile of methylene blue fast disintegrating
tablets at accelerated storage conditions (40±2°C/75±5% RH) 5. CONCLUSION
The in vivo results clearly indicated uniform staining
In vitro dissolution profiles were also overlapping and the at esophagus indicating the release of MB from the fast
formulation MB9 was further used for in vivo evaluation disintegrating tables confirmed the suitability for staining
esophagus. Thus, prepared MB9 formulation can be given 30
4.8. In vivo studies: minutes prior to endoscopy for surveillance and identification
Staining of esophagus was observed prominently in the rat of BE condition. Prepared methylene blues tablets can be used
sacrificed at 15 minutes time interval. The intensity of the as alternative for the spray technique and the dosage form
colour decreased at 30 minutes and complete disappearance ensures uniform dye distribution without any dye pool up, thus
of the dye was observed at 60 minutes and 90 minutes and the paving way for enhanced diagnostic accuracy.
esophagus resembled with that of control group. Esophagus as
observed at different time intervals is shown in Fig 8. Ethic clearance: The study was carried out at GLP certified
laboratory, (Certificate No: GLP/C-127/2018) Prado, Preclinical
Research and Development Organization, Pune, after approval
was obtained according to CPCSEA guidelines from Prado Pvt,
Ltd. Pune (1723/PO/RcBiBt/S/13/CPCSEA) with approval
number Prado/B/1905.
Conflict of interest: The authors certify that they have NO
conflict of interest in the subject matter or materials discussed
in this manuscript.
Acknowledgements: Corresponding author is thankful to
Department of Science &Technology, Government of India for
the financial support vide reference No. SR/WOS-A/LS-
430/2016 under Women Scientist Scheme to carry out this
work.
REFERENCES
[1] Trivedi PJ, Braden B. Indications, stains and techniques in
chromoendoscopy. QJM: An International Journal of Medicine.
2012; 106(2):117-131.
[2] Barret M, Camus M, Leblanc S, Coriat R, Prat F, Chaussade
S. Toward an easier indigo carmine chromoendoscopy. World
Journal of Gastrointestinal Endoscopy. 2015; 7(8):830.
This work is partly presented at 23rd International Conference and Exhibition on Pharmaceutical Formulations held on July 27-28, 2020 at Zurich, Switzerland.Manuscript American Journal of Drug Delivery and Therapeutics 2020
Vol.7 No.3
[3] ASGE Technology Committee, Wong Kee Song LM, Adler
DG, Chand B. Chromoendoscopy. Gastrointestinal Endoscopy.
2007; 66:639-649.
[4] Wang KK, Sampliner RE. Updated guidelines 2008 for the
diagnosis, surveillance and therapy of Barrett’s esophagus.
American Journal of Gastroenterology 2008; 103:788–797.
[5] Daly JM, Karnell LH, Menck HR. National Cancer Data Base
report on esophageal carcinoma. Cancer. 1996; 78(8):1820–
1828.
[6] Canto MI. Chromoendoscopy and magnifying endoscopy
for Barrett’s esophagus. Clinical Gastroenterology and
Hepatology. 2005;3(7): S12-15.
[7]https://www.hon.ch/OESO/books/Vol_6_Barrett_s_Esopha
gus/Articles/vol1/art028 Accessed on 25.3.2017.
[8] Kouklakis GS, Kountouras J, Dokas SM, Molyvas EJ,
Vourvoulakis GP, Minopoulos GI. Methylene blue
chromoendoscopy for the detection of Barrett’s esophagus in
a Greek cohort. Endoscopy. 2003; 35(05):383-387.
[9] O’Neil MJ, Smith A, Heckelman PE, Budavari S. The Merck
Index-An Encyclopedia of Chemicals, Drugs, and Biologicals.
Whitehouse Station, NJ: Merck and Co. Inc. 2006 p4045.
[10] International Agency for Research on Cancer. IARC
monographs on the evaluation of carcinogenic risk of
chemicals to man. 2016;108:155-182.
[11] International Council on Harmonisation. ICH Q1A (R2):
Stability testing of new drug substances and products Available
at: http://www.ich.org/LOB/media/Q1A R2 Guideline.pdf.
Accessed on 16.1.2018.
[12] Lide DR, editor. Handbook of data on organic compounds.
5. Compounds Pho-Zir. CRC Press; 1994 p4124.
[13] Carr RL. Evaluating flow properties of solids. Chemical
Engineering Journal. 1965; 72(3):163-168.
[14] Ovchinnikov OV, Evtukhova AV, Kondratenko TS, Smirnov
MS, Khokhlov VY, Erina OV. Manifestation of intermolecular
interactions in FTIR spectra of methylene blue molecules.
Vibrational Spectroscopy. 2016; 86:181-189.
This work is partly presented at 23rd International Conference and Exhibition on Pharmaceutical Formulations held on July 27-28, 2020 at Zurich, Switzerland.You can also read