Strategic Acquisition of Canadian Senior Housing Portfolio in Partnership with Le Groupe Maurice - June 3, 2019

Page created by Kathy Gordon
 
CONTINUE READING
Strategic Acquisition of Canadian Senior Housing Portfolio in Partnership with Le Groupe Maurice - June 3, 2019
Strategic Acquisition of Canadian Senior Housing
   Portfolio in Partnership with Le Groupe Maurice

June 3, 2019
Strategic Acquisition of Canadian Senior Housing Portfolio in Partnership with Le Groupe Maurice - June 3, 2019
Forward-Looking Statements; Non-GAAP Financials

This presentation contains “forward-looking statements” within the meaning of Section 27A of the Securities Act of 1933, as amended, and Section 21E of
the Securities Exchange Act of 1934, as amended. These forward-looking statements include, among others, statements of expectations, beliefs, future
plans and strategies, anticipated results from operations and developments and other matters that are not historical facts. The forward-looking statements
are based on management’s beliefs as well as on a number of assumptions concerning future events. Readers of these materials are cautioned not to put
undue reliance on these forward-looking statements, which are not a guarantee of performance and are subject to a number of uncertainties and other
factors that could cause actual events or results to differ materially from those expressed or implied by the forward-looking statements. The most important
factors that could prevent the Company from achieving its stated goals include, but are not limited to: (a) the ability and willingness of the Company’s
tenants, operators, borrowers, managers and other third parties to satisfy their obligations under their respective contractual arrangements with the
Company, including, in some cases, their obligations to indemnify, defend and hold the Company harmless from and against various claims, litigation and
liabilities; (b) the ability of the Company’s tenants, operators, borrowers and managers to maintain the financial strength and liquidity necessary to satisfy
their respective obligations and liabilities to third parties, including without limitation obligations under their existing credit facilities and other indebtedness;
(c) the Company’s success in implementing its business strategy and the Company's ability to identify, underwrite, finance, consummate and integrate
diversifying acquisitions and investments, including investments in different asset types and outside the United States; (d) the accuracy of estimates and
assumptions that the Company used to underwrite its acquisition of the interests in the joint venture with Le Groupe Maurice and to determine the projected
impact and benefits (including financial) of the transaction, and the potential for such estimates and assumptions, as well as the expected impact and
benefits, to change as additional information becomes available; (e) macroeconomic conditions such as a disruption of or a lack of access to the capital
markets, changes in the debt rating on U.S. government securities, default or delay in payment by the United States of its obligations, and changes in the
federal or state budgets resulting in the reduction or nonpayment of Medicare or Medicaid reimbursement rates; (f) the nature and extent of future
competition, including new construction in the markets in which the Company’s seniors housing communities and medical office buildings are located; (g)
the extent and effect of future or pending healthcare reform and regulation, including cost containment measures and changes in reimbursement policies,
procedures and rates; (h) increases in the Company’s borrowing costs as a result of changes in interest rates and other factors; (i) the ability of the
Company’s tenants, operators and managers, as applicable, to comply with laws, rules and regulations in the operation of the Company’s properties, to
deliver high-quality services, to attract and retain qualified personnel and to attract residents and patients; (j) the Company’s ability and willingness to
maintain its qualification as a REIT in light of economic, market, legal, tax and other considerations; (k) consolidation activity in the seniors housing and
healthcare industries resulting in a change of control of, or a competitor’s investment in, one or more of the Company’s tenants, operators, borrowers or
managers or significant changes in the senior management of the Company’s tenants, operators, borrowers or managers; and (l) the other factors set forth
in the Company‘s periodic filings with the Securities and Exchange Commission.

This presentation contains certain non-GAAP financial measures. You can find a reconciliation of these non-GAAP financial measures in the Investors
Relations section of the Company’s website: https://www.ventasreit.com/investor-relations/non-gaap-financial-measures.

The Company has not provided a reconciliation of its forecasted expected NOI growth ranges for the acquired portfolio to their most directly comparable
GAAP measure because the Company is unable to quantify certain amounts that would be required to be included in the comparable GAAP measure
without unreasonable efforts. For example, an estimate of the related GAAP measure would depend on seniors housing operator revenue and expenses
and foreign exchange rate movements, and such data are not currently available or cannot be currently estimated with confidence. Accordingly, the
Company believes that providing a reconciliation would imply an unwarranted degree of reliability of the assumptions underlying the estimated GAAP
measure and may be misleading to investors.

                                                                                                                                                                 2
Strategic Acquisition of Canadian Senior Housing Portfolio in Partnership with Le Groupe Maurice - June 3, 2019
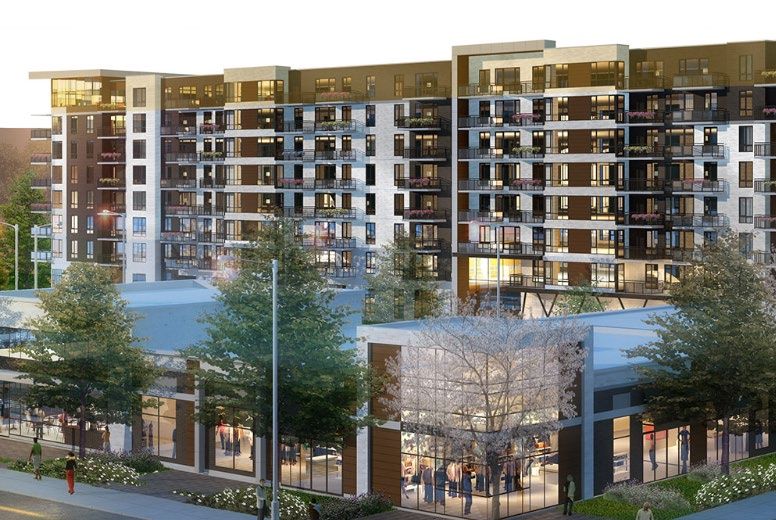
Le Groupe Maurice Transaction Overview
          Ventas invests in C$2.4B high-quality, Canadian seniors housing portfolio through 85/15% partnership with leading
          operator & developer Le Group Maurice; LGM to continue to manage portfolio

                                      Le Groupe Maurice (“LGM”) is a market leader in design, development and management of independent living in Quebec
                                      Founded in 1998, LGM has a high quality Canadian portfolio of 35 apartment-like, large-scale senior housing communities
      Transaction
       Overview                       Ventas is acquiring LGM’s portfolio through an 85/15% partnership with LGM, which will continue to manage the portfolio;
                                      LGM founder and principals to remain invested
                                      Ventas will have exclusive rights to own and fund all current and future developments under a pipeline agreement
                                      C$2.4B(1) total portfolio valuation (at 100%, including assumption of C$1.3B of debt) for 31 communities and 4 in-progress
                                      developments:
                                       28 stable assets: C$2.0B purchase price, C$255K per unit, estimated 5.5%(2) yield, acquired at or below replacement cost
       Portfolio /                     3 lease-up assets providing near term growth: C$0.3B purchase price, C$290K per unit, estimated 5.5%(2) stabilized yield
      Transaction
       Valuation                       4 in-progress developments: C$0.1B invested to date; C$0.4B projected total cost, C$280K per unit, estimated 6.5%(2)
                                        stabilized yield
                                       VTR investment equals 85% of C$2.4B and pro-rata share of returns
                                       Exclusive development pipeline: LGM anticipates developing 2 to 3 new communities each year
                                      Transaction expected to be $0.03 accretive to normalized FFO per share in 2020(2)

       Financial                      Target 4% net operating income (“NOI”) CAGR over next 5 years from 31 assets; target 2020 NOI of C$123-129M(2)(3)
       Highlights                     4 in-progress developments and additional 2-3 new starts per year expected to continue growth profile(2)
                                      Ventas’s Canadian footprint expected to increase to 7% of VTR NOI (21% SHOP NOI)
                                      Two-Step Transaction
                                       First step,
Strategic Acquisition of Canadian Senior Housing Portfolio in Partnership with Le Groupe Maurice - June 3, 2019
Highlights of the Transaction

                                            Stable, growing cash flows from 31 Class A, institutional quality, apartment-like seniors housing
                          1                 communities and 4 in-progress developments in high density core urban markets

                                        2               Investment in Quebec’s strong seniors housing market

                                                     3                   Target 4% NOI CAGR over next 5 years from 31 in-place and lease-up assets(1)

                                                            4                Attractive valuation for stable cash flows with embedded growth

                                                           5                Exclusive rights to future development pipeline

                                                                         Establishes new high quality platform for growth with top Canadian seniors housing
                                                    6
                                                                         developer / operator; builds on Ventas’s successful strategy with leading operators

                                            7                Diversification of Ventas’s portfolio, business model and operator base

                          8                 Positive financial impact

1. Forecasted estimates are based on a number of assumptions that are subject to change. There can be no assurance that the Company will achieve these estimated results.

                                                                                                                                                                            4
Strategic Acquisition of Canadian Senior Housing Portfolio in Partnership with Le Groupe Maurice - June 3, 2019
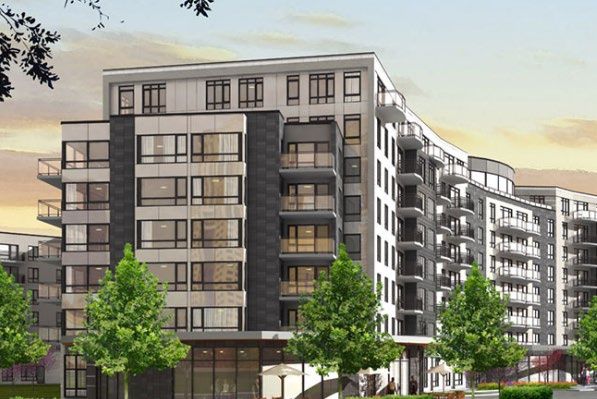
Stable, Growing Cash Flows from Class A, Institutional Quality, Apartment-
            Like Seniors Housing Communities

                     28-community stabilized portfolio has nearly 97% occupancy, RevPOR of over C$2,600,
                     and >280 unit average size(1)

                                                                                                      Ékla                       Floréa
                                                                                              Quebec City                       Montreal

                                                                                                    Caléo                      Station Est
                                                                                              Boucherville                      Montreal

                                                                                     Les Jardins Millen                           Sevä
                                                                                                  Montreal                      Montreal

                                                                                                     Le 22                       Boréa
                                                                                                  Montreal                      Montreal

1. Information was provided by LGM and is as of the date of the acquisition. RevPOR is defined as revenue per occupied unit.

                                                                                                                                             5
Strategic Acquisition of Canadian Senior Housing Portfolio in Partnership with Le Groupe Maurice - June 3, 2019
High Level Amenities Attract Younger Residents

                                                                                    Newly Constructed Portfolio (Units)(1)

 
           Residents are offered high quality and innovative
            services on an a la carte basis, allowing residents to                4,272
            choose best suited package

             All meals are optional via “meal tickets”
             Housekeeping & laundry
                                                                                                      Entire portfolio built after 2000
             Handyman                                                                              Average community is 8 years old

 
           Top tier amenity package encourages active and
            engaging common areas

             Indoor pool, spa, sauna, indoor beach, movie
                   theatre, virtual golf, pool tables and bowling alley
                                                                                                                  1,984

          Innovative technologies used to continuously
            improve and optimize operations
                                                                                                 1,890

             Large touch screen TV for residents to review daily
                   activities, menus; to be extended to mobile app for
                   residents and families

 
                                                                                                                                   771
           Building design and daily operation prioritize resident
            safety and security

 
           Diversified product offering includes rental units,
            condo units, and care units
                                                                               0 to 4 Years   5 to 9 Years    10 to 14 Years    15+ Years

 
           Average LGM resident length of stay is four years

1. Information was provided by LGM and is as of the date of the acquisition.

                                                                                                                                            6
Strategic Acquisition of Canadian Senior Housing Portfolio in Partnership with Le Groupe Maurice - June 3, 2019
Compelling Quebec Seniors Housing Profile

                                                                                                                                                                                               Highest Penetration Rate in Canada(1)
                                             • Large, thriving independent living market
     Best Seniors                            • ~18% penetration rate (2x Canadian average)                                                                                            17.9%     …and in-line with 17.7% in Montreal, a +140 bps
       Housing                                                                                                                                                                                  increase over past 5 years
      Market in                              • >93% occupancy,170 bps above the national average
       Canada                                  and 190 bps improvement since 2013
                                             • High quality product at affordable rates
                                                                                                                                                                                                 8.8%                                                     9.2%
                                                                                                                                                                                                          8.3%
                                             • Seniors expected to see 3.6% CAGR growth over next                                                                                                                  5.8%      5.7%       5.5%      5.4%
                                               20 years, doubling in total size
      Favorable                              • Growth requires 6,600+ new SH units annually over
       Demos                                   next 20 years to keep up with demand
                                             • Required supply equivalent to 20 large-scale, 300+ unit
                                               projects each year                                                                                                                    Quebec     Sask.     B.C.   Manitoba Alberta Ontario Atlantic Canada

                                                   Occupancy Above 93%(2)                                                                                                                       Strong Senior Population Growth(3)

                                                                                                                                                                                                                  CAGR: 3.6%
                                                                                                                                                                                   1,600,000                                                   14.5%        16.0%
                                                                                                                                                                                   1,400,000                                                                14.0%
                                                                                                                        10.7%

                                                                                                                                10.6%

      …and +190 bps improvement over past 5 years
                                                                                                                                        10.3%

                                                                                                                                                                                                                          11.1%
                                                                                                                                                                                   1,200,000                                                                12.0%
                                                                                                                                                9.7%

                                                                                                                                                                                   1,000,000            8.1%                                                10.0%
                                                                                                                                                       8.9%
                      8.7%

                                                                8.5%
              8.4%

                                                                              8.4%

                                                                                                                                                                                    800,000                                                                 8.0%
                                                                                                                                                              8.2%

                                                                                                                                                                            8.2%
       8.1%

                                                                       7.9%

                                                                                                                                                                     7.6%
                             7.5%

                                                                                                                                                                                    600,000                                                                 6.0%
                                    7.3%

                                                                                     7.0%
                                                         6.9%
                                           6.8%

                                                                                            6.7%

                                                                                                                                                                                    400,000                                                                 4.0%
                                                                                                                 6.5%
                                                  6.2%

                                                                                                   6.2%

                                                                                                          6.2%

                                                                                                                                                                                    200,000                                                                 2.0%
                                                                                                                                                                                                    682,700              1,005,350           1,379,300
                                                                                                                                                                                          0                                                                 0.0%
       '11 '12 '13 '14 '15 '16 '17 '18 '11 '12 '13 '14 '15 '16 '17 '18 '11 '12 '13 '14 '15 '16 '17 '18                                                                                                  2018               2028                 2038
                     Province of Quebec                                              Montreal                                                   Canada
                                                                                                                                                                                                        75+ Population            % of Total Population

1.   CMHC Senior Housing Report, Quebec 2018.
2.   CMHC and Statistics Canada, 2018.
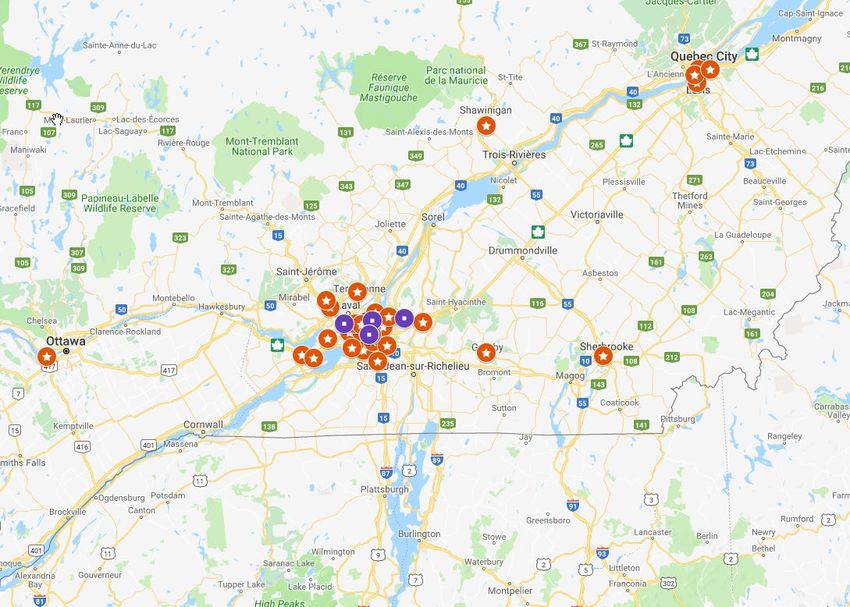
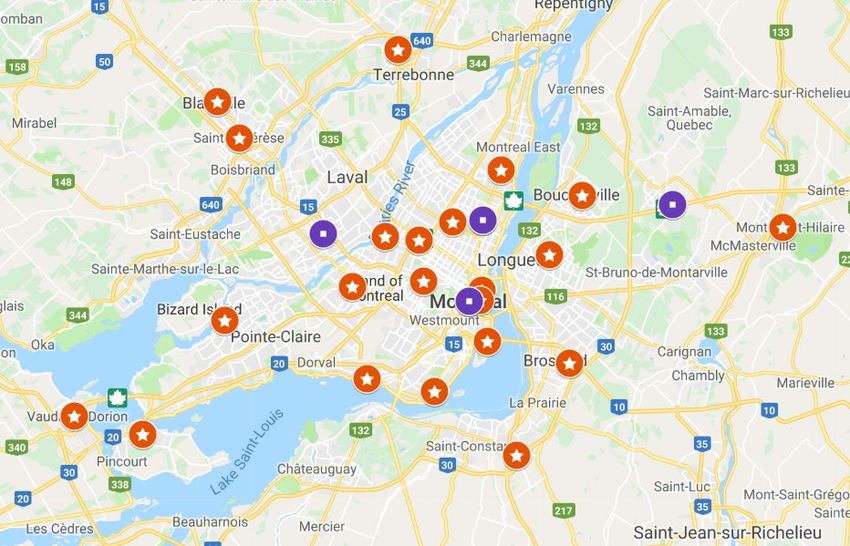
3.   NBFM Research Report, Healthcare Facilities: Initiating Coverage, 2018.                                                                                                                                                                                        7
Portfolio in High-Density, Urban Markets in Quebec

     Subject – Existing                 Quebec City        Portfolio Highlights
     Subject – Development
                                                         Purpose-Built, Class A /
                                                          Institutional Quality
                                                             Apartment-Like
                                                              Communities

                                                        Strategically Located with
                             Montreal                 ~90% of Units in Montreal and
                                                               Quebec City

                                                      Top Tier Amenities for Active
                                                             Adult Lifestyle
   Montreal Detail

                                                         Scalable Platform with
                                                        Opportunity for Sizeable
                                                         Development Pipeline

                                                                                      8
Strong Organic Growth Opportunity for 31-Property Operating Portfolio

                                                    Target NOI
                                                   CAGR: 4%(1)
                                                                                                                                                    Strong Projected Portfolio NOI Growth(2)
                                                                                                                                                    •       Stable portfolio provides a strong base of in-
                                                                                                                                                            place cash flow
                                                                                                                                                    •       Near term growth as 3 lease-up communities
                                                                                                                                                            stabilize
                                                                                                                                                    •       10 most recently completed and stabilized
                                                                                                                                                            developments averaged 25% occupancy in
                                                                                                                                                            month 1 and leased to 90%+ in 12 months on
                                                                                                                                                            average
                                                                                                                                                    •       Strong initial occupancy in 3 lease-up
                                                                                                                                                            communities:
                                                                                                                                                            −       L’Initial: 71% (opened Feb-19)
                                                                                                                                                            −       ORA: 50% (opened Apr-19)
                                                                                                                                                            −       Margo: 66% pre-leased (expected to open
                                                                                                                                                                    Jun-19)
                                    Current                                                  Year 5

1. Forecasted estimates are based on a number of assumptions that are subject to change. There can be no assurance that the Company will achieve these estimated results.
2. Information provided by LGM and is as of acquisition date.
                                                                                                                                                                                                              9
Growth Opportunity From Four In-Progress Developments

                                                                                          IVVI                                                                                                      Vast

                                                                                Laval, Quebec                                                                                        Sainte-Julie, Quebec

                                                                                      Elogia II                                                                                                     Liz

                                                                             Montreal, Quebec                                                                                         Montreal, Quebec

                                                             C$0.4B of development underway at targeted ~6.5% stabilized yield(1)
                 Large scale developments with size ranging from 285 to 400 units; scheduled deliveries late 2020 to 2021
                                       Total development cost per community expected to range between C$85M and C$115M

1. Forecasted estimates are based on a number of assumptions that are subject to change. There can be no assurance that the Company will achieve these estimated results. Yield determined by dividing forecasted year one
stabilized NOI for applicable properties by their purchase price allocations plus, in the case of in-process developments, their projected total project costs. Property considered stabilized once it achieves 95% occupancy.
                                                                                                                                                                                                                                 10
Le Groupe Maurice: Exciting New Platform For Growth

            Business Highlights                                                                             Strong Track Record of Organic Growth
            •       Founded in 1998, grew organically through development                                   40       Organic growth via development
                    from 1 property in 2000 to 35 today(1)                                                  35       of ~2 new communities annually
            •       4th largest seniors housing operator in Canada with over                                30
                    2,000 employees(2); Quebec-focused
                                                                                                            25

                                                                                             # Properties
            •       Fully integrated designer, developer and operator with top
                                                                                                            20
                    industry occupancy rates and a strong brand name
                                                                                                            15
            •       Named one of the 50 Best Managed Companies in Canada
                    for the 5th straight year(3)                                                            10
                                                                                                             5
            •       Plans to develop 2 to 3 communities annually
                                                                                                             0

                                                                                                                  2000
                                                                                                                  2001
                                                                                                                  2002
                                                                                                                  2003
                                                                                                                  2004
                                                                                                                  2005
                                                                                                                  2006
                                                                                                                  2007
                                                                                                                  2008
                                                                                                                  2009
                                                                                                                  2010
                                                                                                                  2011
                                                                                                                  2012
                                                                                                                  2013
                                                                                                                  2014
                                                                                                                  2015
                                                                                                                  2016
                                                                                                                  2017
                                                                                                                  2018
                                                                                                                  2019
                                                                                                                  2020
                                                                                                                  2021
            Management Team                                                                                 Occupancy Rates Above Industry Average(4)
                                                                                                            100.0%

                                                                                                            95.0%

                                                            Luc Maurice
                                                            President and Founder
                                                                                                            90.0%
                                                            Founded Groupe Maurice in 1998

                                                                                                            85.0%
                                                                                                                        2013      2014      2015       2016      2017       2018

                                                                                                                                   Industry Average   GM
                                                                                                                                                       LeStable
                                                                                                                                                         Groupe Maurice (Stable)

                                                                                                                     Top tier occupancy rates attributed to superior property
                                                                                                                 management, operational excellence and unique product offering

1.   Includes 4 development assets.
2.   Source: CBRE; ordered by existing units in Canada.
3.   Deloitte.                                                                                                                                                                     11
4.   CMHC Senior Housing Report for the respective years.
LGM Builds On Ventas’s Successful Strategy With Leading Operators

                                                        Platform                                Scalable Investments                                                                  Industry Leaders
                                                                                                  C$2.4B (USD $1.8B)                                  •    Leading seniors housing operator in Quebec with 20 years in
                                                                                                     Investment(1)                                         business and strong brand
                       Quebec                                                                                                                         •    Fully integrated designer, developer and operator with top industry
                       Seniors                                                                Target ~1.5x Growth in 5                                     occupancy rates
                       Housing                                                                 Years from In-Progress
                                                                                                       Devs. +                                        •    Historic growth via development from 1 property in 2000 to 35 today
                                                                                             2 - 3 New Devs. per Year(2)                              •    High demand market with expected additional developments

                                                                                                                                                      •    20M square feet
                                                                                                    $5.3B Investment
                        Medical                                                                                                                       •    Leading national MOB business
                        Office                                                                                                                        •    >160 hospital and health system affiliations
                                                                                                         >7x Growth
                                                                                                                                                      •    30+ year experienced platform

                                                                                                                                                      •    Top 10 national senior care provider
                                                                                                    $6.1B Investment
                     US Seniors                                                                                                                       •    34% Ventas investment in Atria operating company
                      Housing                                                                                                                         •    Strong alignment
                                                                                                          2x Growth
                                                                                                                                                      •    Unmatched scale, data and operational sophistication

                                                                                                    $2.0B Investment                                  •    6.1M square feet currently
                     Research &
                                                                                                                                                      •    >$1.5B development pipeline
                     Innovation
                                                                                                        33% Growth                                    •    Funding significant projects with top-tier universities

                                                                                                    $1.4B Investment                                  •    31 hospitals in 7 states
                        Health
                                                                                                                                                      •    Experienced capital backing
                       Systems
                                                                                                     Ardent Scaled 2x                                 •    Ardent filed for IPO

                                                Long Term Partnership with Leader in Canada with Growth Potential

1. At 100% ownership.
2. Forecasted estimates are based on a number of assumptions that are subject to change. There can be no assurance that the Company will achieve these estimated results.
                                                                                                                                                                                                                                 12
Transaction Further Diversifies VTR Portfolio, Business Model and Operators
                                                     Canada NOI                                                                                                                    Canada SHOP NOI
                        In Place                                                              Pro Forma                                                                 In Place                    Pro Forma
                                                                                                               Canada,
                                                                                                                                                                               Canada,
                                          Canada,                                                                7%                                                                                             Canada,
                                                                                                                                                                                12%
                                            4%                                                                                                                                                                   21%

            Ex-
                                                                                                                                                                                                Ex-
          Canada,                                                                                                                                              Ex-
                                                                                            Ex-Canada,                                                                                        Canada,
           96%                                                                                                                                               Canada,
                                                                                               93%                                                                                             79%
                                                                                                                                                              88%

                                                    Operator NOI
                                                                                                                                                     Key Takeaways(1)
                        In Place                                                              Pro Forma
                                                                                                                                                     •       Le Groupe Maurice becomes a top 10 VTR operator,
             Other,
                                               Atria, 19%
                                                                                   Other,                                                                    with estimated 4% NOI from LGM’s apartment-like
                                                                                                                   Atria, 18%
             23%                                                                   22%
                                                                                                                                                             communities
                                                       Lillibridge,     Eclipse,
  Eclipse,
                                                           11%            3%
                                                                                                                             Lillibridge,
                                                                                                                                                     •       Canada NOI estimated to increase to 7%
    3%                                                                 Holiday,                                                  10%
   Holiday,                                                              3%
     3%
                                                                      Le Groupe
                                                                                                                                                     •       Canada SHOP NOI estimated to increase to 21% of
   PMB, 5%                                                             Maurice,
                                                                         4%
                                                                                                                         Brookdale,                          SHOP NOI
                                                    Brookdale                                                                9%
         Ardent,                                                          PMB, 5%
           6%                                         , 9%                                                          Sunrise,
             Kindred,                       Sunrise,
                                                                         Ardent, 6%
                                                                                       Kindred,     Wexford,
                                                                                                                      8%                             •       Canadian portfolio increases from 41 properties to 76
                6% Wexford, 7%                9%                                         6%           7%
                                                                                                                                                             properties

Source: Data per Q1 2019 press release, supplemental and earnings conference call dated 4/26/2019. Totals may not add due to rounding.
1. Forecasted estimates are based on a number of assumptions that are subject to change. There can be no assurance that the Company will achieve these estimated results.
                                                                                                                                                                                                                   13
Highlights of the Transaction

                                            Stable, growing cash flows from 31 Class A, institutional quality, apartment-like seniors housing
                          1                 communities and 4 in-progress developments in high density core urban markets

                                        2               Investment in Quebec’s strong seniors housing market

                                                     3                   Target 4% NOI CAGR over next 5 years from 31 in-place and lease-up assets(1)

                                                            4                Attractive valuation for stable cash flows with embedded growth

                                                           5                Exclusive rights to future development pipeline

                                                                         Establishes new high quality platform for growth with top Canadian seniors housing
                                                    6
                                                                         developer / operator; builds on Ventas’s successful strategy with leading operators

                                            7                Diversification of Ventas’s portfolio, business model and operator base

                          8                 Positive financial impact

1. Forecasted estimates are based on a number of assumptions that are subject to change. There can be no assurance that the Company will achieve these estimated results.

                                                                                                                                                                            14
You can also read