2018 Retail Roadshow Presentation - Argosy Property

Page created by Joseph Schwartz
 
CONTINUE READING
2018 Retail Roadshow Presentation - Argosy Property
2018
Retail Roadshow
Presentation

Argosy Property Limited
28 May 2018 to 18 June 2018

   www.argosy.co.nz
2018 Retail Roadshow Presentation - Argosy Property
AGENDA

Highlights                                                                                Page 4

Financials                                                                                Page 6

Strategy                                                                                  Page 16

Leasing Update                                                                            Page 31

Outlook                                                                                   Page 35

PRESENTED BY:

Peter Mence CEO   Dave Fraser CFO

                                        Note: This result should be read in conjunction with the NZX stock exchange
                                        release dated 23 May 2018. Due to rounding, numbers presented in this
                                        presentation may not add up exactly to the totals provided and percentages
                                        may not exactly reflect absolute figures.

                                    2
2018 Retail Roadshow Presentation - Argosy Property
Our strength lies in the diversity of our
properties across sectors, grades, sizes
and locations allowing us to adapt to
the changing needs of our growing
family of tenants.

Peter Mence
CEO

                     3
2018 Retail Roadshow Presentation - Argosy Property
HIGHLIGHTS
                 Change image

             4
2018 Retail Roadshow Presentation - Argosy Property
HIGHLIGHTS

 $101m                        6.62c                          1.55c
Net property income       Net Distributable Income       4th Quarter Dividend +1.6%
                          per share +1.1%

                                                          $48.8m completed,
     $1.12                       3.0%                     including $33.8m of
                                                          green projects
NTA +5.5% on prior year   Annualised rent review         Value Add Developments
                          increase

   98.8%                  6.1 years                           6.25c
Occupancy (by rental)     WALT                           FY19 dividend guidance,
                                                         +1%

                                                     5
2018 Retail Roadshow Presentation - Argosy Property
FINANCIALS

     Change image

                    6
2018 Retail Roadshow Presentation - Argosy Property
Income Reconciliation

                   120.0

                                                                             2.5               0.4
                   110.0       106.8             1.3                                                                                      107.4
                                                              -1.3                                          -0.1         -2.2
                   100.0

                    90.0
Rental income $m

                    80.0

                    70.0

                    60.0

                    50.0

                    40.0

                    30.0
                           Gross Property   Acquisitions /   Disposals   Rent reviews   Vacancy & leasing   Other   Net movement re   Gross Property
                           Income FY17      developments                                      up                     NZ Post House    Income FY18

                                                                                   7
2018 Retail Roadshow Presentation - Argosy Property
Financial Performance
                                                                            FY18           F17
                                                                               $m           $m
Net property income                                                         101.0        100.8              Net income stable year on year
Administration expenses                                                      (9.9)        (9.3)             Expenses up due to additional
Profit before financial income/(expenses),                                                                  resourcing costs across the
                                                                             91.1         91.4
other gains/(losses) and tax                                                                                business
Interest expense                                                           (25.5)       (25.9)
Gain/(loss) on derivatives                                                   (4.1)        11.0              Non cash impact of derivatives
Revaluation gains                                                            47.3         42.3              Solid year-on-year revaluation
Realised gains/(losses) on disposal                                            0.3          2.7             gains largely driven by cap rate
                                                                                                            firming
Net: Insurance proceeds & earthquake
                                                                               0.2        (1.2)
expense
Profit before tax                                                           109.3       120.4
Taxation expense                                                           (11.1)       (16.8)              Lower taxation expense primarily
Profit after tax                                                             98.2       103.6               due to deferred tax movements

Basic and diluted earnings per share (cents)                                11.90        12.69

 Note: Due to rounding, numbers presented in this presentation may not add up exactly to the totals provided and percentages may not exactly reflect the
 absolute figures.
                                                                              8
2018 Retail Roadshow Presentation - Argosy Property
Distributable Income
                                                 FY18        FY17
                                                  $m          $m
Profit before income tax                         109.3       120.4
Adjusted for:
Revaluations gains                               (47.3)      (42.3)
Realised losses/(gains) on disposal                  (0.3)    (2.7)
Derivative fair value loss/(gain)                     4.1    (11.0)
Earthquake expense net of recoveries                 -0.2      1.2
Gross distributable income                           65.6     65.6
Depreciation recovered                                0.6      1.0
Current tax expense¹                             (11.6)      (13.1)   Current tax lower due to higher
                                                                      capitalised interest,
Net distributable income                             54.6     53.5
                                                                      depreciation and non-
Weighted average number of ordinary shares (m)   825.1       816.7    assessable insurance proceeds-
                                                                      reinstatement
Gross distributable income per share (cents)         7.95     8.03
Net distributable income per share (cents)           6.62     6.55
                                                                      Net distributable income
                                                                      increased 1.1%

                                                 9
2018 Retail Roadshow Presentation - Argosy Property
Investment Properties
                           Portfolio growth driven by a combination of developments completed and revaluation gains

                            1,550.0

                                                                                                                          47.3                       1,513.1
                                                                   61.4
                            1,500.0                                                                                                     -0.3
                                                                                   -10.1

                                            1,442.2                                                  -27.4
                            1,450.0
Investment Properties $m

                            1,400.0

                            1,350.0

                            1,300.0

                            1,250.0

                            1,200.0
                                      Investment Properties   Capitalised costs   Disposals   Transfer to properties   Revaluations   Other    Investment Properties
                                             FY17                                                 held for sale                                       FY18

                                                                                              10
Movement in NTA per share
                     Annual revaluation gain key driver of 5.5% NTA uplift year on year

              1.20

                                                                                    0.01
              1.18                                                   0.05

              1.16

              1.14
                                                  0.06
$ per share

                                                                                                                   1.12
              1.12
                                                                                                   (0.06)
              1.10

              1.08
                                 1.06
              1.06

              1.04

              1.02

              1.00
                           NTA at FY17    Profit for the year*   Revaluations    DRP & other   Dividends paid   NTA at FY18

               * Excluding revaluations

                                                                            11
Gearing
                                                                     FY18       FY17
                                                                       $m         $m
 Investment properties                                             1,513.1    1,442.2
 Assets held for sale                                                 27.4       13.0
 Other assets                                                          4.3        3.4
 Total assets                                                      1,544.8    1,458.6
 Bank debt (excl. capitalised borrowing costs)                      554.2       529.9
 Debt-to-total-assets ratio                                         35.9%      36.3%

 Further divestment of non Core assets will see the portfolio repositioned to the lower end of its retail
 band (15-25%) and higher end of industrial band (40-50%) over next 12-18 months.

 The asset held for sale is 7 Wagener Place (Auckland), sold for $31.0m and which settles in July 2018.

 New target policy gearing range of between 30-40% (previously 35-40%).

          35.9%
       Debt-to-total assets ratio
                                                 12
Portfolio Snapshot
Our focus is delivering improved portfolio quality and is reflected in our strong portfolio metrics

                               Occupancy                                        WALT (years)
      100.0%
                                                              7.0
       98.0%
       96.0%                                                  6.0
       94.0%                                                  5.0
       92.0%
                                                              4.0
       90.0%
       88.0%                                                  3.0
       86.0%
                                                              2.0
       84.0%
       82.0%                                                  1.0

       80.0%                                                  0.0
                 FY14     FY15      FY16      FY17    FY18           FY14    FY15      FY16     FY17   FY18

                        Net Tangible Assets                                  Debt-to-total-assets
     $1.15                                                   45.0%
                                                             40.0%
     $1.10
                                                             35.0%

     $1.05                                                   30.0%
                                                             25.0%
     $1.00
                                                             20.0%

     $0.95                                                   15.0%
                                                             10.0%
     $0.90
                                                              5.0%

     $0.85                                                    0.0%
               FY14     FY15       FY16    FY17      FY18             FY14    FY15     FY16     FY17   FY18

                                                             13
Funding & Interest Rate
Management
                                                                      FY18         FY17
       Weighted average duration of bank facility                 3.1 years   2.5 years
       Weighted average interest rate1                               4.98%         4.88%
       Interest Cover Ratio                                            3.3x         3.4x
       % of fixed rate borrowings                                      62%          65%
       Average fixed interest rate2                                  4.56%         4.56%

 Argosy maintains strong relationships with its banking partners ANZ Bank New Zealand Limited, Bank
 of New Zealand and The Hongkong and Shanghai Banking Corporation Limited, and remains well
 within its banking covenants.
 Argosy restructured its syndicated bank facility in May 2017 and February 2018.

                                                                    3.1 years
                                                                  Weighted avg. bank facility term
¹ Including margin and line fees
2 Excluding margin and line fees

                                                    14
Dividends
 A final quarter cash dividend of 1.55 cents per share has been declared, with imputation credits of
 0.3744 cents per share attached, and will be paid on 27 June 2018

 FY19 dividend guidance of 6.25 cents per share is an increase of ~1.0% on the FY18 full year
 dividend

 The FY19 dividend reflects the Boards wish for shareholders to share in the continued strong results
 whilst allowing Argosy to maintain its momentum towards an AFFO based dividend policy over the
 medium term

                 6.25c                                          27 June
                FY19 dividend guidance                         Final quarter dividend paid

                                               15
Strategy Overview

                    16
Strategy
Argosy will continue to invest in a diverse range of properties across sectors, grades, sizes and
locations.

Our Investment Strategy consists of Core and Value Add properties.
   Core properties between 75-90% of the portfolio by value.

Our Investment Policy sector band parameters (by value) are:
   Industrial 40-50%
   Office 30-40%
   Retail 15-25%

As at 31 March 2018, Argosy was operating within the parameters of its Investment Policy.

Argosy strives to deliver reliable and sustainable returns to shareholders. We take a considered
approach to acquisition, divestment, development, leasing and capital management decisions,
reflecting our proposition to shareholders as a dividend stock, with all the advantages of the
PIE Regime.

                                                   17
Portfolio at a glance

  TOTAL PORTFOLIO VALUE           TOTAL PORTFOLIO VALUE            PORTFOLIO MIX
  BY SECTOR                       BY REGION                        BY VALUE

                                              5%                               6%
        20%                                                               7%

                                      24%
                     42%

                                                        71%
       38%
                                                                                       87%

    Industrial                         Auckland                      Core properties

    Office                             Wellington                    Properties and land to divest

                                       Regional North Island &       Value Add properties
    Retail
                                       South Island

 Focus on continuing the divestment programme of non Core assets

 Expect to move towards the higher end of the industrial band and lower end of the retail band
 over the medium term

                                               18
Portfolio Metrics
  The strength of our diversified portfolio is in the breadth and depth of our tenant base and sectors
  they represent.

            Rent Roll by Industry   Government                        Top 10 Customers by Rent   MBIE
                                    Administration                                               NZ Post
                                    Retail
                                                                                                 General Distributors
                                    Transport and Storage                                        Cardinal Logistics

                                    Manufacturing                                                The Warehouse

                                                                                                 Ezibuy
                                    Property & Business
                                    Services                                                     Ministry of Primary
                                    Wholesale Trade                                              Industries
                                                                                                 Mitre 10
                                    Finance and Insurance                                        Te Puni Kokiri

                                    Electricity, Gas and Water                                   Tonkin & Taylor
                                    Supply
                                                                                                 All other
                                    All other

Note: Data as at 31 March 2018

                                                                 19
Revaluations

                                           31 March                                       Market Yield1
                                                                                                               Strong revaluation gain 3.2% above
                                                         31 Mar 18
                                            18 Book
                                              Value
                                                         Valuation
                                                                        Δ
                                                                       $m
                                                                                 Δ
                                                                                 %
                                                                                                               book value
                                                             ($m)                      31 Mar 17   31 Mar 18
                                               ($m)

Auckland                                       1,025.4      1,081.5    56.1    5.5%     7.14%       6.75%
                                                                                                               Regionally, Auckland biggest
                                                                                                               contributor
Wellington                                      367.1         358.1    (9.0)   -2.5%    7.53%       7.60%

North Island Regional & South Island             73.3          73.5     0.2    0.3%     8.70%       7.96%      Wellington office: Stout Street
Total                                         1,465.8       1,513.1    47.3    3.2%     7.31%       6.98%      recorded $13m increase but overall
                                                                                                               result offset by 7 Waterloo Quay
                                           31 March                                        Market Yield
                                            18 Book
                                                         31 Mar 18
                                                         Valuation
                                                                        Δ        Δ                             (earthquake) and Stewart Dawson
                                              Value
                                               ($m)
                                                             ($m)
                                                                       $m        %
                                                                                       31 Mar 17   31 Mar 18   Corner which is currently under
Industrial                                      598.5         637.5    39.0    6.5%     7.12%       6.74%
                                                                                                               development
Office                                          571.7         577.3     5.6    1.0%     7.58%       7.37%      At 83%, the Industrial portfolio
Retail                                          295.6         298.3     2.7    0.9%     7.27%       6.80%      biggest contributor of the total gain
Total                                         1,465.8       1,513.1    47.3    3.2%     7.31%       6.98%      followed by office (12%) and retail
                                                                                                               (5%)

                                                                                                               Portfolio market yield firmed 33bps
                                                                                                               with Auckland firming 39bps and
                                                                                                               Industrial 38bps

        1   Yields exclude 7 Waterloo Quay and Stewart Dawson Corner

                                                                                        20
Value Add
The following properties have been designated as Value Add,
which make up ~6% of the total portfolio:

                                                                    Market Value1
Property                                   Sector      Location
                                                                        $m
 90 - 104 Springs Road                    Industrial   Auckland          5.4
 80 Springs Road                          Industrial   Auckland         10.0
 211 Albany Highway                       Industrial   Auckland         20.5
 960 Great South Road                     Industrial   Auckland          6.1
 99-107 Khyber Pass Road                   Office      Auckland          8.7
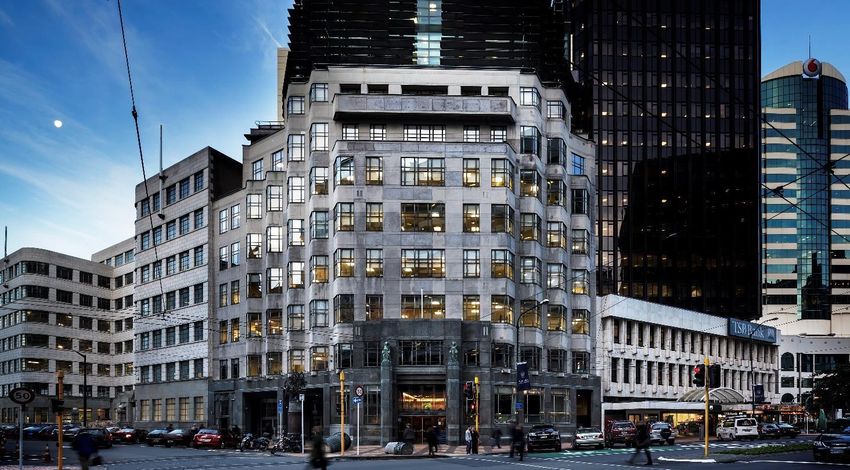
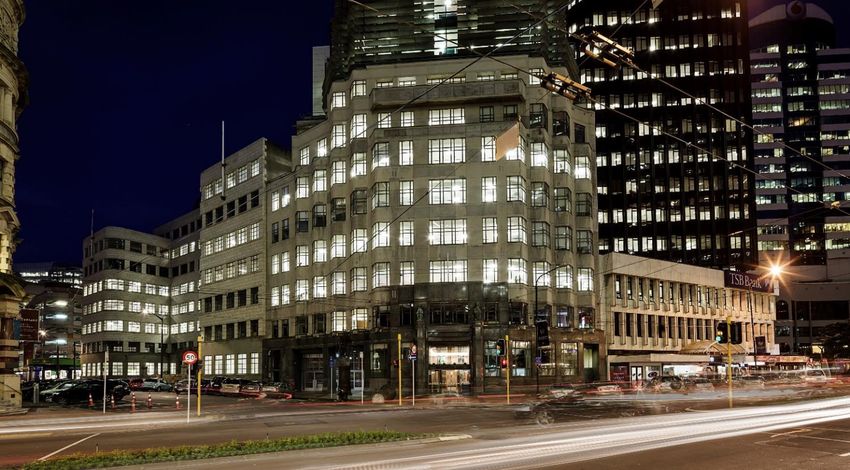
 8-14 Willis Street / Stewart Dawson Cnr Office/Retail Wellington       26.3
 180-202 Hutt Road                         Retail      Wellington        9.3
TOTAL $m (excl. land)                                                   86.3
 56 Jamaica Drive                           Land       Wellington        1.1
 15 Unity Drive                             Land       Auckland          4.3
 246 Puhinui Road                           Land       Auckland          3.2
TOTAL $m                                                                94.9

 ¹ At 31 March 2018
                                                             21
Value Add – Stewart Dawson Corner

                   22
Value Add – Stewart Dawson Corner

                   23
Industrial

NUMBER OF BUILDINGS

36
MARKET VALUE OF ASSETS ($M)

$637.6
OCCUPANCY (BY INCOME)

99.9%
WALT (YEARS)

7.4
PASSING YIELD

6.7%

                              24
Office

NUMBER OF BUILDINGS

17
MARKET VALUE OF ASSETS ($M)

$577.3
OCCUPANCY (BY INCOME)

97.3%
WALT (YEARS)

5.0
PASSING YIELD

7.0%

                              25
Retail

NUMBER OF BUILDINGS

8
MARKET VALUE OF ASSETS ($M)

$298.3
OCCUPANCY (BY INCOME)

100%
WALT (YEARS)

5.7
PASSING YIELD

7.1%

                              26
Completed Developments
                                                                                 Total Cost
                                                                                    $m
Development                     Major Tenant             Type        Location

Highgate Business Park           Mighty Ape              IND           AKL         24.7

82 Wyndham                         Panuku                OFF           AKL          9.1

Foundry Drive                Polarcold Stores Ltd        IND           CHC          7.5

Snickel Lane                       Various               OFF           AKL          7.5
TOTAL                                                                              48.8

 Argosy completed two green developments totalling $33.8m during the period being Highgate
 Business Park (targeting 4 Green Star Industrial Built Rating) and 82 Wyndham Street (targeting 5
 Green Star Office Built Rating).

 82 Wyndham will be targeting a 4 Star NabersNZ energy efficient rating now the building is fully
 occupied.

                                                27
Green Case Study
82 Wyndham Street, Auckland

                                        BEFORE:                     AFTER:
    Valuation                           $29.0m (31 March 2017)      $42.3m (31 March 2018)
    Building rating:                    nil                         Targeting 5 Star Office Built Rating
    NABERSNZ rating:                    nil                         Targeting 5 Star Office Base Build Rating
    Total project capex¹                                            $9.1m
 NEW FEATURES:
    Replaced air conditioning system to 100% above building code with CO 2 sensors
    LED lighting with intelligent controls (daylight & occupancy)
    Material increase in the building’s end of trip facilities
    Energy monitoring capability to facilitate NABERSNZ measurement and emission reporting
 1. Including green aspects
                                                         28
Green Case Study
Highgate Business Park, Auckland

                                                         BEFORE:          AFTER:
    Valuation                                            Nil              $28.2m (31 March 2018)
    Building rating:                                     nil              Targeting 4 Star Industrial Built Rating
    NABERSNZ rating:
                                                         nil              nil
    Total project capex¹
                                                                          $16.6m
 NEW FEATURES:
    Air conditioning system to 50% above building code with CO 2 sensors
    LED with intelligent controls for daylight and occupancy sensors throughout
    Energy metering meets Green Star requirements and separates lighting, air-condition and three
    point power
    Rain water harvesting, for use in the gardens and toilets with water meters
 1. Excluding land valued at $8.1m, making a total value of $24.7m
                                                                     29
NZ Post House, at 7 Waterloo Quay
Damage Assessment
 Interim damage assessment reports now with insurers.

Insurance Claim
 Three interim claims made under Argosy’s material damage and business interruption insurance.
 Total recognised to 31 March was $9.8m (after deductible) and allocated as follows;
     Loss of rents: $5.7m, Material damage expense: $2.3m and Expense recoveries: $1.8m.

Reinstatement
 Proceeding swiftly with affected floors ready for occupation during FY19.
 Reinstatement work on Levels 1-4 & 7 and Levels 10-12.
 Programme cost estimated at $41 million to complete.

Leasing
 Levels 10-12 are expected to be ready for occupation by March-19.
 Very strong market enquiry.

                                                  30
Leasing Update

                 Change image

                 31
Leasing Success
   Excellent leasing results over the back half of the year driving the higher WALT of 6.1 years
   During the period Argosy completed 51 leasing transactions totalling ~150,000m² of NLA.
   Notable leasing successes include:

Property                             Tenant                                    NLA (sqm)      Lease Term
9 Ride Way, Albany                    Amcor Flexibles (New Zealand) Limited       9,178            15 years
8 Forge Way, Panmure                  Eclipx Fleet Holdings                       4,230            12 years
143 Lambton Quay                      Te Puni Kokiri                              6,215            6 years
105 Carlton Gore Rd, Newmarket        Tonkin & Taylor                             4,377            3 years
147 Lambton Quay                      MBIE                                        5,560            1.5 years

    Some larger FY19 lease expiries include:

Property                           Tenant                      NLA (sqm)                  Status
                                    The Information
147 Gracefield Rd, Seaview                                       8,018     In discussion with tenant
                                   Management Group
80 Springs Road, East Tamaki        Coda GP Limited              9,675     Extension to 31-Aug-18
                                                                           In discussion with tenant for
12-16 Bell Avenue, Mt Wellington   Mainfreight Limited           5,046
                                                                           extension

                                                       32
Lease Maturity
Lease maturity profile relatively stable over the medium term, no material single tenant exposure

                                       22%                                                                                                                      35

                                       20%
                                                                                                                                                                30
                                       18%
 Percentage of portfolio (by income)

                                       16%                                                                                                                13    25
                                                                                                                        12
                                       14%                                                                                                             15.0%
                                                                                                                                   8                            20
                                       12%                                                                          12.8%
                                                                                                            9
                                                     29     23               21
                                       10%                                                                                      11.3%
                                                           10.0%     28                                                                                         15
                                                    9.9%                    9.7%                        10.0%
                                       8%                          8.6%
                                       6%                                                       12                                                              10
                                                                                    17
                                       4%                                                    4.7%                                              4
                                                                                   4.2%                                                                         5
                                       2%                                                                                                   2.6%
                                             1.2%
                                       0%                                                                                                                       0

                                                                                                                                                         Year ending
                                                             Total Expiry    Vacancy         Largest Expiry
      The number above each bar denotes the total tenant expires per year (excluding monthly carparks and tenants with multiple leases within one property)

                                                                                            33
Market Update

Modest economic growth still forecast which will drive steady net absorption.

The mixture of a stable economy and continued technology change is driving demand for
industrial assets.

Growth in Auckland office supply is yet to cause concern, projections for increased vacancy
around 2020 are unchanged.

Wellington office vacancy continues to reduce with rental growth resulting.

Tougher funding environment will continue to impact developers. This will create potential
opportunities for Argosy.

Increasing construction costs and slowing of cap rate compression positives for rental growth if net
absorption continues.

Land values easing.

Focus on green assets, seismic performance and hazard management.

                                               34
Outlook

          Change image

          35
Outlook
 Fundamental real estate drivers remain sound.

 Whilst global volatility is still present, the New Zealand economic outlook is still positive with
 economic growth forecast and resilient local equity markets.

 Argosy’s diversified portfolio provides balance across sectors allowing it to make the most of
 market conditions.

 Argosy will continue to focus on resolving near term expiries, maintaining high tenant retention
 rates and ensuring core portfolio metrics remain strong.

 Given the market appears to be firmly valued, divesting non Core assets to reinvest elsewhere or to
 the balance sheet is more attractive versus acquiring.

 We will continue to focus on our existing portfolio of value add properties in the context of
 sustainability given the environmental and business benefits they can bring.

 We remain focused on creating value and delivering sustainable and attractive risk adjusted
 returns to shareholders.

 Rental growth to continue.

 Green assets will continue to see increase in demand.

                                                   36
Thank you.

             37
Disclaimer

This presentation has been prepared by Argosy Property Limited. The details in this presentation
provide general information only. It is not intended as investment or financial advice and must
not be relied upon as such. You should obtain independent professional advice prior to making
any decision relating to your investment or financial needs. This presentation is not an offer or
invitation for subscription or purchase of securities or other financial products. Past performance
is no indication of future performance.

All values are expressed in New Zealand currency unless otherwise stated.

28 May 2018

                                                  38
You can also read