GLOBAL AIDS MONITORING 2020 - Malaysia HIV/AIDS Progress Report Ministry of Health Malaysia
←
→
Page content transcription
If your browser does not render page correctly, please read the page content below

GLOBAL AIDS
MONITORING 2020
Malaysia HIV/AIDS Progress Report

Ministry of Health Malaysia
HIV/AIDS/Hepatitis C Sector
Disease Control Division

                              1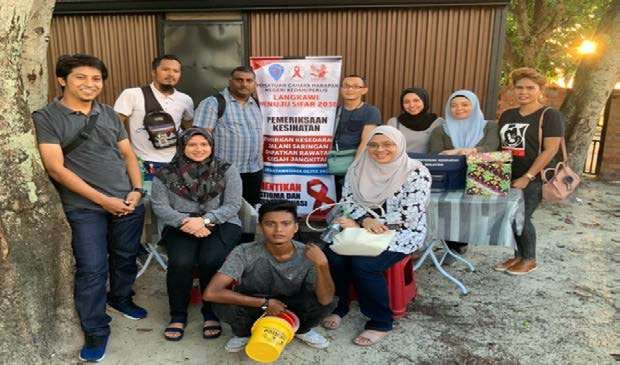
2

    MALAYSIA 2020
    COUNTRY PROGRESS REPORT TO HIV/AIDS EPIDEMIC
                                    Reporting Period:
                      January 2019 to December 2019

                                         Report prepared by:
                                  HIV/STI/Hepatitis C Section
                                     Disease Control Division
                                  Ministry of Health Malaysia
                                        Tel: +60 3 8883 4387
                                       Fax: +60 3 8883 4285

                                              Correspondence:
                                             Dr Anita Suleiman
                                          dranita@moh.gov.my

    Malaysia Global AIDS Reporting 2020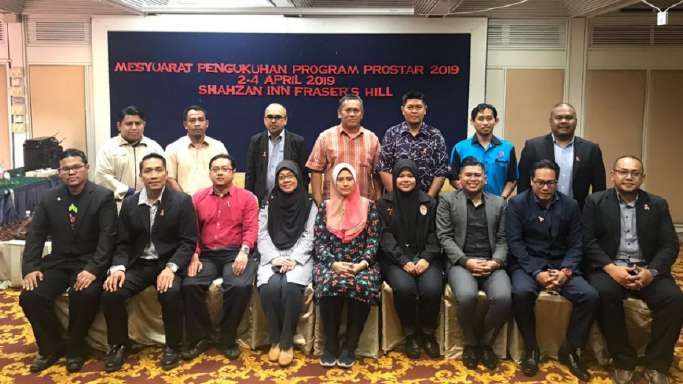
3

THE GLOBAL AIDS MONITORING REPORT 2020

This report was coordinated and produced by HIV/STI/Hepatitis C Section of Ministry
of Health Malaysia.

Editorial Team
Dr. Anita Suleiman (Chief Editor)
Head HIV/STI/Hepatitis C Sector, Ministry of Health Malaysia

Dr. Mazliza Ramly (Lead Author & Editor)
Senior Principal Assistant Director (Behavioral Research)
HIV/STI/Hepatitis C Sector, Ministry of Health Malaysia

LIST OF MAIN CONTRIBUTORS
1.    Dr Chai Phing Tze, HIV/STI/Hepatitis C Sector
2.    Dr Fazidah Yuswan, HIV/STI/Hepatitis C Sector
3.    En Azman Mohamed, HIV/STI/Hepatitis C Sector
4.    Dr Mohamad Naim, TB/Leprosy Sector
5.    En Parimelazaghan Ellan, Malaysian AIDS Council
6.    Pn Tamayanty Kurusamy, Malaysian AIDS Council
7.    Dr Rohemi Abu Bakar, State Health Department Perlis
8.    Dr Azlina Azlan, State Health Department Kedah
9.    Dr Janizah Abd Ghani, State Health Department Pulau Pinang
10.   Dr Ariza Abd Rahman, State Health Department Perak
11.   Dr Ismawati Ismail, State Health Department FT Kuala Lumpur & Putrajaya
12.   Dr Gurpreet Kaur, State Health Department Selangor
13.   Dr Sharifah Nor Ahmad, State Health Department Negeri Sembilan
14.   Dr Mahanim Md Yusof, State Health Department Melaka
15.   Dr Nurmawati Ahmad, State Health Department Johor
16.   Dr Shahdattul Dewi Nur Khairitza Taib, State Health Department Pahang
17.   Dr Mahani Nordin, State Health Department Terengganu
18.   Dr Nik Normanieza Nik Man, State Health Department Kelantan
19.   Dr Haseanti Hussien, State Health Department Sabah
20.   Dr Ruziana Miss, State Health Department Sarawak
21.   Dr Mohd Hafizuddin Ahmad, State Health Department FT Labuan

                      Malaysia Global AIDS Reporting 2020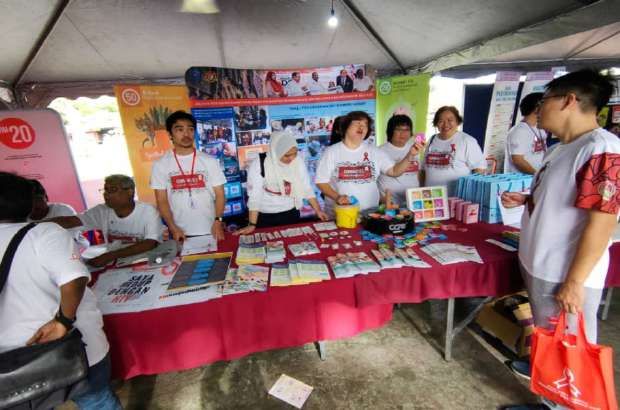
4

Table of Contents
State of the Epidemic ................................................................................................ 6
    Treatment Cascade .............................................................................................. 8
Prevention program ................................................................................................ 12
    Key populations .................................................................................................. 12
    Eliminating Mother-to-Child Transmission .......................................................... 14
Confronting Stigma and Discrimination .................................................................. 16
    Stigma Reduction Initiatives ............................................................................... 16
HIV and Other Infection .......................................................................................... 17
    HIV and Tuberculosis co-infection ...................................................................... 17
    HIV and Hepatitis C co-infection ......................................................................... 18
    Sexually Transmitted Infection ............................................................................ 19
Investing to End an Epidemic ................................................................................. 20
2019 galleries ......................................................................................................... 21

                                 Malaysia Global AIDS Reporting 2020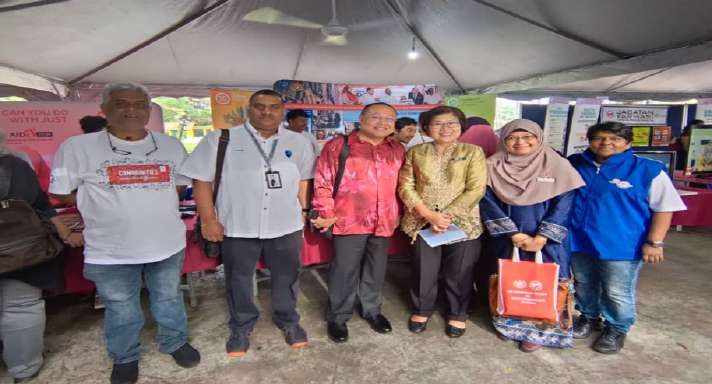
5

List of Figures
Figure 1: Annual Reported Cases, Malaysia, 1986-2019 ………………………………………………………………………………………. 7
Figure 2: HIV Incidence Rate per 1000 Uninfected Population, Malaysia, 2010-2019 ……………………………… 7
Figure 3: Top 5 States, Percentage of New HIV Infection, Malaysia, 2019 ……………………………………………………. 7
Figure 4: HIV Testing and Treatment Cascade, Malaysia, 2019 …………………………………………………………………………. 8
Figure 5: New HIV Infection, Malaysia, 1986-2019 ……………………………………………………………………………………………………. 9
Figure 6: Percent Change in New HIV Infection by State, Between 2010-2019 …………………………………………… 9
Figure 7: AIDS-related Deaths, Malaysia, 1986-2019 ………………………………………………………………………………………………. 9
Figure 8: Distribution of Reported Cases by Gender, 1987-2019 ………………………………………………………………………… 10
Figure 9: Trend of HIV Infection by Mode of Transmission, 2000-2019 ……………………………………………………………. 10
Figure 10: Distribution of HIV New Cases by State, 2019 ………………………………………………………………………………………. 11
Figure 11: Distribution of New Infection by Age Group, Malaysia, 2019 …………………………………………………………. 11
Figure 12: NSP and OST Coverage among PWID, 2016-2019 …………………………………………………………………………… 12
Figure 13: HIV Prevalence and Safe Injecting Practices among PWID, IBBS 2012-2017 ………………………. 13
Figure 14: Coverage of Prevention Programs among Key Populations, Malaysia IBBS 2012-2017 …… 13
Figure 15: Methadone Maintenance Therapy Clinic at Government Health Facility …………………………………… 13
Figure 16: HIV and Syphilis Test Coverage, 2010-2019 ………………………………………………………………………………………… 14
Figure 17: Cascade of Services for Preventing Vertical Transmission, Numbers of New HIV Infections
and eMTCT rate, 2019 ……………………………………………………………………………………………………………………………………………………………. 14
Figure 18: HIV Vertical Transmission Rate, 2012-2019 …………………………………………………………………………………………. 15
Figure 19: MTCT of Syphilis, 2010-2019 ………………………………………………………………………………………………………………………… 15
Figure 20: Percentage of Person Aged 15 to 49 years with Discriminatory Attitudes Towards PLHIV,
2014-2019 …………………………………………………………………………………………………………………………………………………………………………………… 16
Figure 21: Proportion of Newly Enrolled PLHIV with Active TB, 2015-2019 ………………………………………………… 17
Figure 22: PLHIV Newly Enrolled in HIV Care Started on IPT, 2015-2019 …………………………………………………… 17
Figure 23: HCV Epidemic in Malaysia, 2003-2019 …………………………………………………………………………………………………… 18
Figure 24: Proportion of PLHIV Starting on ART Who Were Tested for Hepatitis C, 2013-2019 ………… 18
Figure 25: Number of Men Reporting Urethral Discharge in the past 12 months, 2013-2019 ………………. 19
Figure 26: Safe Sex Practices at Last Sex, IBBS 2012-2017 ………………………………………………………………………………. 19
Figure 27: HIV Resources Availability by Source, 2017-2019 ……………………………………………………………………………… 20
Figure 28: AIDS Spending by Category, 2016-2019 ………………………………………………………………………………………………… 20

                          Malaysia Global AIDS Reporting 2020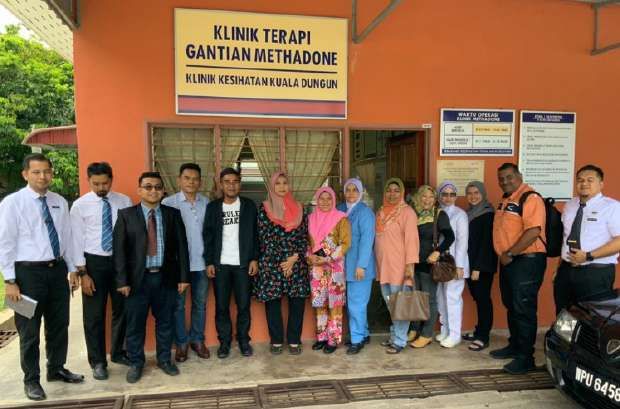
6

 State of the Epidemic
HIV/AIDS Epidemic Snapshot in Malaysia 2019
Number of People           Total                77,903               AT A GLANCE
Living with HIV            Male (15+ years)     66,369
                           Women (15+ years)    11,233
                           Children (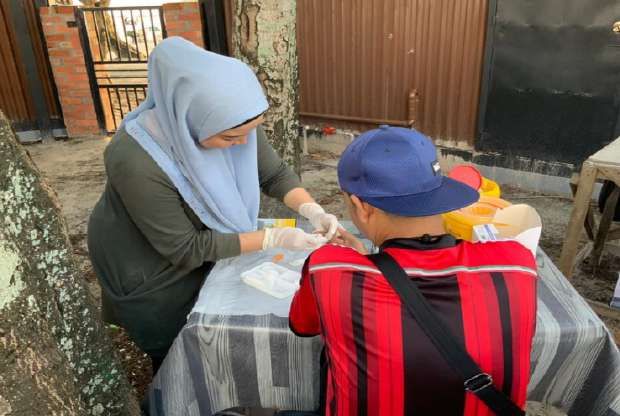
7

                                       Figure 1: Annual Reported Cases, Malaysia, 1986-2019
                       8000                                                                                                                      40

                       7000                                                                                                                      35

                       6000                          2002:    6,978                                                                  2019        30

                                                                                                                              3,564
     Number of cases

                                                                                                                                                      Notification rate
                       5000                                                                                                                      25

                       4000                                                                                                                      20
                                  1986
                                  First reported
                       3000       cases of HIV                                                                                                   15

                       2000                                                                                                                      10

                       1000                                                                                                                      5

                         0                                                                                                                       0
                                1985
                                1986
                                1987
                                1988
                                1989
                                1990
                                1991
                                1992
                                1993
                                1994
                                1995
                                1996
                                1997
                                1998
                                1999
                                2000
                                2001
                                2002
                                2003
                                2004
                                2005
                                2006
                                2007
                                2008
                                2009
                                2010
                                2011
                                2012
                                2013
                                2014
                                2015
                                2016
                                2017
                                2018
                                2019
                                                                                 TOTAL          Notification rate

                         Figure 2: HIV Incidence Rate Per 1000                                             Figure 3: Top 5 States, Percentage of New
                        Uninfected Population, Malaysia, 2010-                                                   HIV Infection, Malaysia, 2019
                                          2019
    0.25
                                                                                                    Selangor                                 30.4%
                                                                                         0.2
     0.2                0.19 0.19 0.19 0.19
                                                     0.18          0.18           0.18
                                                            0.17          0.17                         WPKL                   12.6%
    0.15
                                                                                                        Johor            9.5%
     0.1

                                                                                                     Sarawak            8.1%
    0.05

              0
                                                                                                      Penang            8.1%
                         2010

                                2011

                                       2012

                                              2013

                                                     2014

                                                            2015

                                                                   2016

                                                                          2017

                                                                                  2018

                                                                                         2019

                                                                                                              0.0%    10.0%    20.0%     30.0%             40.0%

                                                        Malaysia Global AIDS Reporting 2020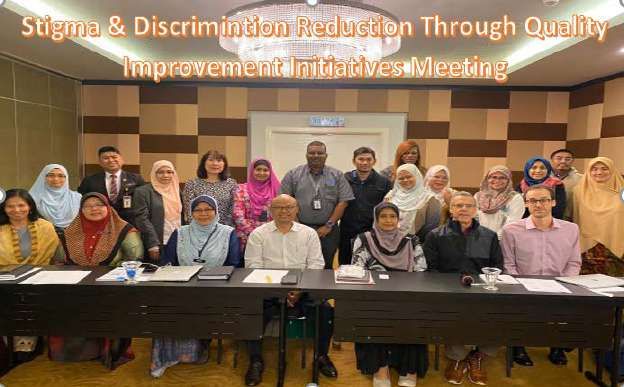
8

In 2019, the estimated people living in HIV (PLHIV) in Malaysia is around 87,000.
However, through our national surveillance system, close to 78,000 PLHIV were
notified out of which, 0.4% were children below 15 years of age. There were 3,564
people newly infected with HIV notified in 2019 (Figure 1), slightly more than half
(56%) of estimated new HIV infection in 2019. Estimated HIV incidence rate per 1000
uninfected population is showing an increasing trend in the past two years (Figure
2). The overall epidemic is concentrated in urbanized states of Selangor, Kuala
Lumpur, and Johor that contribute more than 50% of new HIV cases in Malaysia
(Figure 3).

Treatment Cascade
    Figure 4: HIV Testing and Treatment Cascade, Malaysia, 2019

Countries are left with just 1 year to reaching the fast track target of 90-90-90 by
2020. In that regard, Malaysia has achieved 89%-56%-85% which means in 2019,
89% of PLHIV in Malaysia know their status, 56% of them were receiving treatment,
and 85% of them were virally suppressed (figure 4). Linkage to care still represents
the single greatest challenge for Malaysia to reach 90-90-90 target as the highest
gap to reaching 90-90-90 target stood at number of PLHIV needed to access
treatment.

                               Malaysia Global AIDS Reporting 2020
9
Figure 5: New HIV Infection, Malaysia, 1986-2019
Malaysia has done a tremendous
work in reducing the annual number
of new HIV infections since its peak
in 2002 with our Harm Reduction
Program. However, since 2010, the
trend has reached a flat line. There
has been only a modest 0.9% decline
in the annual number of new HIV
infections in Malaysia since 2010
(Figure 5).
Several states showed strong
decline in new infections between
Figure 6: Percent Change in New HIV Infection by 2010 and 2019, such as Kelantan,
6 State, between 2010 & 2019
Terengganu, and Pahang (Figure 6).
Percent change in new HIV
4
2 In contrary, most urbanized states
0
like Selangor, Kuala Lumpur and
-2
-4
Penang showed increasing trend.
-6
Kelantan
Terengganu
Pahang
Johor
Perak
Melaka
Perlis
Labuan
Kedah
Sabah
NS
Sarawak
WPKL
Penang
Selangor
The reported AIDS-related deaths
last year had increased slightly in
2019 compared to 2010 (Figure 7).
Sabah was the only state with
declined AIDS-related deaths
greater than 50% during the 10-year
Figure 7: AIDS-related Deaths, Malaysia, 1986-2019
period. While, Selangor had the
highest increment of AIDS-related
deaths of more than 100% during
the same period. Since the
beginning of the epidemic, the
reported cases were predominantly
male (Figure 8).
Malaysia Global AIDS Reporting 2020
10
Figure 8: Distribution of Reported Cases by Gender, 1987-2019
8000 80
7000 70
6000 60
per 100,000 population
number of cases
5000 50
4000 40
3000 30
2000 20
1000 10
0 0
1986
1987
1988
1989
1990
1991
1992
1993
1994
1995
1996
1997
1998
1999
2000
2001
2002
2003
2004
2005
2006
2007
2008
2009
2010
2011
2012
2013
2014
2015
2016
2017
2018
2019
Female Male Male-specific rate Female-specific rate
Figure 9: Trend of HIV infection by Mode of Transmission, 2000-2019
PWID Hetero Homo Vertical
Blood/organ transfer Indeterminate PWID/Sex ratio
100.0% 6.0
90.0%
5.0
80.0%
70.0%
4.0
Proportion
60.0%
Ratio
50.0% 3.0
40.0%
2.0
30.0%
20.0%
1.0
10.0%
0.0% 0.0
2000
2001
2002
2003
2004
2005
2006
2007
2008
2009
2010
2011
2012
2013
2014
2015
2016
2017
2018
2019
In the past one decade, the country observed gradual changes in the HIV epidemic
landscape from predominantly PWID to more sexual transmission (Figure 9). The
proportion of sexual transmission has increase to more than 90% in 2019.
Malaysia Global AIDS Reporting 202011
Figure 10: Distribution of HIV New Cases by State, 2019 More than 70% of the new
HIV cases reported in 2019
Kelantan,
Perlis, 0.5% Terengganu, 3.0% Pahang, 3.1%
were contributed by 6
1.8%
WP Labuan, states - Selangor, Kuala
Selangor, 0.4% Melaka, 3.2%
30.4% Lumpur, Johor, Sarawak,
Negeri
Sembilan, Penang, and Sabah (Figure
3.5% 10).
Perak, 4.6%
Kedah, 5.0%
WP KL,
12.6% Sabah, 6.3%
Pulau Pinang,
8.1%
Johor, 9.5% Sarawak,
8.1%
Figure 11: Distribution of New Infection by Age Group, Malaysia, 2019
More than 70% of new HIV infections were among people aged 20 to 39 years. While
infection in children below 13 years old has remained lower than 1% consistently
from the beginning of the epidemic (Figure 11).
Malaysia Global AIDS Reporting 202012
Prevention program
Key populations
FSW MSM PWID TG
Population size estimatea 22,000 220,000 75,000 37,000
HIV prevalenceb 6.3% 21.6% 13.5% 10.9%
Know their HIV statusb 35.1% 43.3% 38.9% 43.0%
ART coverageb 22.5% 62.6% 34.6% 34.0%
Condom use last sexb 83.5% 65.4% 25.7% 83.3%
aSize Estimation of Key Population Malaysia, 2018
bIBBS 2017
Figure 12: NSP and OST Coverage among PWID, 2016-
2019
Needle-syringes per PWID per year
30 90.0%
80.0% Access to Harm
25
70.0% Reduction Services
OST coverage
20 60.0%
50.0% remains uneven
15
40.0% especially NSEP
10 30.0%
20.0%
marked by highly
5
10.0% punitive approaches to
0 0.0% drug use.
2016 2017 2018 2019
NSP coverage (n) OST Coverage (%)
Given that sharing injection paraphernalia is the main mode of transmission in
Malaysia since the beginning of the epidemic, Harm Reduction Program that consist
of Needle and Syringe Exchange Program (NSEP) and Opioid Substitution Therapy
(OST) remained the mainstay of prevention programs to PWID in Malaysia. The OST
Program coverage offered at selected government and private health facilities since
2006, has shown an increased to more than 70% since 2017 (Figure 12). While the
NSEP program, implemented through smart partnership with NGO under MAC at
their outreach points throughout the country has reported a significant reduction in
program coverage of less than 50% since 2017. This is in line with the National
Malaysia Global AIDS Reporting 202013
Figure 13: HIV Prevalence and Safe Injecting Strategic Plan for Ending AIDS that
Practices among PWID, IBBS 2012-2017 encourage opioid injectors to shift to
20 120 OST to ensure better ART uptake.
Safe injecting practices, %
100
HIV Prevalence, %
15
80 In the nutshell, these programs
10 60 (harm reduction) have positive
40
impact as reflected in the declining
5
20
of HIV prevalence and increasing
0 0
continuous safe injecting practices
2012 2014 2017 above 80% in this key population
(Figure 13).
Safe Injecting practices HIV Prevalence
Figure 14 depicted results from
Figure 14: Coverage of Prevention Programmes
IBBS 2012 to 2017 on the
Among Key Populations, Malaysia, IBBS 2012-2017
coverage of prevention packages
80
among key populations. Access to
60
HIV prevention services for FSW
Percent
40 and MSM have been poor (less
20 than 50%) probably because they
are the most hard-to-reach and
0
PWID TG FSW MSM difficult to identify due to stigma
2012 2014 2017 and discrimination. While for PWID
and TG populations, the coverage
of prevention packages have been
Figure 15: Methadone Maintenance Therapy Clinic at
moderate (50%-70%)
Government Health Facility
Malaysia Global AIDS Reporting 202014
Eliminating Mother-to-Child Transmission
Figure 16: HIV and Syphilis Test Coverage, 2010-2019
100.5%
0.14%
100.0%
99.5% 0.12%
Test coverage, %
Seropositive (%)
99.0% 0.10%
98.5% 0.08%
98.0%
0.06%
97.5%
0.04%
97.0%
96.5% 0.02%
96.0% 0.00%
2010 2011 2012 2013 2014 2015 2016 2017 2018 2019
Syphilis test coverage HIV test coverage HIV seropositive (%) Syphilis seropositive (%)
HIV and syphilis test coverage for antenatal mothers to prevent vertical transmission
in Malaysia has persistently reached beyond 95% for more than a decade, with
seroconversion rate for both HIV and syphilis remained below 0.1% (Figure 16). This
wide screening coverage has been persistent throughout the country since the
Prevention of Mother-to-Child Transmission (PMTCT) program was implemented in
1998. The PMTCT Program in Malaysia is based strongly around early detection and
prompt treatment of HIV and syphilis for mother and baby, safer modes of delivery
and safer infant feeding practices.
Figure 17: Cascade of Services for Preventing
Vertical Transmission, Numbers of New HIV
Infections and eMTCT Rate, 2019
Malaysia became the 250
99.3% 95%
first country in WPRO 200
and first Muslim 150
Number
country globally to transmission
rate: 1.64
100
eliminate mother-to- Number of
cases: 1
50
child transmission of
HIV and Syphilis in 0
Estimated Women Infant of HIV New child
2018 pregnant receiving ARV mother tested
women living to prevent VT within 2
infection
through VT
with HIV months of
birth
Malaysia Global AIDS Reporting 202015
An estimated 99.3% of HIV-positive pregnant women were receiving ARV in 2019
resulted in 1.64% transmission rate of mother-to-child transmission (Figure 17). This
vertical transmission rate for HIV has reached the WHO elimination target (less than
2.00%) in both programmatic and estimated (Spectrum) data since 2016 (Figure 18).
Similarly, reported congenital syphilis have been less than 10 cases per 100,000 LB
persistently since 2010, which is far below the elimination indicator of less than 50
cases per 100,000 LB (Figure 19).
Figure 18: HIV Vertical Transmission Rate, Figure 19: MTCT of Syphilis, 2010-2019
2012-2019 9.0
12.0 8.0
HIV vertical transmission (%)
10.0 7.0
New CS per 100,000 LB
8.0 6.0
6.0 5.0
4.0
4.0
3.0
2.0
2.0
0.0
1.0
2012
2013
2014
2015
2016
2017
2018
2019
0.0
2010
2011
2012
2013
2014
2015
2016
2017
2018
2019
Programmatic Data (%)
Spectrum (%)
Adj. New paediatric CS infection
WHO Elimination target (per 100,000 LB)
Malaysia Global AIDS Reporting 202016
Confronting Stigma and Discrimination
Figure 20: Percentage of Person Aged 15 to 49
The level of stigma towards PLHIV in
Years with Discriminatory Attitudes Towards general population remained
PLHIV, 2014-2019 between 20% to 50% in the last three
60.0% years (Figure 20). Almost a third
50.0% (30%) Malaysian said they would
40.0% avoid buying vegetables from a
30.0%
PLHIV vendor, and 26% Malaysian
20.0%
believed that children living with HIV
10.0%
should not be allowed to attend
0.0%
2014 2017 2019 school with other children. Much still
People who would not buy vegetables from a PLHIV need to be done to eliminate stigma
shopkeeper
People who think children living with HIV should not be against PLHIV.
allowed to attend school other children
Stigma Reduction Initiatives
Starting mid-2020, a HIV-
• HCW • Identify gaps
• PLHIV • Design related stigma and
intervention
framework
discrimination reduction
through a quality improvement
Baseline Review of approach in government
results
healthcare facilities program
were initiated and this program
will be piloted at 6 states
Follow-up Intervention (Penang, Sarawak, Kuala
Lumpur, Selangor, and Johor).
• Repeat • Continuous
questionnaire intervention
• Review • For 4 months
performance
Malaysia Global AIDS Reporting 202017
HIV and Other Infection
HIV and Tuberculosis co-infection
Tuberculosis is the leading killer of
Figure 21: Proportion of Newly Enrolled PLHIV
with Active TB, 2015-2019 PLHIV. The risk of developing
25.0% tuberculosis (TB) is estimated to be
between 16-27 times greater in
20.0% people living with HIV than among
those without HIV infection. In
15.0%
Malaysia, proportion of newly
10.0% enrolled PLHIV with active TB was
7.3% in 2019 compared to 19.3% in
5.0% 2018 (Figure 21). However, in 2019,
only 15.8% of PLHIV newly enrolled
0.0%
2015 2016 2017 2018 2019 in HIV care was started on TB
Isoniazid preventive therapy (IPT)
(Figure 22). This data is far from
Figure 22: PLHIV Newly Enrolled in HIV Care WHO recommendation in which all
Started on IPT, 2015-2019 PLHIV who are unlikely to have
90.0% active TB (without any active
80.0% tuberculosis symptoms) should be
70.0% offered IPT.
60.0%
50.0%
40.0%
30.0%
20.0%
10.0%
0.0%
2015 2016 2017 2018 2019
Malaysia Global AIDS Reporting 202018
HIV and Hepatitis C co-infection
Hepatitis C virus (HCV) is a
Figure 23: HCV Epidemic in Malaysia, 2003-2019
bloodborne virus transmitted
3500 12
through direct contact with the
Reported HCV cases
3000 10
blood of an infected person. It is
Notification rate
2500
8
2000 estimated that HCV affects 2–15%
6
1500 of people living with HIV worldwide
4
1000 (and up to 90% of those are people
500 2
who inject drugs (PWID)). In
0 0
Malaysia, the national surveillance
2003
2004
2005
2006
2007
2008
2009
2010
2011
2012
2013
2014
2015
2016
2017
2018
2019
data showed that HCV is on the rise
HCV HCV Notification rate
with notification rate of 10.55 in
2019 (Figure 23). While reported
HIV/HCV co-infection was 518
Figure 24: Proportion of PLHIV Starting on ART cases or 15.1% of total HCV cases
Who Were Tested for Hepatitis C, 2013-2019 in 2019. Out of which, only 19.2%
120.0% of PLHIV co-infected with HCV
100.0% were on treatment for HCV (Figure
80.0% 24).
60.0%
40.0%
20.0%
0.0%
2015 2016 2017 2018 2019
National Strategic Plan for Hepatitis B
and Hepatitis C, 2019-2023 was
developed with an objective to
decrease the transmission of viral
hepatitis, limit the complications and
to reduce the socioeconomic impact
of viral hepatitis
Malaysia Global AIDS Reporting 202019
Sexually Transmitted Infection
Similar to HIV, STIs are spread
Figure 25: Number of Men Reporting Urethral
Discharge in the Past 12 Months, 2013-2019 predominantly by sexual contact,
3500
including vaginal, anal and oral sex
as well as through non-sexual
3000
means such as via blood or blood
2500 products. Some STIs can spread
Number of cases
2000 vertically from mother to child during
1500 pregnancy and childbirth. Majority of
1000
STIs are asymptomatic hence, the
surveillance for urethral discharge is
500
used to provide early warning of the
0
2013 2014 2015 2016 2017 2018 2019
epidemic potential of HIV from
sexual transmission and ongoing
high-risk sexual activity.
Figure 26: Safe Sex Practices at Last Sex,
Figure 25 shows an alarming
IBBS 2012-2017
increase of reported urethral
90
discharge in men with 2296 cases in
80
70
2019. This trend is consistent with
60
the data in Figure 26 where safe sex
practices at last sex among MSM
Percent
50
40
are less than 80% for all 3 cycles of
30 IBBS surveys. When used correctly
20 and consistently, condom is one of
10 the most effective methods of
0 protection against STIs and HIV.
FSW TG MSM PWID
2012 2014 2017
Malaysia Global AIDS Reporting 202020
Investing to End an Epidemic
Since the beginning of the epidemic,
Figure 27: HIV Resources Availability, by Source, more than 90% of the investment for
2017-2019
HIV responses is from domestic
250
purse (Figure 27). The Global Fund
200 to Fight against AIDS, Tuberculosis
and Malaria (the Global Fund)
RM (Millions)
150
added some 2%-4% of total national
100
responses for HIV since 2011.
50
Compared to the year 2012 to 2016,
0
2010 2011 2012 2013 2014 2015 2016 2017 2018 2019 the total amount of expenditure for
Domestic (public) Domestic (private) HIV responses decreased by more
Global fund International (other) than 30% in 2017. This is due to the
reduction in the price of ARV
medication by more than half in
Figure 28: AIDS Spending by Category, 2016-2019 2017.
Since the beginning of the
100%
implementation of National Strategic
80%
Plan For Ending AIDS (NSPEA
60%
40%
2016-2030) in 2016, more than 70%
20%
of the total funding were spent on
0% ‘test and treat’ strategy as knowing
2016 2017 2018 2019 one’s status is the first step in
Others
preventing infection (through
Elimination of MTCT
Mitigating sexual transmission
behavior modification) and
Prevention of HIV transmission through injecting drug use treatment reduce onward
Test and treat transmission through sexual to
uninfected partner by 96%. We
aimed to first reduced the gap on the first and second 90 of HIV treatment cascade
(Figure 28).
Malaysia Global AIDS Reporting 202021
2019 galleries
Multi-stakeholder Forum on National HCV
Response 2019 – “Closing the gaps in HCV
Response: Strategy on the Hard-to-Reach
Populations”
Training of Trainers (ToT): Stop the Stigma
and Discrimination Towards PLHIV, PLHCV
& Key Populations (HOPE) Module for
Healthcare Worker, Cameron Highlands,
Pahang
Malaysia Global AIDS Reporting 202022
Stigma & Discrimination
Among HCW Towards PLHIV
Reduction Through Quality
Improvement Initiatives
Meeting with Stakeholders
Site visit at Persatuan Cahaya
Harapan Kedah/Perlis at Langkawi
Island
Community-based testing
(CBT) by accredited
personnel/NGO
Malaysia Global AIDS Reporting 202023
Joint-visit MOH-MAC to
Methadone Maintenance Therapy
Clinic at Terengganu
Joint visit MOH-MAC to
NGO Baitul Cakna,
Terengganu
AEM & Spectrum Workshop:
Update on 2019 data for National
and Subnational Analysis at
Langkawi Island with MOH, MAC,
Dr Wiwat Peerapatanapokin,
Consultant from East-Centre
Hawaii and Dr Khin Cho Win Thin,
Data Specialist from UNAIDS
Malaysia Global AIDS Reporting 202024
Updates Medical Seminar for
Plantation Paramedics, Port
Dickson, Negeri Sembilan
Development of Stop the Stigma
and Discrimination Towards PLHIV,
PLHCV & Key Populations (HOPE)
Module for Healthcare Worker at
Kuala Lumpur
Strengthening of
PROSTAR Program
Workshop, Fraser Hill,
Pahang
Malaysia Global AIDS Reporting 202025
WORLD AIDS DAY 2019 ACTIVITIES
World AIDS Day in
Perak –
World AIDS Day in Perak
World AIDS Day in Perak
Malaysia Global AIDS Reporting 202026
World AIDS Day in Pahang
World AIDS Day in Johor
World AIDS Day in Melaka
Malaysia Global AIDS Reporting 202027
HIV/STI/Hepatitis C Section
Disease Control Division
Ministry of Health Malaysia
Tel: +60 3 8883 4387
Fax: +60 3 8883 4285
www.moh.gov.my
Printed, reproduced, and/or distributed by Disease Control Division, Ministry of Health Malaysia.
Malaysia Global AIDS Reporting 2020You can also read