Application Guide Good Westerns Gone Bad Tips to Make Your Near-Infrared Western Great - LI-COR Biosciences
←
→
Page content transcription
If your browser does not render page correctly, please read the page content below
Application Guide
Good Westerns Gone Bad
Tips to Make Your Near-Infrared Western Great

                                Published December 2008. Revised March 2020. The
                                most recent version of this document is posted at
                                licor.com/bio/support.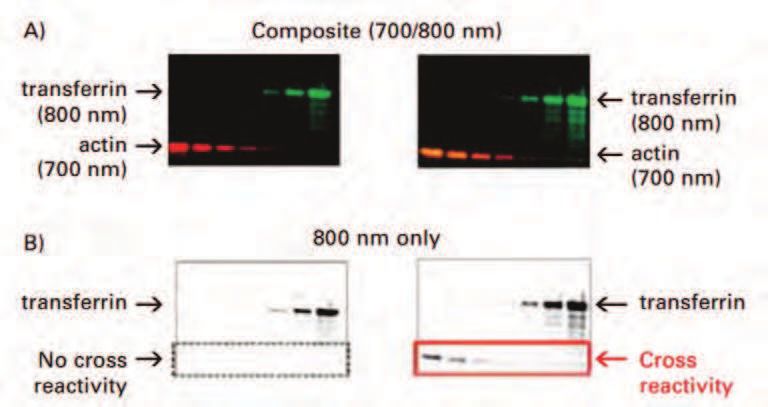
Page 2 - Good Westerns Gone Bad

                                          Table of Contents
                                                                              Page

    I. Introduction to Western Blotting                                        3
    II. Key Factors That Affect Western Blot Results                           3
        Membrane                                                               3
           Test Membrane Background                                            3
           Membrane Comparison                                                 4
        Blocking Reagent                                                       5
           Milk-Based Blocking Buffer                                          5
           TBS vs PBS Blocking Buffers                                         5
        Detergents                                                             6
           Tween® 20                                                           6
           SDS                                                                 6
        Primary Antibody                                                       7
           Primary Antibody Variation Example                                  7
        Secondary Antibody                                                     8
           Highly Cross-Adsorbed Secondary Antibodies                          8
           Example of Highly Cross-Adsorbed Secondary Antibodies               9
           MPX Multiplexer Blotting System for Testing Secondary Antibodies   10
           Secondary Antibody Dilution                                        11
        Contamination                                                         12
           Blue Pen Used on Membrane                                          12
           Acrylamide Residue on Membrane After Transfer                      12
           Bacterial Growth in Antibodies                                     13
           Blue Loading Buffer Used During Gel Electrophoresis                 13
           Dirty Processing Containers                                        13
           Dirty Forceps                                                      14
           Dirty Transfer Pads                                                14
           Fingerprints                                                       14
    III. Imaging Factors That Can Affect Western Blot Results                 15
        Start with A Clean Imaging Bed or Imaging Tray                        15
        Remove Air Bubbles                                                    15
        Image Blot Wet or Dry                                                 16
        Imaging Parameters                                                    16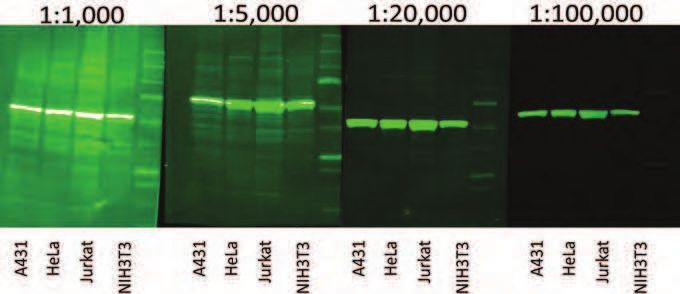
Good Westerns Gone Bad - Page 3

           Focus Offset                                                                  16
           Scan Intensity                                                                17
           Auto Mode on the Odyssey® Imager                                              18
   IV. References                                                                        19

I. Introduction to Western Blotting
  Western blotting is used to positively identify a protein from a complex mixture. It was first
  introduced by Towbin, et al. in 1979, as a simple method of electrophoretic blotting of
  proteins to nitrocellulose sheets (1 ). Since then, Western blotting methods for immobilizing
  proteins onto a membrane have become a common laboratory technique. Although many
  alterations to the original protocol have also been made, the general premise still exists.
  Macromolecules are separated using gel electrophoresis and transferred to a membrane,
  typically nitrocellulose or polyvinylidene fluoride (PVDF). The membrane is blocked to
  prevent non-specific binding of antibodies and probed with some form of detection antibody
  or conjugate.

  Near-infrared fluorescence detection on the Odyssey Classic, Odyssey CLx, Odyssey Fc, or
  Odyssey Sa Imaging Systems provides a quantitative two-color detection method for Western
  Blots.

  This document will discuss some factors that may alter the performance of a near- infrared
  (NIR) Western blot, resulting in “good Westerns, gone bad.”

II. Key Factors That Affect Western Blot Results
Membrane
  A low-background membrane is essential for NIR Western blot success. Background can
  result from membrane autofluorescence or non-specific binding of antibodies. Polyvinylidene
  fluoride (PVDF) and nitrocellulose membranes are typically used for Western blotting
  applications. There are many brands and vendors for both types of membranes.

Test Membrane Background

  Before using a membrane for the Western blot protocol, cut a small sample of membrane to
  test the background of the membrane by itself.

   l   Image this sample (both wet and dry) to evaluate the level of membrane autofluorescence.

   l   If possible, include a sample of membrane that is known to work well with the Odyssey
       Imaging System, so you can compare background levels.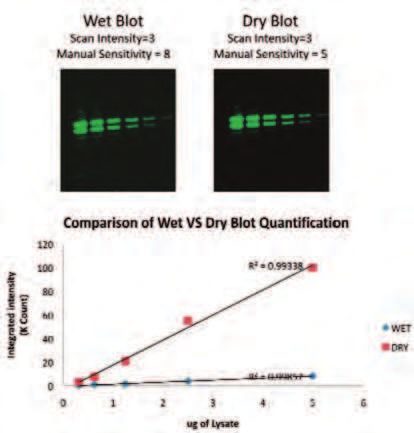
Page 4 - Good Westerns Gone Bad
Membrane Comparison
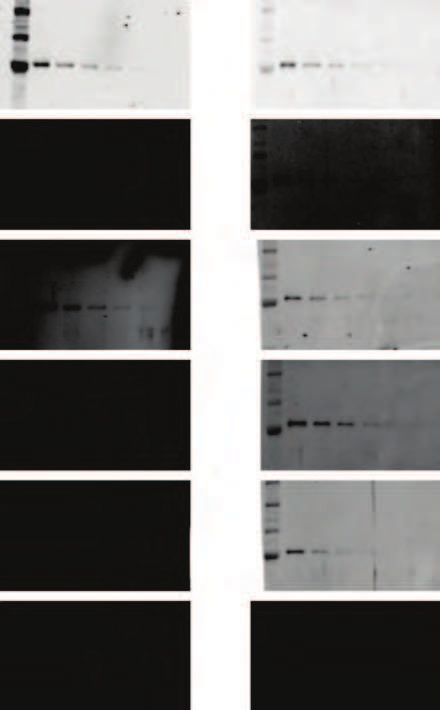
LI-COR has evaluated many different transfer membranes for Western blotting. Examples of
membrane performance are shown in Figure 1.
l PVDF membranes typically display higher membrane autofluorescence than
nitrocellulose, and more variability in background levels.
However, PVDF has many advantages (including higher binding capacity, higher target
retention, and better tensile strength) that make it an appropriate choice for many
experiments.
l Nitrocellulose membranes generally offer the lowest membrane autofluorescence.
Note: LI-COR has not evaluated all sources of PVDF and nitrocellulose membranes, and
lot-to-lot variation can occur. It is important for you to evaluate membranes before you
use them.
PVDF Membrane Comparison
Millipore Immobilon®-FL
Millipore Immobilon-P
BioRad Immun-Blot®
Pall BioTrace® PVDF
Perkin Elmer PolyScreen®
Amersham Hybond®-P
Figure 1. Membrane autofluorescence from PVDF affects Western blot performance. Transferrin was detected by
Western blotting, using various vendors and brands of PVDF membrane. Blots were imaged with the Odyssey
Classic Infrared Imaging System in both 700 and 800 nm channels.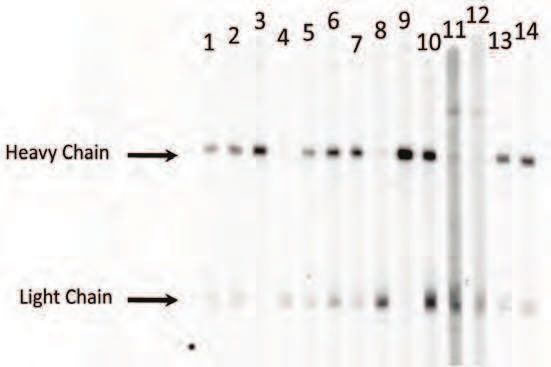
Good Westerns Gone Bad - Page 5

Blocking Reagent
  No single blocking reagent will be suitable for all antigen-antibody pairs.

  Many different sources and types of blocking reagents are used for Western blot
  applications. Antibody performance can sometimes be compromised by the blocking reagent
  chosen. Blocking buffer choice may affect antibody specificity and non-specific binding, and
  can dramatically increase the number of background bands (Figure 1). Excessive blocking (for
  example, with high concentrations of nonfat dry milk) may cause loss of blotted proteins or
  mask the desired antibody-antigen interactions (3 ).

  If an antibody fails with one blocking condition, trying another blocker may solve the
  problem.

Milk-Based Blocking Buffer

  Detection reagents may cross-react with certain blocking buffers.

  Milk-based blockers may contain IgG that can cross-react with anti-goat antibodies. This can
  significantly increase background and reduce sensitivity.

  Milk-based blockers may also contain endogenous biotin or phospho-epitopes that can
  cause higher background. It is best not to use milk-based blocking buffers when detecting
  phospho-targets or other post-translational modifications.

TBS vs PBS Blocking Buffers

  Many blocking reagents are available in Phosphate Buffer or Tris Buffer (PBS/TBS) systems. In
  general, TBS blocking reagents are used for detection of phospho-proteins, because the
  phosphate present in PBS blocking reagents may competitively bind with antibodies to
  phospho-proteins. Some phospho-proteins can be detected with PBS-based blocking
  reagents, depending on the antibody specificity and affinity; however, it is important to
  optimize the blocking reagent for the specific antibody that is being used for optimal Western
  blot performance.

  Be sure to keep your buffer system consistent throughout the protocol for blocking, antibody
  dilutions, and washes. For example, if you use a TBS-based buffer system, choose Intercept®
  (TBS) Blocking Buffer. If you use a PBS-based buffer system, choose Intercept® (PBS)
  Blocking Buffer.
Page 6 - Good Westerns Gone Bad

Detergents
  Adding detergents to diluted antibodies can significantly reduce background on the blot.

      l   The optimal detergent concentration will vary, depending on the antibodies,
          membrane type, and blocker used. Keep in mind that some primary antibodies do not bind
          as tightly as others and may be washed away by too much detergent.

      l   It is generally best not to expose the membrane to detergent until blocking is complete, as
          this may cause high membrane background.

Tween® 20

   l      Blocking buffer – It is best not to add Tween 20 during blocking.

   l      Diluted primary and secondary antibodies should contain Tween 20.

          Use a final concentration of 0.1 - 0.2% Tween 20 for PVDF and nitrocellulose membranes.

   l      Wash solutions should contain 0.1% Tween 20.

SDS

  When using a PVDF membrane, adding SDS will dramatically reduce overall membrane
  background in the 700 nm channel. Use only a very small amount, because SDS is an ionic
  detergent and can disrupt antibody-antigen interactions if too much is present at any time
  during the protocol.

          Important: SDS should not be used with nitrocellulose membranes.

      l   Do not add SDS to the blocking reagent during blocking.

      l   Diluted primary antibodies should not contain SDS.

      l   Wash solutions should not contain SDS.

      l   When using a PVDF membrane, your secondary antibody diluent should contain a final
          concentration of 0.01 – 0.02% SDS and 0.1 – 0.2% Tween® 20.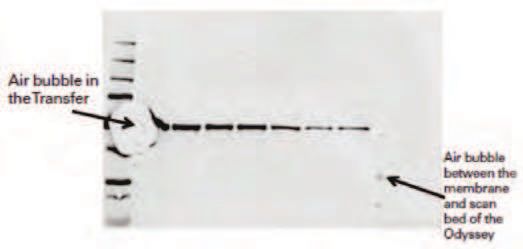
Good Westerns Gone Bad - Page 7

Primary Antibody
     An antibody produced to detect a specific antigen is called the primary antibody, and it binds
     directly to the molecule of interest. Primary antibodies can be produced in a wide variety of
     species, such as mouse, rabbit, goat, chicken, rat, guinea pig, human, and many others.
     Primary antibodies from different vendors and sources for the same antigen may perform very
     differently. It may be necessary to test more than one primary antibody for optimal detection
     of the target protein in your Western blot system.

Primary Antibody Variation Example

     Figure 2 is an example of how different primary antibodies may react.

A)                                          B)
            1 2 3 4 5 6 7 8                      Antibody       Host      Manufacturer     Part Number

                                             1   α-GAPDH        Mouse     Ambion           4300

                                             2   GAPDH          Sheep     AbCam            ab35348

                                             3   GAPDH          Rabbit    Rockland         600-401-A33

                                             4   GAPDH          Mouse     AbCam            ab8245

                                             5   GAPDH          Chicken   ProSci Inc.      XW-7214

                                             6   GAPDH (N-14)   Goat      Santa Cruz Bio   sc-20356

                                             7   GAPDH (V-18)   Goat      Santa Cruz Bio   sc-20357

                                             8   α-GAPDH        Mouse     Sigma            G8795

                                            Figure 2. Anti-GAPDH primary antibodies from various sources
                                            behave very differently. A) Screening of eight different GAPDH
                                            primary anibodies against a HeLa cell lysate sample, using the
                                            MPX™ Multiplexer Blotting System. B) Antibody sources.
                                            Primary antibodies were diluted according to manufacturer’s
                                            recommendations.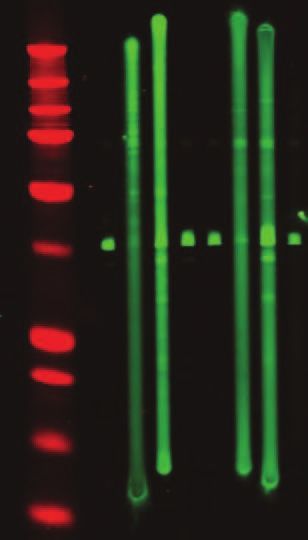
Page 8 - Good Westerns Gone Bad

Secondary Antibody
  Fluorescent Western blot methods and the Odyssey® Imager can detect two protein targets
  simultaneously. Two-color detection requires careful selection of primary and secondary
  antibodies.

   l   The two primary antibodies must be derived from different host species so they can be
       discriminated by secondary antibodies of different specificities (for example, primaries
       from rabbit and mouse will be discriminated by anti-rabbit IgG and anti-mouse IgG
       secondary antibodies).

   l   One secondary antibody must be labeled with IRDye® 680LT or IRDye 680RD, and the
       other with IRDye 800CW.

       IRDye Subclass-Specific Antibodies offer a special exception to this rule. IRDye Goat anti-
       Mouse IgG1, Goat anti-Mouse IgG2a, and Goat anti-Mouse IgG2b subclass-specific
       antibodies enable two- color detection of monoclonal primary antibodies derived from the
       same species (mouse). IRDye Subclass-Specific antibodies react only with the heavy
       (gamma) chain of the primary antibody.

  For details and a complete description, refer to Western Blot and In-Cell Western™ Assay
  Detection Using IRDye Subclass-Specific Antibodies (licor.com/subclass).

Highly Cross-Adsorbed Secondary Antibodies

  Not using cross-adsorbed antibodies may result in increased cross-reactivity (spurious bands
  that appear in the other detection channel, see Figure 3). LI-COR IRDye conjugated secondary
  antibodies are highly cross-adsorbed and optimized for two-color Western blot detection.
Good Westerns Gone Bad - Page 9
Example of Highly Cross-Adsorbed Secondary Antibodies
Composite (700/800)
transferrin
(800 nm)
transferrin
(800 nm)
actin actin
(700 nm) (700 nm)
800 nm Channel Only
transferrin transferrin
no cross cross
reactivity reactivity
Figure 3. Highly cross-adsorbed secondary antibodies eliminate cross-reactive bands on multiplex Western blots.
A) Actin was detected with mouse anti-actin primary and goat anti-mouse secondary antibody (700 nm; red).
Transferrin was detected with rabbit anti-transferrin and goat anti-rabbit IRDye 800CW secondary antibody
(LI-COR; 800 nm, green). Odyssey® Classic Imager was used, with detection sensitivity setting = 1.5 for both chan-
nels. Goat anti-Rabbit secondary antibody was highly cross-adsorbed (left; LI-COR product) or not cross-
adsorbed (right; obtained from alternate supplier). B) In the 800 nm image, the LI-COR cross-adsorbed secondary
antibody (left) shows no cross-reactivity with the mouse anti-actin primary. The non-cross-adsorbed antibody
(right) cross-reacts with mouse anti-actin, generating spurious bands, which appear yellow in the composite
image (A).Page 10 - Good Westerns Gone Bad
MPX Multiplexer Blotting System for Testing Secondary Antibodies
Many types of secondary antibodies may be used for Western blot detection.
The MPX™ Multiplexer Blotting System can be used to choose the appropriate secondary
antibody and optimal dilution. Figure 4 demonstrates the performance of LI-COR IRDye
800CW Goat anti-Mouse IgG compared to various other secondary antibody options for
detection of a mouse IgG primary antibody.
1. Goat anti-Mouse IgA, IgG, IgM
2. Rabbit anti-Mouse IgG
3. Goat anti-Mouse IgG Fcy (heavy chain specific)
Heavy Chain
4. Goat anti-Mouse IgG F(ab)2
5. Goat anti-Mouse IgG, IgM
6. F(ab)2 Goat anti-Mouse IgG
Light Chain
7. F(ab)2 Goat anti-Mouse IgG, IgM
8. F(ab)2 Goat anti-Mouse IgG Fab
9. F(ab)2 Goat anti-Mouse IgG Fcy (heavy chain
specific)
10. Donkey anti-Mouse (LI-COR)
11. Goat anti-Mouse IgM 1:5,000
12. Goat anti-Mouse IgM 1:7,500
13. Goat anti-Mouse IgG (LI-COR) 1:2,500
14. Goat anti-Mouse IgG (LI-COR) 1:5,000
Figure 4. Evaluation of secondary antibodies with the MPX Multiplexer Blotting System. Mouse IgG primary anti-
body was electrophoresed and blotted to nitrocellulose membrane. Various secondary antibodies were labeled
with IRDye 800CW, and compared to IRDye 800CW Donkey anti-Mouse IgG (lane 10) and IRDye 800CW Goat
anti-Mouse IgG (lanes 13 and 14). Secondary antibodies were used at a 1:5,000 dilution unless otherwise indic-
ated. Data were generated using the MPX Multiplexer Blotting System and an Odyssey Classic Imager.Good Westerns Gone Bad - Page 11
Secondary Antibody Dilution
The amount of secondary antibody used for NIR Western blot detection can vary widely.
l When using LI-COR IRDye® 800CW and IRDye 680RD conjugated secondary antibodies,
the recommended dilution range is 1:5,000 to 1:25,000. The recommended starting
dilution is 1:20,000.
l When using LI-COR IRDye 680LT secondary antibodies, the recommended dilution range is
1:10,000 – 1:40,000.
The dilution should be optimized for the primary antibody being used and the preferred
appearance of the Western blot. Image Studio™ Software can be used to optimize the
appearance of the image, for a variety of secondary antibody dilutions (Figure 5). Higher
dilutions (1:20,000 – 1:100,000) provide lower membrane background and fewer
background bands than 1:1,000 or 1:5,000 dilutions (Figure 5).
Note: If too much secondary antibody is used, bands may be very strong and may
show saturation of signal (white pixels in Figure 5). Image display settings can be
adjusted to optimize the brightness and contrast, and make background bands less
visible. However, image display adjustments affect visual presentation only and do not
alter the raw data in any way.
1:1,000 1:5,000 1:20,000 1:100,000
A431
HeLa
Jurkat
NIH3T3
A431
HeLa
Jurkat
NIH3T3
A431
HeLa
Jurkat
NIH3T3
A431
HeLa
Jurkat
NIH3T3
Figure 5. Effect of secondary antibody dilution on image data. IRDye 800CW secondary antibody was used at the
dilutions shown, to detect the target protein in various cell lysates. Blots were imaged with the Odyssey Classic
system with the default scan settings (intensity = 5). The 1:1,000 antibody dilution shows saturation of strong
bands (left; white pixels in the bands). Higher dilutions do not show saturation. Increased background banding is
observed with 1:1,000 and 1:5,000 dilutions. All images were displayed with “Auto” image display settings.Page 12 - Good Westerns Gone Bad
Contamination
Many factors can cause contamination and increase the background levels of a near-infrared
Western blot. Contamination can appear as a global increase in background, large smears of
signal, or speckled blots. Common sources of contamination are listed.
Blue Pen Used on Membrane
Appearance Example Image Solution
Smeared signal can be seen in the 700 nm Use a pencil to write on the mem-
channel. brane.
Acrylamide Residue on Membrane After Transfer
Example
Appearance Solution
Image
Speckles and blotches can be seen in Carefully rinse off membrane in 1X PBS before it dries.
700/800 nm channels.
Conditions may need to be optimized to prevent the gel
from overheating during transfer.Good Westerns Gone Bad - Page 13
Bacterial Growth in Antibodies
Appearance Example Image Solution
Speckles and blotches can be seen in 700/800 nm channels. Replace antibodies.
Blue Loading Buffer Used During Gel Electrophoresis
Appearance Solution
Smeared signal in the 700 nm channel Use LI-COR 4X Protein Sample Loading Buffer (P/N 928-40004).
Dirty Processing Containers
Contamination Source Appearance Solution
Coomassie Stain/gel In the 700 nm channel, entire membrane dark, Use different containers for gel staining
stain/ anything blue smeared signal, or speckles, depending on the and Western blot detection.
amount of stain residue in container.
Bacterial growth Speckles and blotches can be seen in the 700/800 Wash containers with detergent, rinse
nm channels thoroughly with distilled water, and a
final rinse with methanol
Acrylamide residue Speckles and blotches can be seen in the 700/800 Wash containers with detergent, rinse
nm channels thoroughly with distilled water, and a
final rinse with methanolPage 14 - Good Westerns Gone Bad
Dirty Forceps
Appearance Solution
Blotches can be seen in 700/800 nm channels Do not use rusty forceps. Forceps can be washed with detergent,
where forceps have touched the membrane. rinsed with water, and a final rinse with methanol.
Dirty Transfer Pads
Appearance Example Image Solution
Blotches can be seen on the Cleaning the transfer pads in
blots that align with the pure methanol may help,
transfer cassette holes but the transfer pads may
need to be replaced.
Fingerprints
Appearance Example Image Solution
Blotches can be seen in 700/800 nm Only handle membranes by the edges with
channels where gloved/ungloved hands clean forceps. Be careful not to touch the
have touched the membrane. membrane with your hands or gloves.Good Westerns Gone Bad - Page 15
III. Imaging Factors That Can Affect Western Blot Results
Start with A Clean Imaging Bed or Imaging Tray
Always start with a clean scan bed or imaging tray.
If you capture an image and any empty area (not covered by membrane) shows signal in
either channel, the scan bed or imaging tray is contaminated. The contamination source may
be as simple as dust, or as complex as residual dye.
Carefully follow the cleaning instructions in the Operator's Manual for your imager to clean
the scan bed or imaging tray.
Remove Air Bubbles
Air bubbles can cause reduced signal detection during imaging. Flatten the membrane with a
roller (such as LI-COR P/N 926-71000) to remove bubbles and excess liquid between the blot
and the scan surface. See Figure 6.
Air bubble in
transfer
Air bubble
between the
membrane
and scan
bed of the
Odyssey Imager
Figure 6. Air bubbles affect image appearance. Examples of bubbles in the transfer sandwich or on the Odyssey
Imager scan bed.Page 16 - Good Westerns Gone Bad
Image Blot Wet or Dry
A Western blot can be imaged either wet or dry on any Odyssey Imaging System. Typically,
the signal is higher when a dry blot is imaged; however, background levels will increase. See
Figure 7.
Wet Blot Dry Blot
Scan Intensity: 3 Scan Intensity: 3
Manual Sensitivity: 8 Manual Sensitivity: 5
Comparison of Wet vs Dry Blot Quantification
120
Integrated Intensity
100 R2 = 0.99338
80
(K Count)
60
Wet
40
Dry
20
0
0 1 2 3 4 5 6
μg of Lysate
Figure 7. Scanning of wet and dry Western blots. The same Western blot was scanned wet and dry with an Odys-
sey Classic Imager. Optimal image display settings are shown. Quantification (graph below images) demonstrates
higher signal intensity on the dry blot.
Imaging Parameters
The following information about imaging parameters applies to the Odyssey Classic, Odyssey
CLx, and Odyssey Sa.
Focus Offset
Improper adjustment of the Focus Offset can result in reduced signal collection from the
membrane. The Focus Offset should be set at 0 mm for scanning a Western blot.
For more information, see the manual for your imager.Good Westerns Gone Bad - Page 17
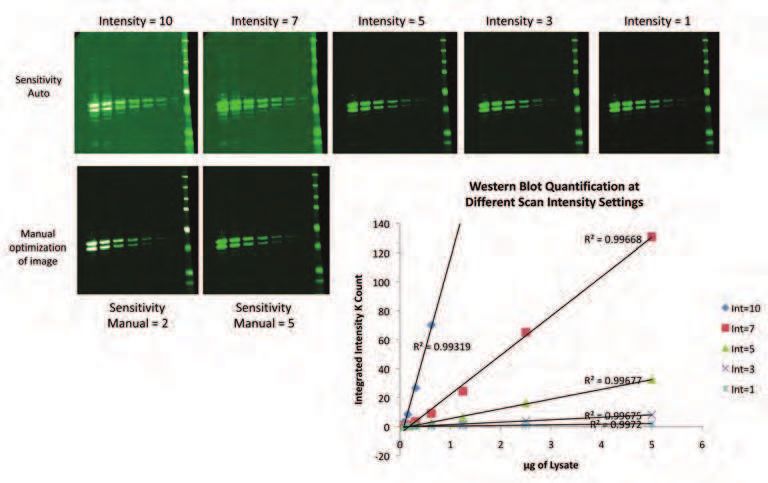
Scan Intensity
Improper optimization of the Scan Intensity can result in saturation of signal and reduced
linear dynamic range. Figure 8 demonstrates how changes in the Scan Intensity setting affect
the resulting signals on the Odyssey Classic Imager.
A) Sensitivity Auto
Intensity = 10 Intensity = 7 Intensity = 5 Intensity = 3 Intensity = 1
B) Manual Image Optimization C) Western Blot Quantification at
Sensitivity Sensitivity Different Scan Intensity Settings
Manual = 2 Manual = 5
140
R2 = 0.99668
R2 = 0.99319
Integrated Intensity (K Count)
120
100
80 Int = 10
Int = 7
Int = 5
60
Int = 3
Int = 1
40
R2 = 0.99677
20
R2 = 0.99675
R2 = 0.9972
0
0 1 2 3 4 5 6
-20
μg of Lysate
Figure 8. Effect of Scan Intensity settings on Western blot signals. The same Western blot was scanned at 5 differ-
ent intensity settings with the Odyssey Classic Imager. A) Images shown with Auto Sensitivity settings for image
display. Scan intensity setting is indicated above each imager. B) The same images (Intensity=10 and Intensity=7)
are shown with optimized image display settings. C) Quantification of signals from the blots in A. Note that sat-
urated signals at Intensity=10 (white pixels) cannot be quantified.Page 18 - Good Westerns Gone Bad
Auto Mode on the Odyssey® Imager
The Odyssey CLx Imager has two modes for dynamic range: Auto and Manual. A comparison
between Auto Mode and Manual Mode is shown in Figure 9.
l In Auto mode the Odyssey CLx Imager acquires images with virtually no saturated pixels
on the first attempt with no user adjustments. More than six logs (22 bits) of dynamic range
are available for each image.
l In Manual mode the intensity of each channel can be manually adjusted across a 12 bit
dynamic range.
Auto Intensity
1 2 3 4
A431
NIH3T3
HeLa
Jurkat
A431
NIH3T3
HeLa
Jurkat
A431
NIH3T3
HeLa
Jurkat
A431
NIH3T3
HeLa
Jurkat
A431
NIH3T3
HeLa
Jurkat
Figure 9. Auto Mode prevents signal saturation. A two-color Western blot was imaged with the Odyssey® CLx sys-
tem, using Auto Mode. No saturated signals were observed. The same blot was imaged repeatedly with manual
Scan Intensity settings, beginning with Intensity=4. Pixel saturation is shown in white. Four separate scans were
required to generate the desired image. In these lysates, tubulin (green bands) was detected with rabbit anti-
Tubulin and IRDye® 800CW Goat anti-Rabbit IgG (LI-COR P/N 926-32211); actin (red bands) was detected with
mouse anti-actin and IRDye 680LT Goat anti-Mouse IgG (LI-COR P/N 926-68051).
It is important to note that saturated pixels (which appear white in these pseudo-color
images) cannot be accurately quantified. Signal saturation can also result in “crosstalk”
(detection of signal in the alternate fluorescence channel). This is easily eliminated by
scanning at a lower intensity setting.Good Westerns Gone Bad - Page 19 IV. References 1. Towbin, et al., (1979) Proc. Natl. Acad. Sci. USA 76; 4350-54. 2. Ambroz, et al., (2008) Proteomics 8; 2379-83. 3. DenHollander and Befus, (1989) J. Immunol. Methods 122(1); 129-35.
© 2020 LI-COR, Inc. LI-COR, In-Cell Western,    LI-COR Biosciences        Regional Offices
MPX, Odyssey, Intercept, IRDye, and Image
Studio are trademarks or registered             4647 Superior Street      LI-COR Biosciences GmbH         LI-COR Biosciences UK Ltd.
trademarks of LI-COR, Inc. in the United        Lincoln, NE 68504
States and other countries. All other           Phone: +1-402-467-0700    Siemensstraße 25A               St. John’s Innovation Centre
trademarks belong to their respective owners.   Toll free: 800-645-4267   61352 Bad Homburg               Cowley Road • Cambridge
                                                biosales@licor.com        Germany                         CB4 0WS • United Kingdom
                                                licor.com/bio             Phone: +49 (0) 6172 17 17 771   Phone: +44 (0) 1223 422104
                                                                          bio-eu@licor.com                bio-eu@licor.com

Doc # 988-19025
03/20
You can also read