SG-II-Up prototype final optics assembly: optical damage and clean-gas control
←
→
Page content transcription
If your browser does not render page correctly, please read the page content below
High Power Laser Science and Engineering, (2015), Vol. 3, e7, 6 pages.
             © The Author(s) 2015. The online version of this article is published within an Open Access environment subject to the conditions of the
             Creative Commons Attribution licence .
             doi:10.1017/hpl.2015.1

             SG-II-Up prototype final optics assembly:
             optical damage and clean-gas control

             Dongfeng Zhao1,2 , Li Wan1 , Zunqi Lin1 , Pin Shao1 , and Jianqiang Zhu1
             1 Shanghai Institute of Optics and Fine Mechanics, Chinese Academy of Sciences, No. 390, Qinghe Road,
             Jiading District, Shanghai 201800, China
             2 University of Chinese Academy of Sciences, No. 19A Yuquan Road, Beijing 100049, China

             (Received 8 July 2014; revised 2 December 2014; accepted 29 December 2014)

             Abstract
             The Shenguang-II Upgrade (SG-II Up) facility is an under-construction high-power laser driver with eight beams, 24 kJ
             energy, 3 ns pulse duration and ultraviolet laser output, in the Shanghai Institute of Optics and Fine Mechanics, China.
             The prototype design and experimental research of the prototype final optics assembly (FOA), which is one of the most
             important parts of the SG-II Up facility, have been completed on the ninth beam of the SG-II facility. Thirty-three shots
             were fired using 1-ω energy from 1000 to 4500 J and 3-ω energy from 500 to 2403 J with a 3 ns square pulse. During the
             experiments, emphasis was given to the process of optical damage and to the effects of clean-gas control. A numerical
             model of the FOA generated by the Integrated Computer Engineering and Manufacturing code for Computational Fluid
             Dynamics (ICEMCFD) demonstrated that a flux within 1–5 l s−1 and a 180 s period is effectual to avoid contaminant
             sputtering to the optics. The presence of surface ‘mooning’ damage and surface spots located outside the clear aperture
             are induced by contaminants such as wire, silica gel and millimeter order fiber and metal.
             Keywords: Final Optics Assembly; optical damage; SG-II-Up

             1. Introduction                                                                            1. Phase plate – conditions the beam phases to form an
                                                                                                           ∼750 μm flat-top profile.
             The Shenguang-II Upgrade (SG-II Up) is a kilojoule-class
                                                                                                        2. Vacuum window – provides a near-vacuum FOA envi-
             solid-state laser and targeting facility under construction by                                ronment.
             the National Laboratory on High Power Lasers and Physics.
             The amplified 1053 nm beams from the Nd:glass driver are                                    3. Frequency conversion crystals – convert the 1053 nm
             transported (at 40 kJ for 3 ns) in 2 × 2 quads with eight                                     beam to a 351 nm beam.
             beams with aperture size 310 mm × 310 mm to the 2.4 m-                                     4. Wedged plate – separates the residual 1053 and
             diameter target chamber where eight final optics assemblies                                    527 nm light with 351 nm light, and the refractive low-
             (FOAs) convert each beam to the third harmonic, separate                                      energy 351 nm light to a power sensor on the output
             the residual 1053 and 527 nm beams, and finally focus the                                      surface.
             351 nm beam onto the target.                                                               5. Focus lens – focuses the 351 nm beam onto the target;
                The prototype design and manufacture of the FOA have                                       the focal length is 2234 mm.
             been finished, and it is different from the NIF’FOA and the
             SG-II’FOA[1–6] . The FOA consists of fixed interfaces to                                    6. Beam sampling grating (BSG) and main debris shield
             the target chamber and five modules that house eight full-                                     (MDS) – providing a low-efficiency grating to the
                                                                                                           input surface for energy sampling (calorimetry) and
             aperture optics, as shown in Figure 1. The aperture sizes
                                                                                                           large-object protection for upstream (more expensive)
             of these optics are as large as 370 mm × 370 mm. The
                                                                                                           optics.
             corresponding functions of the various optics, as shown in
             the aforementioned figure, are as follows.                                                  7. Disposable debris shield (DDS) – thin, inexpensive
                                                                                                           optics for primary debris protection.
                Correspondence to: D. Zhao, Shanghai Institute of Optics and Fine
             Mechanics, Chinese Academy of Sciences, No. 390, Qinghe Road, Jiading                    The frequency converter is a cascade sum-frequency gen-
             District, Shanghai 201800, China. Email: dfzhao@siom.ac.cn                             eration design consisting of a 12.5 mm-thick Type-I KDP
                                                                                                1

Downloaded from https://www.cambridge.org/core. 13 Nov 2020 at 05:11:32, subject to the Cambridge Core terms of use.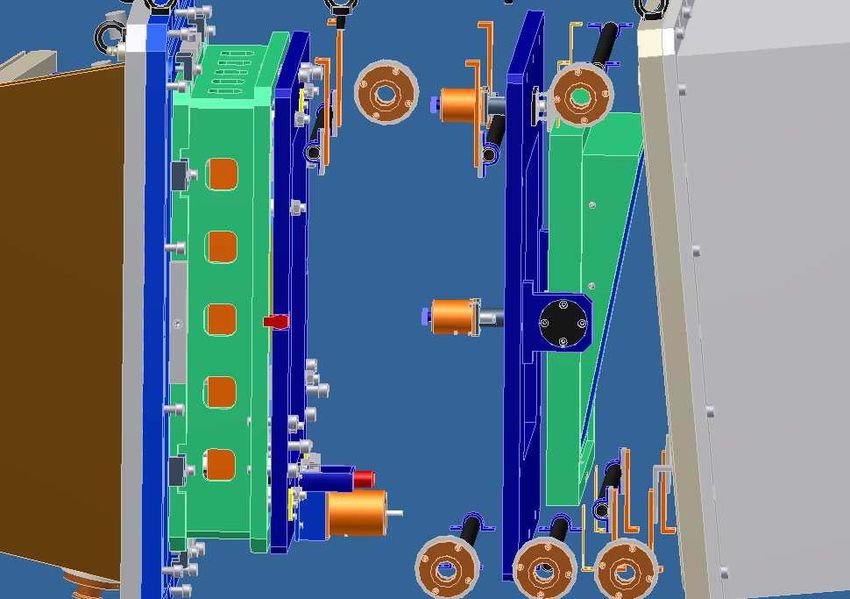
2 D. Zhao et al.
Slit cavity Fixed
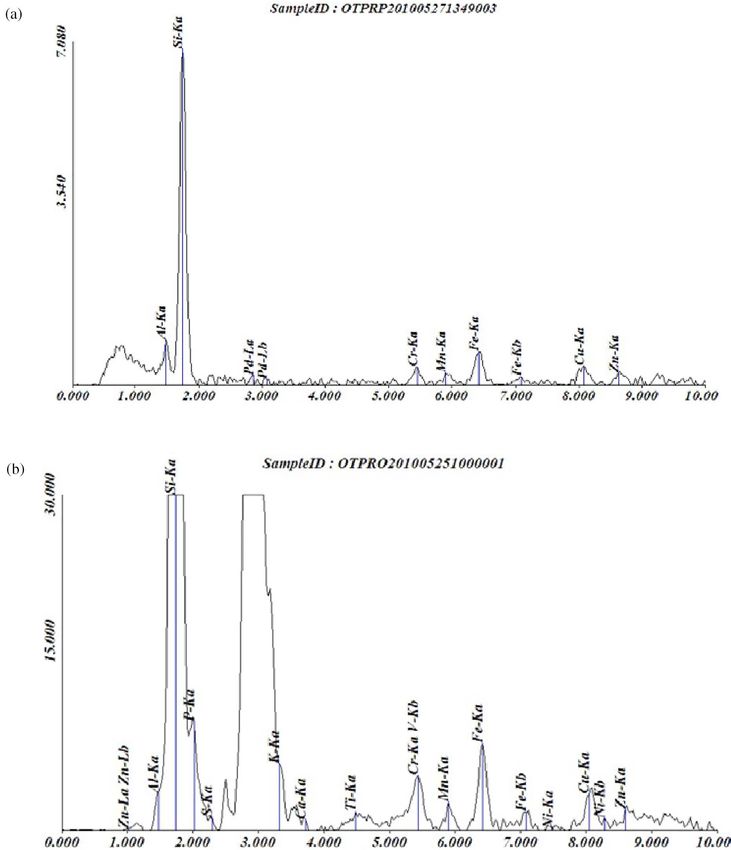
Figure 2. Numerical model of the FOA generated by ICEMCFD.
be indirectly damaged because of the contaminants. As
Figure 1. The prototype FOA is composed of fixed interfaces to the target shown in the last section, the BSG, MDS and DDS are tilted
chamber and five modules that house eight full-aperture optics. The clear
by 13.5◦ , and most of the ghost images are deflected from
aperture size is 310 mm × 310 mm.
the main beam path to protect the optics. These ghost images
lead to another problem, i.e., the presence of contaminants.
doubler and a 10.5 mm-thick Type-II KDP tripler, optimized To avoid contaminant sputtering to the optics, the following
to achieve >70% peak power conversion efficiency to the procedures are performed. First, the mechanism surfaces are
third harmonic at a 1ω0 driver irradiance of 3 GW cm−2 treated with anodic oxidation. Second, clean gas is used
(Ref. [7]). The wedged plate, which is a prism with an edge to blow the optics surface to eliminate contaminants. In
angle of 11.22◦ , combines with the focus lens to realize a this section, a numerical simulation is carried out based on
2 mm separating distance of the fundamental and second the FOA construction and a blowpipe arrangement, and the
harmonic away from the third harmonic target. The focus experimental results are presented.
lens has a 45 mm-thick meniscus-aspheric surface for avoid-
ing optical damage induced by ghost images of the fourth
order for 1ω, 2ω, and 3ω. The BSG and MDS are made with 2.1. Simulation analysis
8 mm-thick fused silica possessing a 0.2% low-efficiency
grating on the input surface for energy sampling. This setup The main physics process involved in the prototype FOA
provides transitions from the near-vacuum FOA environment is the convection–diffusion process in the slit cavity (as
to the hard-vacuum target chamber environment. The dispos- indicated in Figure 1). The governing equations for this
able debris shield is 2 mm-thick borosilicate glass. Here, the process can be written as
angle of the normal direction of the BSG and MDS to the ∂ρ ∂
DDS and the direction of the incident beam is 13.5◦ , which + (ρVk ) = 0, (1)
∂t ∂ xk
is used to deviate ghosts below the fourth order for 1ω0 , 2ω0
DV j 1 ∂(P − P0 ) ∂2Vj
and 3ω0 from the direction of the incident beam. Inside the =− +ν , (2)
prototype FOA, the pressure is 10 Torr with 10 SLPM before Dt ρ0 ∂x j ∂ xk ∂ xk
the laser shot and 50 Torr with 40 SLPM after the laser shot Dc ∂ 2c
=Γ , (3)
using clean dry nitrogen to purge. t ∂ xk ∂ xk
where Vi is the velocity vector (i = 1, 2, 3), t is time, ρ is
2. Clean-gas control the density of N2 , v is the kinematic viscosity of N2 , c is the
density of the aerosol in N2 , p is the pressure of N2 , p0 is
The optics in the prototype FOA are coated with a sol-gel the reference pressure, and ρ0 is the density in the reference
anti-reflection film, but residuary (0.5%–1%) reflection also point. Equation (1) is the continuity equation, Equation (2) is
exists. Hence, these eight optics (including 16 surfaces) the momentum equation, and Equation (3) is the composition
could form thousands of ghost images within the fourth- equation.
order reflection. If these ghost images are located on the The standard k–e model is used in the numerical simu-
optics, the optics would be directly damaged; if these ghost lation. This model is based on the hexahedron, and the
images move to other parts such as the mechanism, wire and gridding number is 2.9 million, as shown in Figure 2.
silica gel (the paste around the optical elements, to guarantee The gridding is optimized with the Smoother tools of the
the stability of the stress and deformation), the optics would Integrated Computer Engineering and Manufacturing code
Downloaded from https://www.cambridge.org/core. 13 Nov 2020 at 05:11:32, subject to the Cambridge Core terms of use.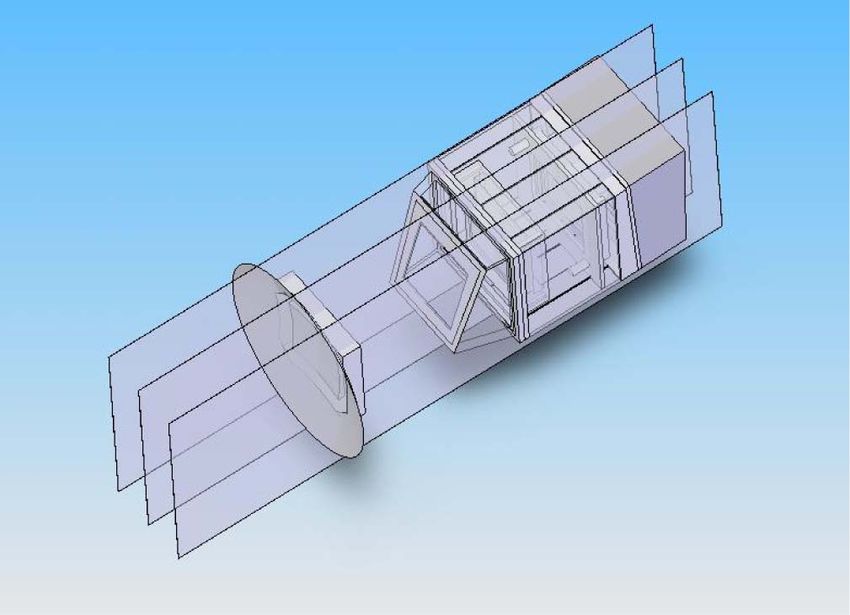
SG-II-Up prototype final optics assembly: optical damage and clean-gas control                                                                                        3

                    Cross section 1

                Cross section 2
                                                                                                                                                                     Gas inlets

                                                                                                                                                                     Gas outlets
                                                               Cross section 3

                                                                                                           Figure 5. Distribution of the gas inlets and outlets in the FOA.
             Figure 3. Schematic of the observed cross-section distributions in the
             prototype FOA.
                                                                                                     (a)

                                                                                                                               Slit type
                                                                                                     (b)

                                                                                                                               Hole type

                                                                                                                   Figure 6. Two types of inlet and exhaust pipes.

             Figure 4. Density distribution of the contaminants in cross-section 2 as the           2.2. Gas-blowing scheme
             flux ranges within 1–5 l s−1 after 30 s.
                                                                                                    In this section, the sizes, quantities and positions of the
                                                                                                    entrance and the exit as well as the gas-flow rate and hold
             for Computational Fluid Dynamics (ICEMCFD) based on
                                                                                                    time required for the contaminant elimination are given,
             the condition that the quality of the deformation rate above
                                                                                                    based on numerical analysis of the gas-flow characteristics
             0.8 is >90% and that all deformation rates are >0.3. The
                                                                                                    in the prototype FOA. Figure 5 shows the distributions of the
             deformation rate is defined as the ratio of the diameter of
                                                                                                    inlet pipes and the corresponding flanges. The FOA includes
             the excircle to that of the incircle. A larger deformation rate
                                                                                                    nine entrances and five exits.
             corresponds to higher grinding quality.
                                                                                                       The N2 used is 99.99% pure, and the H2 O content is less
                Based on the above model, three cross-sections are ana-
             lyzed, as shown in Figure 3. Flow situations of the flow field                           than 3 ppm. Gas is transported to the location where the
             in the cavities of the prototype FOA at 100 Torr and constant                          aerosol needs to be blown by the inlet pipe. Figure 6 presents
             pressure flux of 5 or 50 l s−1 are simulated. Then, the                                 two types of inlet and exhaust pipes. To ensure uniform
             ventilation efficiency on the optics surfaces and the density                           speed of the gas flow along the axial direction, the slit width
             distribution of contaminants in the FOA are investigated for                           is gradually increased from the point near the entrance to that
             the above two fluxes. An entrance and an exit also exist in                             near the exit for the slit-type pipe, as shown in Figure 6(a).
             each cavity of the FOA.                                                                For the small hole type (Figure 6(b)), the hole diameter is
                The simulation results show that both 5 and 50 l s−1                                increased and the distance between the adjacent holes is
             fluxes can maintain the relative density of the contaminants                            decreased gradually from the point near the entrance to that
             on the optics surfaces below 20% when the designed inlet                               near the exit.
             pipe, exhaust pipe and spatial distribution are used. About                               The configurations of the exhaust pipes are similar to those
             50 s after the laser launch, the contaminants decrease to                              of the inlet pipes. To ensure uniform speed of the exhaust
             0.1% when 5 l s−1 is used and 6% when 50 l s−1 flux is                                  flow along the axial direction, the slit width is gradually
             used, as shown in Figure 4. Therefore, considering the                                 increased from the point near the exit to the far end for the
             contamination-elimination time, the flux is chosen within                               slit-type pipe. For the small hole type, the hole diameter
             1–5 l s−1 and a 180 s period.                                                          is increased and the distance between the adjacent holes

Downloaded from https://www.cambridge.org/core. 13 Nov 2020 at 05:11:32, subject to the Cambridge Core terms of use.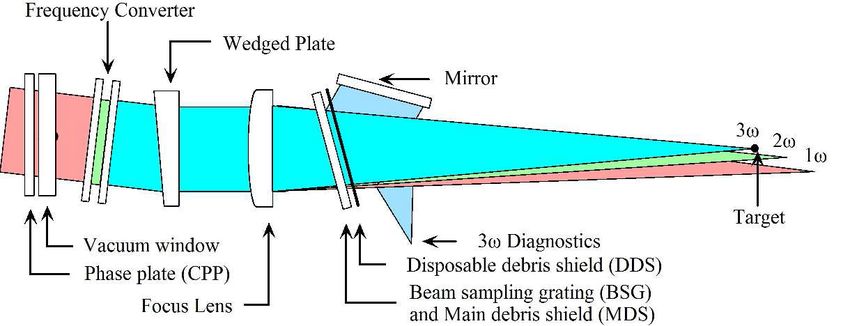
4                                                                                                                                     D. Zhao et al.

                                                                                              counter is used to detect contamination. Figure 7 shows
                                                                                              that the contaminant quantity increases from 3000 particles
                                                                                              before the laser fires to 140 000–210 000 particles after the
                                                                                              firing. Thus, the particle density contrast is about 1:70.
                                                                                              The optics surfaces is spotted after 33 shots. During the
                                                                                              experiment, results obtained by the particle counter are taken
                                                                                              from one of the exits. Hence, these results represent the
                                                                                              relative density variation of the contaminants rather than the
                                                                                              absolute quantity.

                                                                                              3. Optical damage

                                                                                              3.1. Damage morphology induced by the contaminants

                                                                                              Using an Msu25D high-resolution microscope, damage mor-
               Figure 7. Graph showing the real-time contaminant quantity.
                                                                                              phology is detected. Figure 8 shows the presence of surface
                                                                                              ‘mooning’ damage and a surface spot located outside the
       is gradually decreased from the point near the exit to the                             clear aperture and induced by contaminants apart from
       far end.                                                                               the common damage morphologies, such as surface pin-
                                                                                              point damage, block peeling, long scratching, and bulk
                                                                                              filament[7–9] . Here, surface mooning damage is serious in
       2.3. Experimental results                                                              the center and changes the color of the film, induced by metal
                                                                                              contaminants.
       In the experiment, the flow controller is triggered at the same                           The components and morphologies of the contaminants
       time as the laser fires. The flow flux is 40 SLPM. The particle                           are different; thus, the damage morphologies are also

                     (a)                                                                    (b)

                     (c)                                                                    (d)

       Figure 8. Surface damage morphologies induced by contaminants: (a) film damage located on the clear aperture brim, (b) surface spot outside the clear
       aperture, (c) clear aperture brim and (d) surface ‘mooning’ damage outside the clear aperture.

Downloaded from https://www.cambridge.org/core. 13 Nov 2020 at 05:11:32, subject to the Cambridge Core terms of use.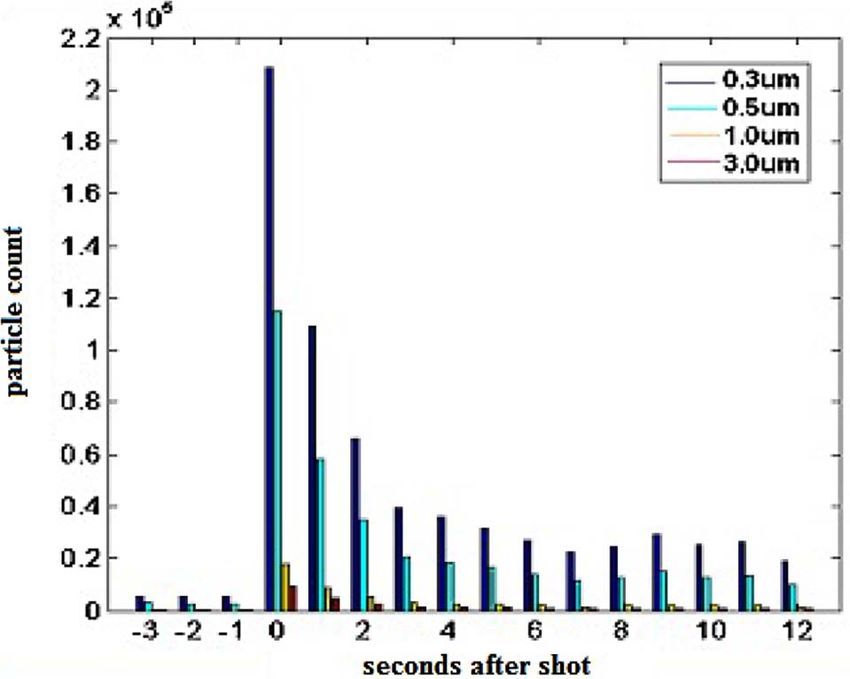
SG-II-Up prototype final optics assembly: optical damage and clean-gas control                                                                             5

             Figure 9. Results obtained by x-ray fluorescence spectrometry: (a) unused silica coated by sol-gel film (including Al, Si, Pd, Cr, Mn, Fe, Cu and Zn) and
             (b) used silica coated by sol-gel film (including Zn, Al, Si, P, S, K, Ca, Ti, Cr, Mn, Fe, Ni and Cu; because the Pb amount is negligible, it is not labeled).

             different. The different figure subparts are explained as                                 (b) Figure 8(b) is induced by wire and silica gel. Occurr-
             follows.                                                                                     ences of this kind of morphology are numerous on
                                                                                                          the optics surfaces. If the wire and silica gel are
                (a) Figure 8(a) is induced by millimeter order fibers
                                                                                                          irradiated by a laser, parts of them volatilize and are
                    absorbing on the optics surfaces. After less than
                                                                                                          then absorbed on the optics surfaces. After several
                    0.1 J cm−2 order laser irradiation, the fiber is ablated
                                                                                                          irradiations by stray light, they appear ablated but do
                    and induces film damage. Suffering from multiple
                                                                                                          not damage the sol-gel film.
                    irradiations, the damage size increases and induces
                    substrate damage. Given that the heat absorption                                   (c) Figure 8(c) is induced by millimeter order metal con-
                    coefficient of the fiber is low, this kind of damage                                     taminants. The substrate is damaged, and the surface
                    cannot induce catastrophic bulk peeling.                                               ‘mooning’ damage of the sol-gel film appears. This

Downloaded from https://www.cambridge.org/core. 13 Nov 2020 at 05:11:32, subject to the Cambridge Core terms of use.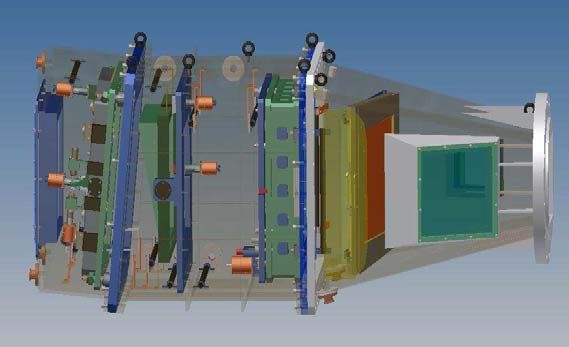
6                                                                                                                                            D. Zhao et al.

                kind of damage is due to the optics surface being                             bution of ‘mooning’ damage or surface spots outside the
                affected by metal particle sputtering. After less than                        clear aperture suggest that the contaminants induced by stray
                0.1 J cm−2 order laser irradiation, the damage size                           light because of the residual reflection from the mechanical
                increases and the sub-millimeter order damage points                          metals, silica gel and wire are the main reasons for the
                are uniformly distributed in the clear aperture because                       damage increase. The gas flow used in the experiment
                of the high absorption coefficient of the metal.                               eliminates certain contaminants, but ineffectively. Surface
                                                                                              treatment of the metallic material is not completely effective
           (d) Figure 8(d) is induced by the same millimeter order                            for elimination of contaminants. Stray light absorbing traps
               metal contaminants. The substrate is seriously dam-                            are required in the prototype.
               aged in the center, and surface ‘mooning’ damage of
               the sol-gel film appears in the periphery. This phe-
               nomenon is also induced by the metal contaminants                              References
               but occurs outside the clear aperture and is irradiated
               by the stray light.                                                             1. S. H. Glenzer, B. J. MacGowan, P. Michel, N. B. Meezan, L. J.
                                                                                                  Suter, S. N. Dixit, J. L. Kline, G. A. Kyrala, D. K. Bradley, D. A.
                                                                                                  Callahan, E. L. Dewald, L. Divol, E. Dzenitis, M. J. Edwards,
                                                                                                  A. V. Hamza, C. A. Haynam, D. E. Hinkel, D. H. Kalantar, J. D.
       3.2. Component analysis of the contamination                                               Kilkenny, O. L. Landen, J. D. Lindl, S. LePape, J. D. Moody, A.
                                                                                                  Nikroo, T. Parham, M. B. Schneider, R. P. J. Town, P. Wegner,
       Parameters such as the components of the laser-induced                                     K. Widmann, P. Whitman, B. K. F. Young, B. Van Wonterghem,
       damage point, the irradiated point without damage and the                                  L. J. Atherton, and E. I. Moses, Science 327, 1228 (2010).
       un-irradiated point, as well as the mechanical material, wire,                          2. B. M. Van Wonterghem, S. C. Burkhart, C. A. Haynam, K. R.
                                                                                                  Manes, C. D. Marshall, J. E. Murray, M. L. Spaeth, D. R. Speck,
       silica gel, unused silica and chemical films, are analyzed by                               S. B. Sutton, and P. J. Wegner, Proc. SPIE 5341, 55 (2004).
       energy-dispersive x-ray fluorescence spectrometry. Figure 9                              3. Z. Lin, Chin. J. Lasers 37, 2202 (2010).
       shows that the new components S, P, K, Ca, Mn, Al and Pd                                4. D. Zhao, G. Zhen, P. Shao, N. Hua, Z. Qiao, Y. Dai, and J. Zhu,
       appear and that the contents of the Fe and Cu increase in                                  Chin. J. Lasers 34, 637 (2007).
                                                                                               5. C. A. Haynam, P. J. Wegner, J. M. Auerbach, M. W. Bowers, S.
       the used optics compared with the unused optics. Al and                                    N. Dixit, G. V. Erbert, G. M. Heestand, M. A. Henesian, M. R.
       Pd come from the sol-gel film; S, P and K are from the                                      Hermann, K. S. Jancaitis, K. R. Manes, C. D. Marshall, N. C.
       silica gel used to fix the optics; Ti and Cu come from the                                  Mehta, J. Menapace, E. Moses, J. R. Murray, M. C. Nostrand,
       metal material sputtering of the prototype FOA. Molecular                                  C. D. Orth, R. Patterson, R. A. Sacks, M. J. Shaw, S. B. Sutton,
                                                                                                  W. H. Williams, C. C. Widmayer, R. K. White, S. T. Yang, and
       contaminants were not analyzed by Raman spectrometry
                                                                                                  B. M. Van Wonterghem, Appl. Opt. 46, 3276 (2007).
       because of the large optics size (360 mm × 370 mm).                                     6. Z. Lin, S. Wang, and D. Fan, Chin. J. Lasers B10, IV6 (2001).
                                                                                               7. D. Zhao, L. Wang, Z. Lin, P. Shao, L. Ji, Z. Cai, R. Wu, Y.
                                                                                                  Dai, and J. Zhu, Chin. J. Lasers 38, 0702001 (2011).
       4. Conclusions                                                                          8. S. Papemov and A. W. Schmid, Proc. SPIE 7132, 71321J
                                                                                                  (2008).
                                                                                               9. T. I. Suratwala, P. E. Miller, J. D. Bude, R. A. Steele, N. Shen,
       The uniform distribution of hundred-micron-order puncti-                                   M. V. Monticelli, M. D. Feit, T. A. Laurence, M. A. Norton, C.
       form damage in the clear aperture and the uniform distri-                                  W. Carr, and L. L. Wong, J. Am. Ceram. Soc. 94, 416 (2011).

Downloaded from https://www.cambridge.org/core. 13 Nov 2020 at 05:11:32, subject to the Cambridge Core terms of use.
You can also read