Advanced Biofuels from co-processing Fast Pyrolysis Bio-Oil - BioFIT webinar 24 March 2021, Tijs Lammens - biofit h2020
←
→
Page content transcription
If your browser does not render page correctly, please read the page content below
Advanced Biofuels
from co-processing
Fast Pyrolysis Bio-Oil
BioFIT webinar

24 March 2021, Tijs Lammens
Agenda
1. About BTG Bioliquids and our commercial
   fast pyrolysis bio-oil production facilities

2. FPBO co-processing: green content tracking

3. Summary and Conclusions

                      Advanced biofuels from FPBO – March 2021   2
Company
introduction
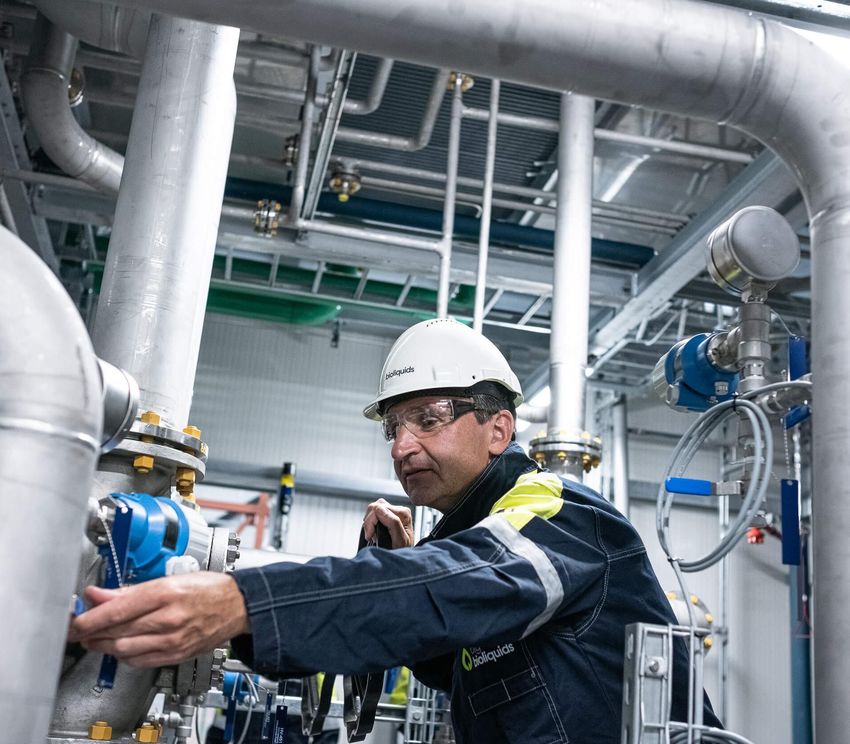
As a technology provider and product leader we are
committed to the commercial deployment of our fast
pyrolysis technology.

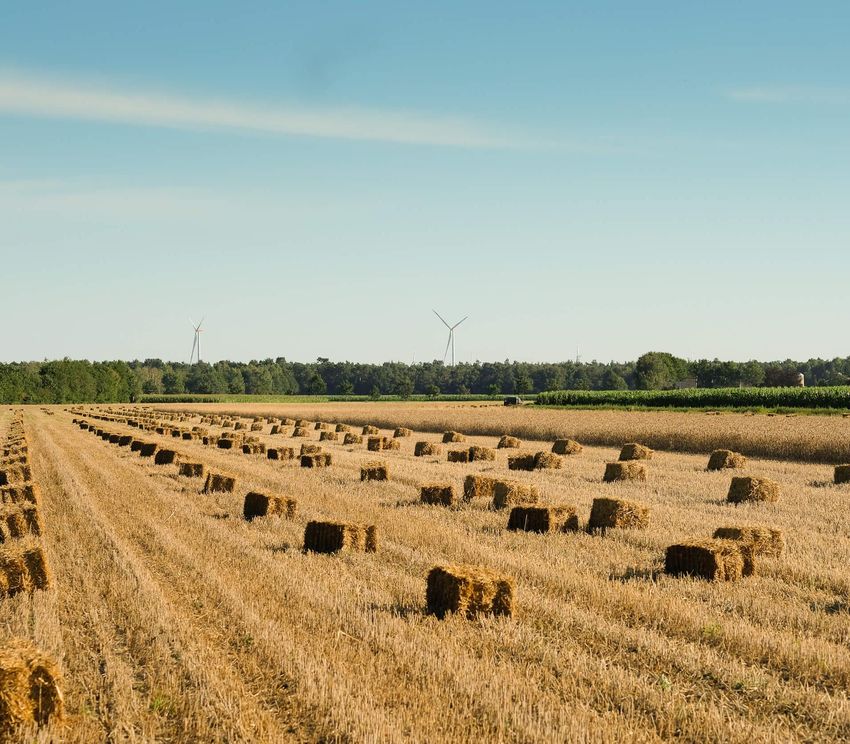
Fast Pyrolysis Bio-Oil is explicitly made from biomass
residues and is known as second generation (2G) or
advanced biofuel. It does not compete with the food chain.

                                                             Advanced biofuels from FPBO – March 2021   3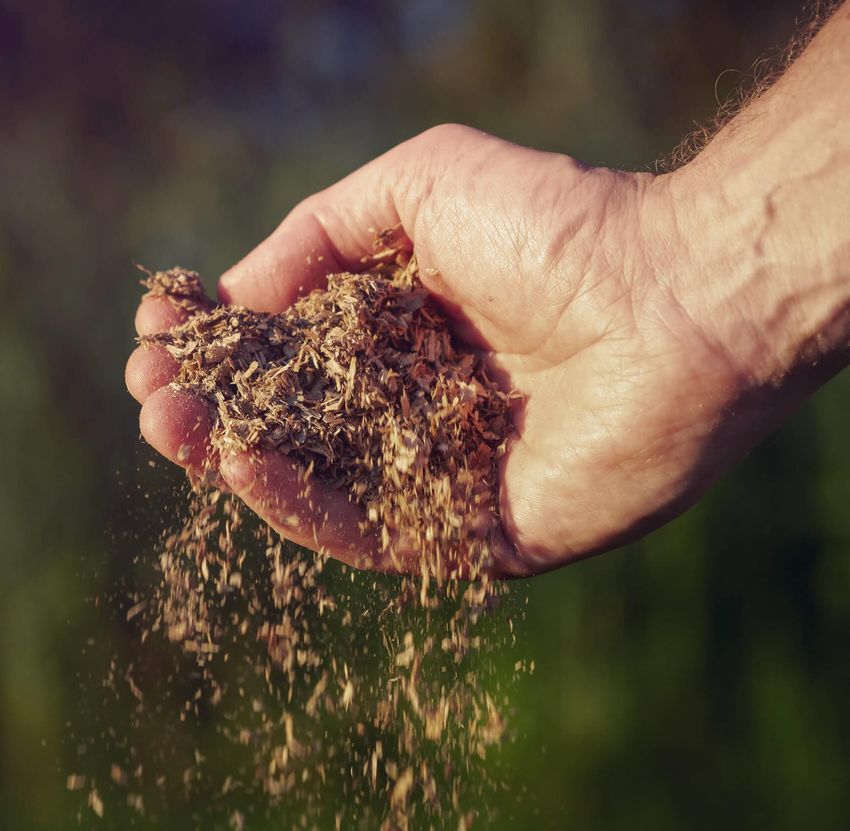
Our company milestones

  1987              2008                2015               2016              2019                      2020
 BTG starts as a    BTG Bioliquids   Start up of Empyro    Cooperation      Empyro sold to           Start up of Green
spin-off from the   is established   in the Netherlands   agreement with     Twence, the             Fuel Nordic plant
  University of         by BTG                             TechnipFMC        Netherlands                 in Finland
     Twente
                                                           Starting BTG    Green Fuel Nordic,          Pyrocell plant
                                                            Bioliquids          Finland              under construction
                                                             webshop
                                                                           Pyrocell, Sweden

                                                                                  Advanced biofuels from FPBO – March 2021   4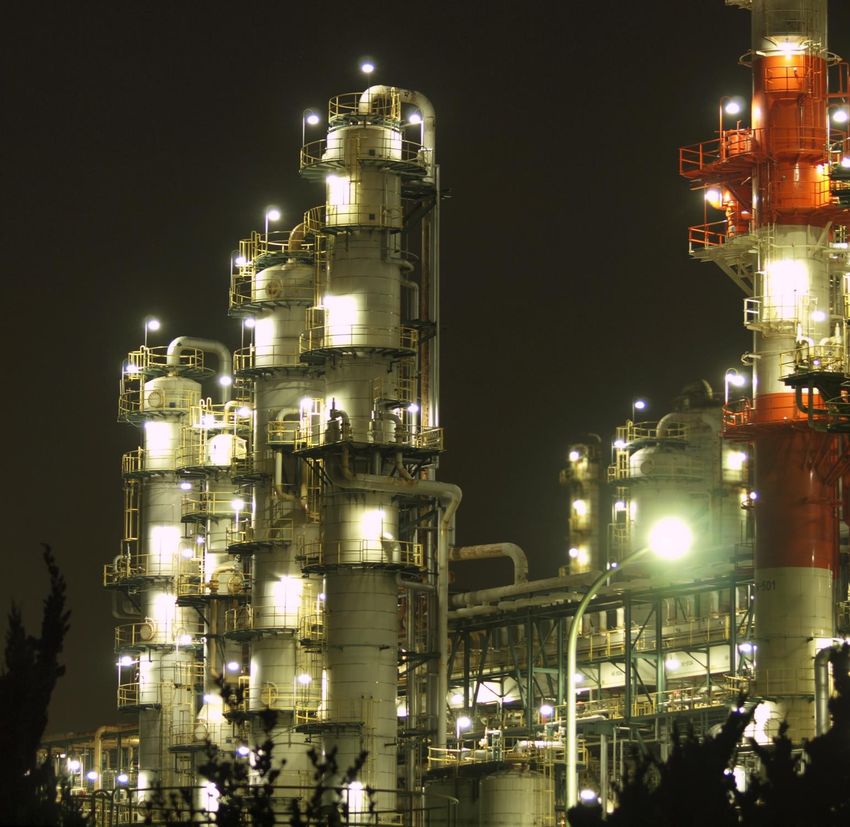
Fast pyrolysis
technology
 Thermochemical decomposition of biomass residues through
 rapid heating (450-600 ℃) in absence of oxygen.

 Different types of biomass residues can be converted into one
 homogeneous energy carrier: Fast Pyrolysis Bio Oil (FPBO).

 By products are heat (steam) and power (electricity)

                     Advanced biofuels from FPBO – March 2021    5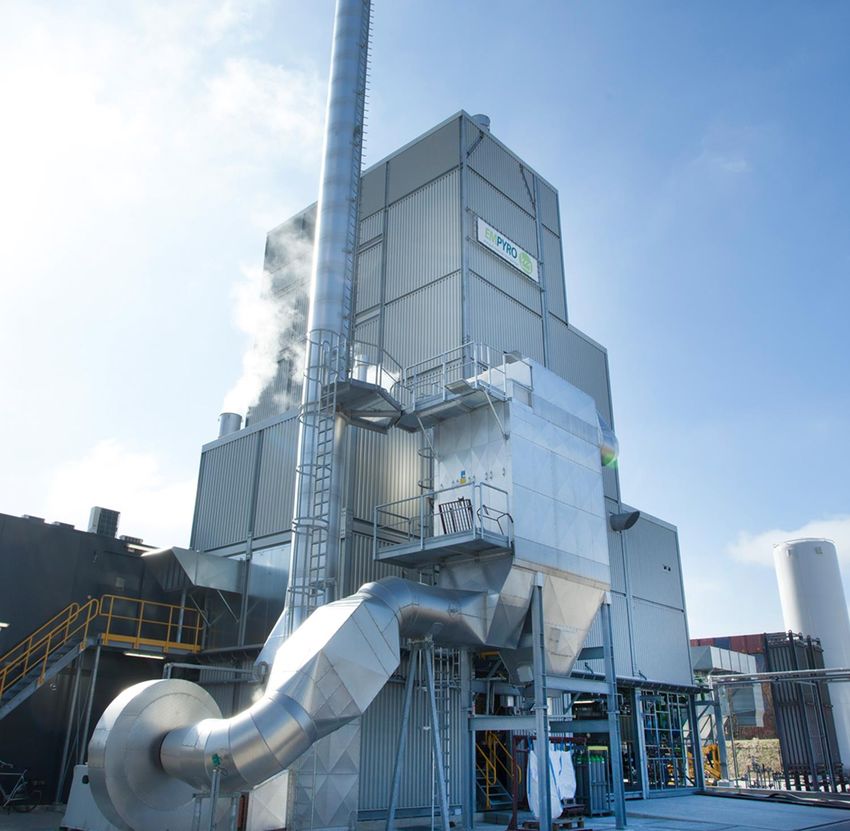
Commercial scale:
Empyro and more
                                     Green Fuel Nordic, Lieksa
                                     Finland - 2020                   Production started
                                                                      in December 2020

                                 Pyrocell Setra, Gävle
                                 Sweden - 2021
        Empyro Twence, Hengelo                                   Under construction,
        The Netherlands - 2015                                   Start-up in 2021

                                        Advanced biofuels from FPBO – March 2021       6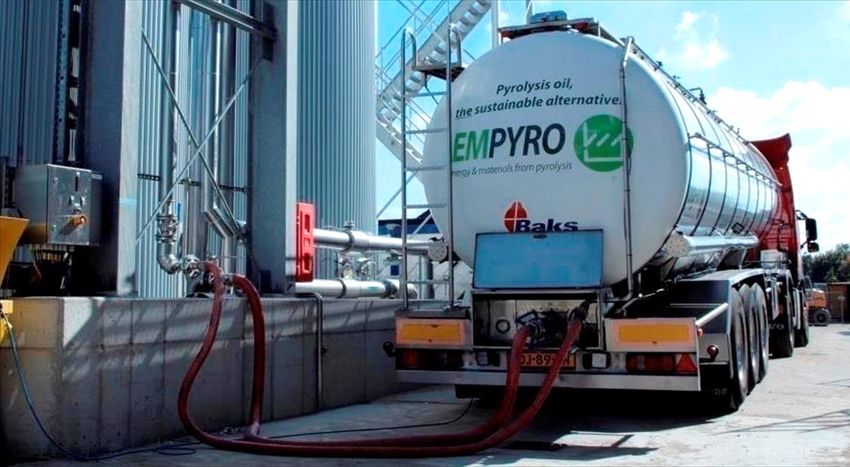
Properties of Fast
                 Pyrolysis Bio-Oil
                   Lignocellulosic: made from sawdust, forestry residues, straw, etc.

                   Water content: 20 – 25 wt-%

                   Oxygen content: 45 – 50 wt-%

                   Density: 1.1 – 1.2 kg/L

                   Viscosity (40 oC): 10 – 30 cSt
FPBO is “an emulsion                of lignin fragments
              Energy content (LHV): 16 – 17 MJ/kg
in a sugar syrup”.
              Acidity (pH): 2.5 – 3

                   Ash and solids contents: < 0.1 wt-%

It ís a dark liquid…
                Sulphur content: < 0.01 wt-%

… but not a typical            refinery feedstock!
                Alkali’s content (Na+K+Ca+Mg): 50 – 70 ppm

                                             Advanced biofuels from FPBO – March 2021   7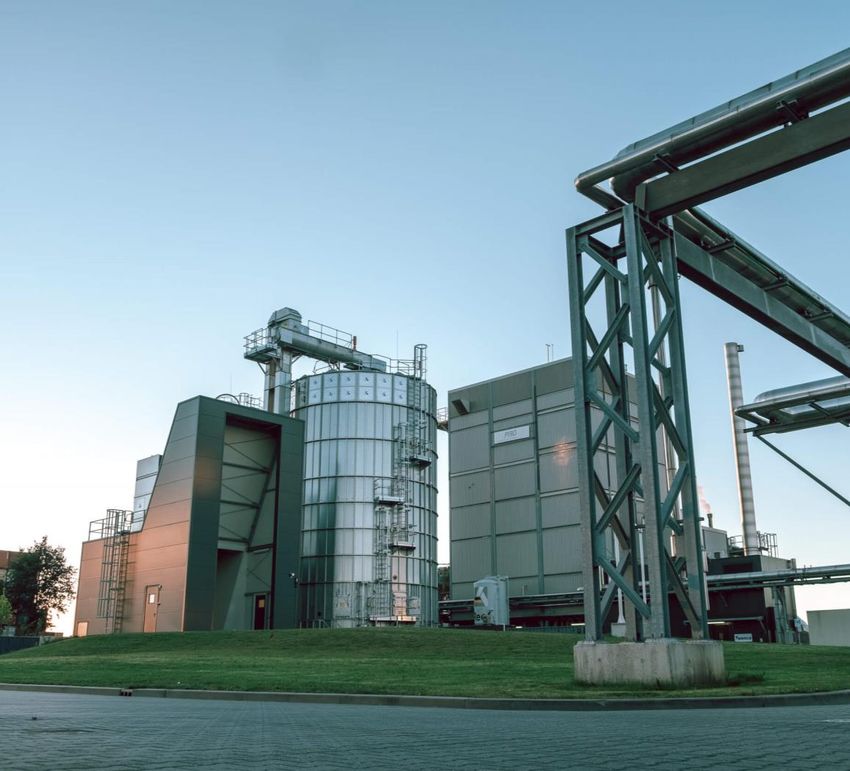
Co-processing
FPBO
and green content tracking

                Advanced biofuels from FPBO – March 2021   8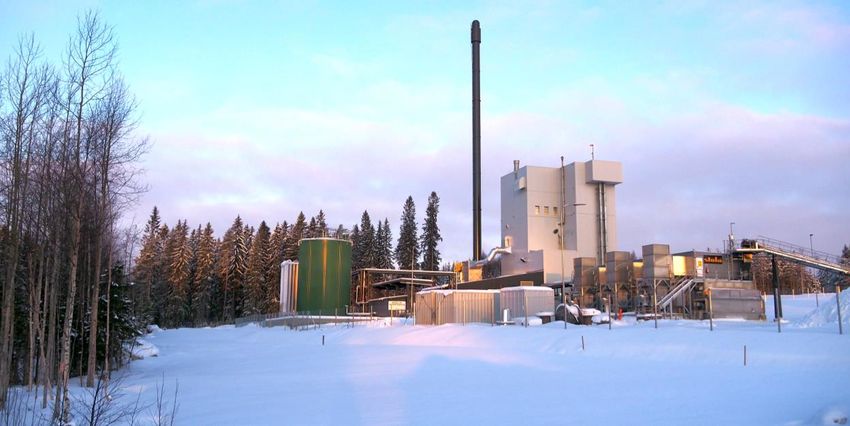
Routes from FPBO to transport fuels
                                                     Oil refinery
                  Crude oil

                                                                          Transport fuels
Co-processing uses existing infrastructure:
 ➢ Low CAPEX
 ➢ Short time-to-market
 ➢ Fast GHG reduction                         FPBO           SPO    MTF

                  Biomass residues

                                                                                                 FPBO: fast pyrolysis bio-oil
                                                                                                 SPO: stabilised pyrolysis oil
                                                                                                 MTF: mixed transportation fuels

                                                                          Advanced biofuels from FPBO – March 2021          9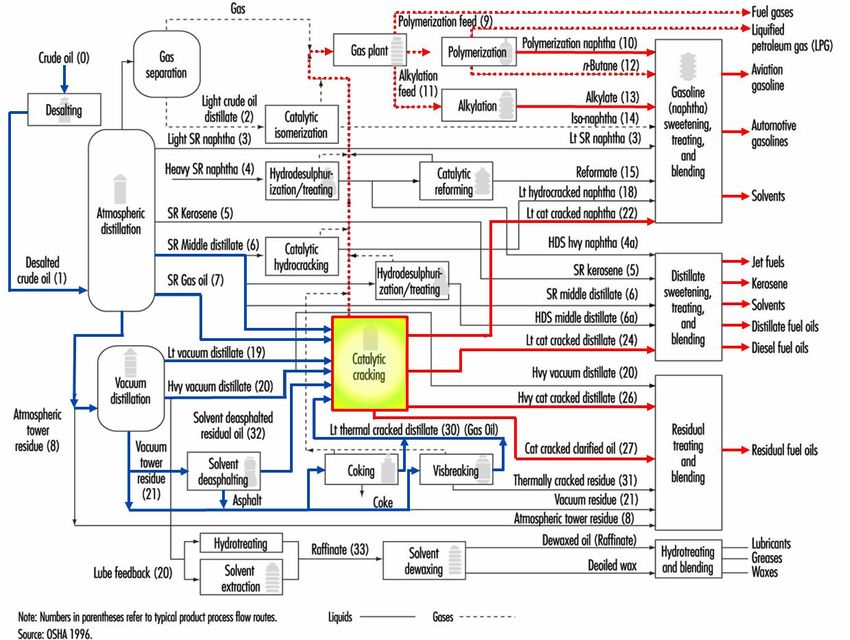
Fluid Catalytic Cracker (FCC)
FCC unit is the FPBO gateway into a refinery:

  Can deal with water, oxygenates, and coking

  Many possible (blending) outlets for FCC products

  Challenge: how to track the green content?

                                                      Advanced biofuels from FPBO – March 2021   10
Co-FCC of FPBO
how does it work?
Typical yields:
4 wt%
FPBO is injected via separate nozzles into the FCC riser
14 wt%
Biomolecules cracked together with the regular FCC feed
50 wt%
20 wt% Acidity disappears upon contact with the hot catalyst
7 wt% Green content is distributed across the different products
Operability proven for 5 wt-% FPBO at commercial scale
Operability proven for 10 wt-% FPBO at pilot scale
Indicative co-FCC scheme for FPBO
Advanced biofuels from FPBO – March 2021 11FPBO impact on FCC product yields
FPBO co-processing has little impact on
overall FCC product yields (Pinho et al.):
5 wt-%: slight increase of gasoline
production and decrease of heavies.
At 10 wt-%: overall decrease in product
yields, due to oxygen/water in FPBO.
Oxygenates in FPBO result in CO, CO2
and water production.
LPG + Gasoline + LCO : 74.0 wt% LPG + Gasoline + LCO : 74.0 wt% LPG + Gasoline + LCO : 70.5 wt%
➢ Where does the green content go?
Advanced biofuels from FPBO – March 2021 12Tracing green content
Tracing biogenic content through a supply chain is easy and well-established for
products with a high biogenic content.
Co-processing vegetable oils in hydrotreaters to produce HVO is also well-established
Certification systems exist for such pathways, such as ISCC. These rely on:
1. Either radiocarbon determination (“14C”)
2. Or bookkeeping methods (e.g. mass / energy balance)
However, the combination of challenges for FCC co-processing of FPBO is unique:
➢ Scale difference between a fast pyrolysis plant and FCCU is typically 1 : 100
➢ FPBO co-processing volume is limited to ~ 5 wt-%
➢ Green content is distributed across many refinery products
This makes radiocarbon analysis unfeasible (as will be shown…)
Advanced biofuels from FPBO – March 2021 13A deep-dive into
14C analysis
Radiocarbon (“14C”) analysis appears to be the ideal method to
determine the green content of fuels from co-processing.
Pinho et al. published 14C data of the liquid product from co-
processing FPBO.
75 wt-% of the total product volume (the liquids) contained about
40 wt-% of the bio-carbon.
60 wt-% of the bio-carbon was unaccounted for. It could not be
traced by 14C.
Thus, the bio-carbon percentage in the gases and coke would be
over 4 times higher than in the liquids, which is very unlikely.
14C data published by Pinho et al. (2017) ➢ How reliable is 14C analysis? Especially below 5 wt-%?
Advanced biofuels from FPBO – March 2021 14The way in which radiocarbon forms and decays
About 14C analysis
Radiocarbon (14C) is formed in the atmosphere by radiation.
Living plants absorb 14CO2 and turn it into biomass.
14Cin dead matter gradually decays. Hence fossil fuels do
not contain 14C and biofuels do.
14C can be detected by a.o. Accelerator Mass Spectrometry.
The ratio 12C : 14C in the sample is compared to a reference
standard. This gives the Percentage Modern Carbon (pMC).
The statistical limit of detection is 0.44% pMC.
Bio-carbon percentage is pMC multiplied by Atmospheric
Source: Buchholz 2018
Adjustment Factor (AAF), to compensate for 14C fluctuations
in the atmosphere over time (e.g. by “A-bomb”).
Advanced biofuels from FPBO – March 2021 15Percentage Modern Carbon in FCC diesel (LCO) samples
Our own 14C data
Gasoline and diesel (LCO) samples from the co-processing of
5 and 10 wt-% FPBO were diluted with defined amounts of
fossil fuel, to mimic co-processing lower percentages FPBO.
If 14C analysis is accurate, linear dilution of samples
containing biocarbon with fossil fuel should result in linear
14C concentration trends.
Results are shown here for the diesel samples.
Data scatter was found to be significant, especially below
the “statistical limit of detection (LOD)”.
Error margins are those that were provided by the analytical lab. For individual samples, the observed deviations were much
larger than the indicated error margins.
Advanced biofuels from FPBO – March 2021 16Resulting biogenic carbon in FCC diesel (LCO) samples 14C to bio-carbon Biogenic carbon percentages derived from the PMC values are indicated. ASTM prescribes an absolute error of 3 wt-% biogenic carbon when using 14C analysis, because of the know inaccuracies with this method, e.g. the “bomb effect” that effects the Atmospheric Adjustment Factor. When incorporating those error margins, the data become meaningless. Conclusion: 14C analysis is unsuitable for these low co- processing percentages (
Bookkeeping methods

     Observed yields                                      Mass balance
     - Difference in product yields between a fossil      - Mass of bio-feed is a fraction of total feed
       baseline and that baseline plus co-processing      - Bio-fraction is equally distributed across all
     - 95 t/h fossil feed vs. 95 t/h fossil + 5 t/h bio     products
     - Yield increase is then the biofuel yield           - Can also be done as “carbon-mass balance”
     - Also referred to as “incremental yields”           - CO, CO2 and water need to be excluded

     Energy balance                                       Free attribution
     - Energy content of bio-feed is a fraction of        - Operator can choose to which product the
       energy content of fossil- plus bio-feed              bio-fraction is allocated
     - Bio-fraction is equally distributed across all     - Used for bio-based chemicals in ISCC PLUS,
       products                                             e.g. for co-processing in steamcracker

                                                                      Advanced biofuels from FPBO – March 2021   18
Co-processing yields from bookkeeping methods
Bookkeeping
case study
Observed yields method gave both positive and negative
yields (due to “synergistic effects”). The existing method was
adapted to avoid overestimation of biofuel yields.
Carbon mass and total mass balance methods gave different
results, probably due to inaccuracies in oxygen balance.
Energy balance method gave lower yields than mass balance,
perhaps due to inaccuracies in energy contents.
Free attribution is straightforward and easy to implement, but
its “fairness” is being challenged.
Note: FCC product yields from 5 wt-% FPBO co-processing and fossil
baseline scenario were taken from data published by Pinho et al. Observed yields and energy balance methods strike a good
balance between implementability and accuracy.
Advanced biofuels from FPBO – March 2021 19Summary and
Conclusions
FCC co-processing of FPBO has a high potential as pathway to advanced biofuels
➢ Low CAPEX
➢ Short time-to-market
➢ Fast GHG emissions reduction
Biogenic content tracing is particularly challenging for this pathway
➢ Scale difference between a pyrolysis plant and FCCU is typically 1:100
➢ FPBO co-processing percentages are limited to ~ 5 wt-%
➢ Green carbon is distributed across many refinery products
Radiocarbon analysis is unfeasible for commercial purposes
➢ Experimental results showed large data scatter and “bomb effect”
Bookkeeping methods are not perfect, but they are appropriate for this pathway
➢ Observed yields (modified) and energy balance are the most suitable methods
➢ Verification of renewable input could be done with 14C analysis of the FPBO
Advanced biofuels from FPBO – March 2021 20Thank you
Josink Esweg 34 W: www.btg-bioliquids.com
7545 PN Enschede T: +31 (0)53 486 22 87
The Netherlands E: office@btg-bioliquids.com
@BTG Bioliquids /BTG BioliquidsBack-up slides
22Our process from biomass to FPBO
Heat + Power
32 E-%
Wood residue
5 dry ton/hr
FPBO
65 wt% / 56 E-%
23The FPBO
supply chain
Biomass conversion
Local processing of biomass residue feedstock
Returning minerals to the soil
FPBO transportation
Biomass liquified
10x densified versus raw biomass feedstock
FPBO processing and disctribution
Centralized location
Make use of existing infrastructure
24Empyro
The Netherlands
In 24/7 operation since 2015
First commercial FPBO plant in the world that runs 24/7.
Empyro was sold to Twence early 2019.
Biomass feedstock – wood residue
Biomass input – 36.000 ton/year
FPBO output – 24.000 ton/year
Steam output – 80.000 ton/year
Electricity output – 2.200 MWh/year
25FPBO application
at FrieslandCampina
FPBO replaces 10 million m3 natural gas
Sustainable heat is used for producing dairy products
Switch from gas to FPBO provides 90% GHG reduction
Boiler runs without problems; processed all FPBO from
Empyro
Borculo site reduced overall CO2 footprint by 15%
26Green Fuel Nordic (Finland)
a true trailblazer
Location: Lieksa, Finland
Biomass residue is clean sawdust
Start on-site reassembly of modules August 2020
First FPBO production on December 2, 2020
FPBO as part of carbon neutral energy strategy of
customer Savon Voima Joensuu heating plant
Further investments and expansion are planned
27Pyrocell project (Sweden)
from sawdust to tank
Pyrocell is Joint Venture of Setra and Preem
Production of FPBO from sawdust – start-up in 2021
Fast pyrolysis technology – annual FPBO production
25,000 tonnes – GHG reduction of 80-90%
FPBO will be co-processed in Preem refinery
Equivalent of 15,000 family cars powered per year
Advanced biofuels under EU RED II directive
2814C experiment: approach
▪ We have samples of 5 & 10 wt% co-FCC, which contain 1 & 2 wt-% bio-C
▪ By preparing a dilution set (diluting with the same product from 0 % co-FCC,
we can go down in the range between 0.1 and 5 wt% bio-C
▪ Also analysed: 4 samples of FPBO (100% bio-C) with fossil butanol to test
conversion pMC > bio-C
*) Gasoline and LCO were prepared by Petrobras by distillation
of Total Liquid Product (TLP); cutpoints: 220 oC and 344 oC
Company Introduction – December 22, 2020 – V1 2914C results: Gasoline & TLP
▪ Gasoline sample was diluted with product from 5 wt-% co-FCC instead of 0 wt-% co-FCC,
due to inaccurate labelling of the gasoline product container.
▪ Uncertainties are again significant, also data scatter above limit of detection. Gasoline
samples of 5 wt-% show a relative error margin of 33 %. (values between 0.75 and 1.05)
▪ TLP samples paint the same picture as gasoline and LCO.
Company Introduction – December 22, 2020 – V1 3014C results: Atmospheric Adjustment Factor
Observations:
▪ The atmospheric adjustment factor prescribed by ASTM for converting
pMC into bio-C-% was checked by measuring the pMC of FPBO samples
with known bio-C content.
▪ For all samples the measured pMC was 15% higher than the actual bio-C
content (see graph).
▪ This observation was discussed with the 14C lab and together the
conclusion was drawn that this is probably due to the “bomb curve”: the
sawdust-FPBO contains more radiocarbon than the current average
radiocarbon concentration in the atmosphere.
Company Introduction – December 22, 2020 – V1 31BTG Bioliquids
we replace fossil
fuels
Advanced biofuels from FPBO – March 2021 32You can also read


