Spectroscopy in medicine and population screening - Elaine Holmes - Applications of targeted metabolic profiling by 1H NMR - Bruker
←
→
Page content transcription
If your browser does not render page correctly, please read the page content below
Bruker Webinar
                                                30th August 2018

Applications of targeted metabolic profiling by 1H NMR
 spectroscopy in medicine and population screening

                        Elaine Holmes
     Computational and Systems Medicine, Imperial College, U.K.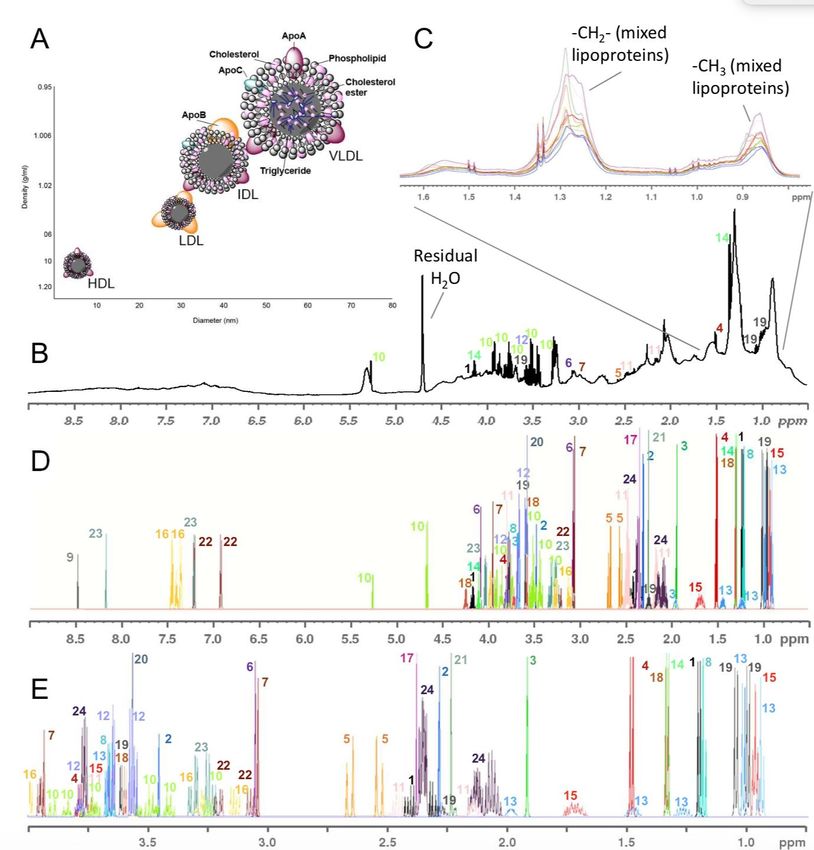
Your “phenome”

  A phenome is represented by an integrated set
  of measureable physical and clinical features
  coupled to chemical, metabolic and physiological
  properties that define biological sub-classes and
  individuality.
Metabolic profiling
Why NMR Spectroscopy ?

➢ Every spectroscopic platform has strengths and weaknesses. NMR
  is a robust platform that delivers information on atom-centred
  properties.

➢ With untargeted profiling there will always be some degree of
  inter-laboratory variation but NMR spectroscopy has repeatedly
  been shown to be robust and reproducible in high throughput
  mode. Because of the inherently quantitative basis of NMR both
  targeted (quantified metabolite concentrations) and untargeted
  profiles can be acquired at the same time allowing both hypothesis
  testing and hypothesis generation.

➢ NMR can be used as a first line screen to detect outlier samples
  before progressing to other analytical platforms.
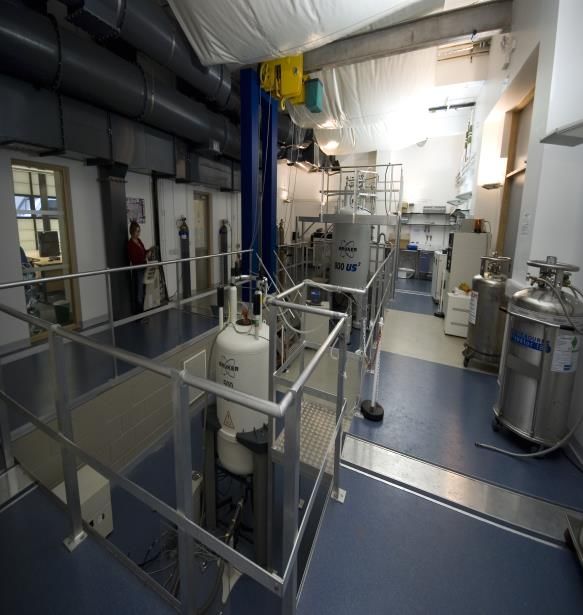
The National Phenome Centre employs high throughput
                  1H NMR profiling

 • 96 sample assays per day per instrument = 1 rack
   (this is not at full capacity)

                                     • 288/day
                                     • >100,000/year

                                     • Each sample
                                       profiled with 3
                                       NMR experiments
                                      >300 K data sets/yr
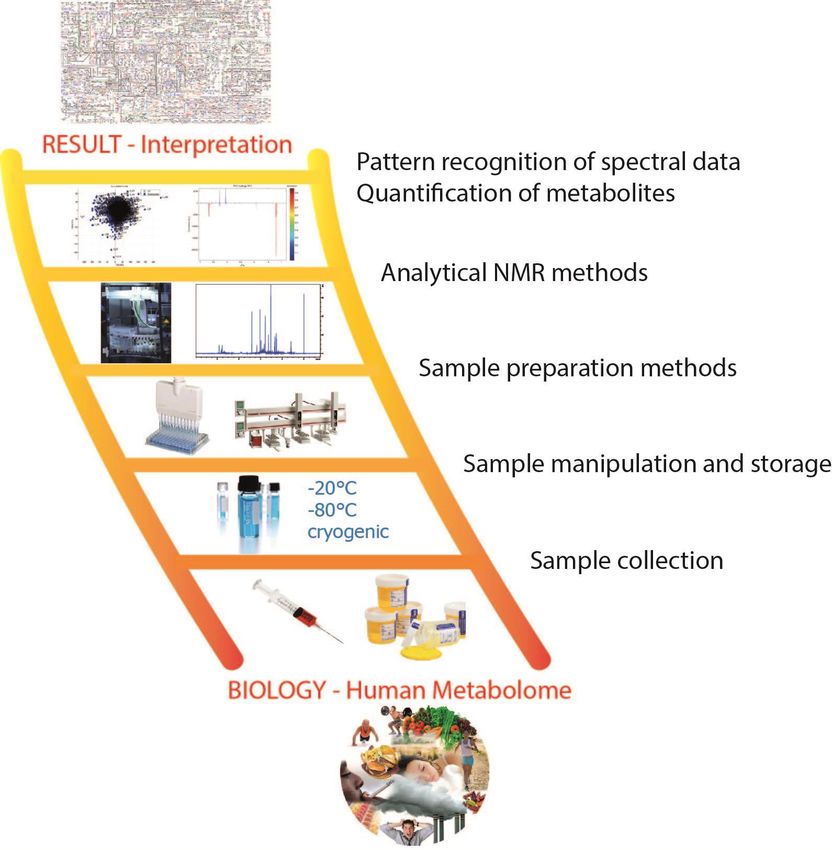
Sample workflow

      Dona et al Anal Chem 2014
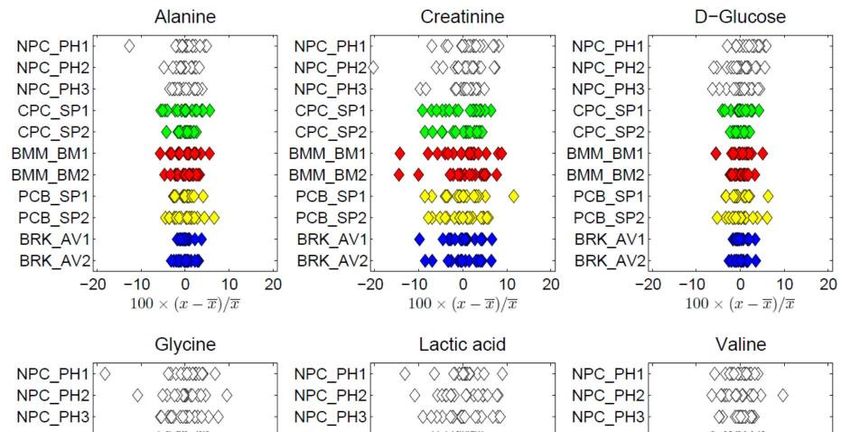
Harmonization across the metabolic
profiling community (600 MHz)

•   Ensuring SOPs and analytical pipelines are
    consistent
•   Sharing of SOPS and protocols
•   Ring trials
•   Sharing of databases

Spectral quality requirements

                           PLASMA
Lipoprotein Ring Test: quantification of lipoproteins with added set
of 24 low molecular weight molecules

                                          Ring trial partners

                                5 Institutions
                                11 Different NMR Spectrometers
                                2 daily QCs
                                6 days of analysis
                                2 replicates NIST 1951c
                                40 donor samples (20 sera, 20 plasma)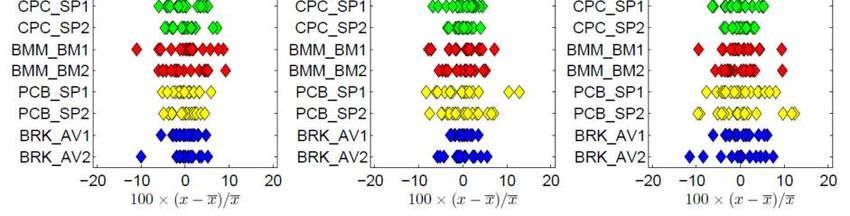
NMR-based metabolite quantification: schematic of fitted
  compounds in serum using Bruker B.I.LISA method

                                             A) Cartoon of lipoprotein
                                             particle size and density.

                                             B) Overlaid spectra of serum
                                             samples (C)
                                             .
                                             D) Overlaid spectra of the 24
                                             small molecules quantified
                                             with expansion of crowded
                                             region (E)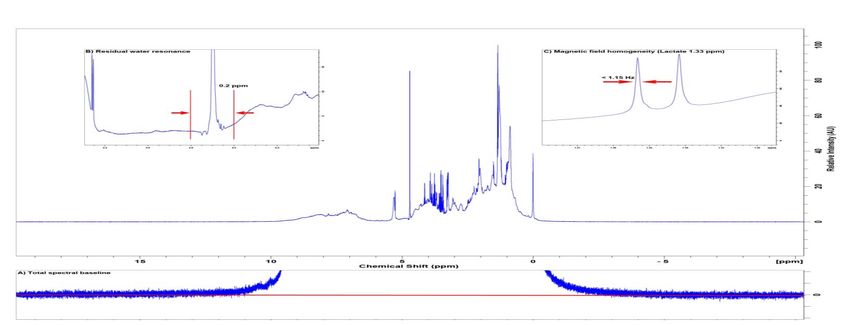
Schematic of the NMR lipoprotein subclass analysis approach: Plasma or serum is collected
from a reference cohort; each sample is then ultracentrifuged in order to determine the main
and subfractions of lipoproteins; NMR spectra are taken from each of the modelling samples; a
regression model is developed from the combined information of both methods; Method is
made available on the spectrum analysis server to be shared with other NMR laboratories.

                                              electronic signal
Linear regression analysis of the Bruker I.LISA and clinical measurements (in mg/dL) of total cholesterol (total CH) (A), HDL-cholesterol (HDL-CH) (B), Apolipoprotein A (Apo-A) (C) and Apolipoprotein B (Apo-B) (D) in a healthy sub-cohort of the Airwave study (n=588) showing the accuracy of the Bruker methodology by comparison with the clinical data (ultracentrifugation).
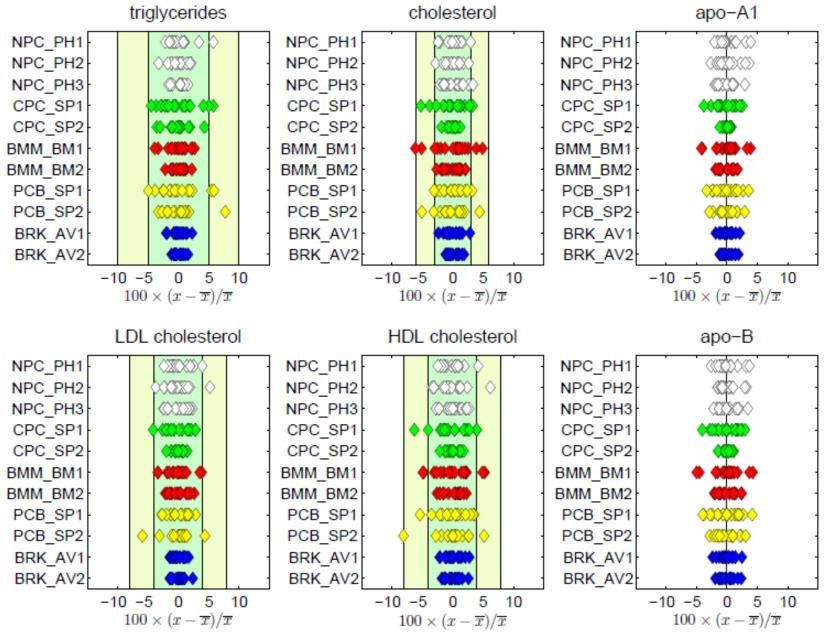
Intra-institution reproducibility of lipoprotein concentrations

                                                   Intra-institution reproducibility
                                                   of quantified lipoprotein
                                                   concentrations: Regression curve
                                                   where the mean value of each
                                                   lipoprotein subclass, calculated
                                                   for the different acquisitions of
                                                   each institution QCs (2 replicate
                                                   samples from the QC pool made
                                                   up daily for 10 days for each of
                                                   11 instruments), is plotted
                                                   against the values obtained for
                                                   each of the 105 lipoprotein
                                                   parameters in each of the
                                                   measurements (R2=1, RMSE=0.8
                                                   mg/dL).
Institution-specific QC means in mg/dl: Instrument-specific variability for lipoprotein
quantification for six selected parameters. Each plot represents the standard deviation values
for the main lipoprotein parameters obtained for each of the QC samples obtained daily.
Green shaded regions represent percentage of variation of the lipoprotein parameter
1xSTD% (dark green), 2xSTD% (light green)
KEY
NPC
National Phenome Centre
CPC
Clinical Phenome Centre
CSM
Imperial College academic
PBC
Phenome Centre Birmingham
BrukerIn-depth Analysis:
One Sample - 11 Spectrometers
Lipid Profiles
Apo-Protein Profiles
Particle NumbersInstitution-specific QC means in mg/dl for low molecular weight c) molecules
Application of B.I.LISA quantification method to establish longitudinal changes in
 plasma lipoproteins in a cohort of ‘healthy’ pregnant women.

PCA scores, KODAMA (KNN classifier) and PLS scores plots of plasma 1H -NMR data, collected
longitudinally at late-1st (in blue), early-2nd T (in yellow) and mid-2nd (in grey) trimester (a-b-c). Mean 1H-
NMR plasma spectrum of the early pregnancy journey (12-21 g.w.) showing positive (red) and negative
(green) metabolic correlations with advanced gestational age (d).
➢ Since lipid metabolism showed the largest gestation-associated variation,
  additional lipoproteins subfraction distribution analysis was carried using the
  proprietary Bruker B.I.-LISA (Bruker IVDr Lipoprotein Subclass Analysis) platform
  which decomposes each standard 1D spectrum, collected from all plasma samples,
  to 105 lipoprotein subfractions.

➢ Univariate statistical data analysis performed in R showed that 95 lipoprotein
  subfractions, out of the 105 (i.e., 90.4%), significantly changed from 1st to 3rd
  trimester reinforcing the pregnancy-related shift in lipid metabolism during a
  healthy uncomplicated pregnancy journey.

➢ Of the 95 significantly changing lipoprotein subfractions, the top 38 were selected
  to build a model for prediction of stage of pregnancy. These models of ‘normal’
  pregnancy profiles were later used to predict preterm birth.
Process for building quantitative diagnostic
Name Matrix Analyte FDR Median A Median C Fold change (A/C) Partial list of lipoprotein
subfractions and their
L1TG LDL-1 Triglycerides 1.55152E-32 6.411739498 10.229517 -0.673950311
L1AB LDL-1 Apo-B 1.72876E-28 7.545602839 11.88636651 -0.6555997
statistical significance
L1PL LDL-1 Phospholipids 4.39869E-28 9.812772425 15.30592089 -0.641357141
characteristics (FDR, base-2
H1TG HDL-1 Triglycerides 7.0213E-25 9.919108954 13.60292274 -0.455634232
LDTG LDL Triglycerides 7.21554E-25 25.9665034 34.16169926 -0.395727982 log change) identified via
HDTG
TPCH
HDL
Total Plasma
Triglycerides
Cholesterol
6.75311E-23
1.87101E-19
22.25063647
228.5560812
28.06827196
271.1508109
-0.335093642
-0.24654728
logistic regression analysis as
TPAB Total Plasma Apo-B 4.9906E-19 76.35389967 95.83244215 -0.327812292 the strongest biomarkers to
V4PL VLDL-4 Phospholipids 1.47539E-18 4.579973459 6.658487168 -0.539855191
VLAB VLDL Apo-B 9.50076E-18 5.342830648 7.874982146 -0.559672364
discriminate the late 1st vs
TPTG Total Plasma Triglycerides 4.34084E-17 135.2469929 182.2074504 -0.429985434
mid-2nd trimester of normal
V2CH VLDL-2 Cholesterol 1.67619E-16 2.138461777 3.494487036 -0.708507274
H4TG HDL-4 Triglycerides 6.39443E-16 4.050716646 5.050992188 -0.318389641 uncomplicated gestation.
IDTG IDL Triglycerides 6.54167E-15 9.433530633 15.73172294 -0.737806957
V4TG VLDL-4 Triglycerides 2.93509E-14 9.130169958 12.40547762 -0.44226366
L3AB LDL-3 Apo-B 3.9324E-14 12.40875637 14.14174898 -0.188602023
L2AB LDL-2 Apo-B 1.12046E-13 10.50597212 12.00451733 0.06 -0.192367736
12+0-14+6 weeks
LDAB LDL Apo-B 1.93331E-13 62.04603274 73.8368698 -0.251002427
12+0-14+6 weeks
V1CH VLDL-1 Cholesterol 7.09752E-13 4.121354859 6.209635524 -0.591389903
0.04
H1PL HDL-1 Phospholipids 7.95279E-12 48.23686067 59.78681649 -0.309691375
V3CH VLDL-3 Cholesterol 1.1891E-11 2.607284617 4.188415431 -0.683856465
0.02
LDFC LDL Free Cholesterol 3.91015E-11 41.19125416 48.81001246 -0.244839067
+0
15 -17+6 weeks
V2PL VLDL-2 Phospholipids 1.85344E-10 2.383710451 3.3888209 15+0-17+6 weeks -0.507574389
Term
LDCH LDL Cholesterol 2.76937E-10 130.9105873 149.0523921 0 -0.187237751
V6CH VLDL-6 Cholesterol 7.06498E-09 0.174094631
-0.06
0.186424964
-0.04 -0.02 0 0.02
-0.098723352
0.04 0.06 0.08 0.1 0.12 0.14 Preterm
HDFC HDL Free Cholesterol 2.82915E-08 25.17179536 27.37825409 -0.12122233
-0.02
HDPL HDL Phospholipids 4.76328E-08 116.197352 125.1076657 -0.106592998
H1FC HDL-1 Free Cholesterol 8.21366E-08 10.86516142 12.80709129 -0.237233244
-0.04
V5PL VLDL-5 Phospholipids 2.25076E-07 1.591446757 2.079106324 -0.385624647
+0 +6 19+0 -21+6 weeks
19 -21 weeks
H3A2 HDL-3 Apo-A2 3.20507E-07 7.876211576 6.874186457 0.196312882
V6TG VLDL-6 Triglycerides 5.58628E-07 2.873218051 3.26932015
-0.06 -0.186323176
L6PL LDL-6 Phospholipids 3.08271E-06 15.83420671 18.27893021 -0.207137047
L5CH LDL-5 Cholesterol 3.42224E-06 15.71871033 18.2826374 -0.217991351
L2CH LDL-2 Cholesterol 0.000234073 23.01711364 Use diagnostic to predict term vs preterm birth
26.1872662 -0.186158529
L3CH LDL-3 Cholesterol 0.001328901 19.28368122 21.32140492 -0.144922019
HDA2 HDL Apo-A2 0.006745372 37.52937025 36.28607196 0.048604191
L4FC LDL-4 Free Cholesterol 0.025469886 6.971512971 7.42305726 -0.090541711
H4A2 HDL-4 Apo-A2 0.03838242 15.56741207 15.001663 0.053406692Quantification method for urine samples
Comparison of creatinine concentrations for 2 independent peak fitting methods
Normal Range:
Method A: 1.2 – 17.5 mM
Method B: 1.5 – 20.3 mM
Identify outliers
Red point colour indicates acceptable analytical correspondence
Creatinine (n=7,579) (distance point to linear model fit < 30% of mean)
Colour: distance to linear model fit cyan square defines reference ranges in either method,
using only corresponding concentration (red dots)Selection of ‘good’ and ‘bad’ metabolites based on correlation between the 2 methods. Total shared = 48, Bruker = 150+, in-house = 76
Comparison of quantified metabolites versus untargeted profiling
     method for sex differentiation.

            Subset of top reliably fitted compounds (n=17)                           HR 1H NMR profiles
                                                                       torth,cv: noise level after PQN normalization
Insets: Kernel density estimates (KDE) of tpred,cv class memberships
Comparison of quantified metabolites versus profiles for age
differentiation
Cliff’s d P value
F: (40-60] vs (60-100] -0.25 3.1 x 10⁻¹³
M: (40-60] vs (60-100] -0.10 1.2 x 10⁻³
Gender (F vs M) -0.58 4.9 x 10-37
Top reliably fitted compounds (n=17) Lactic acid as an examples of an age-dependent
metabolite that changes in females but not in males
Inset: Kernel density estimates (KDE) of tpred,cv class memberships, Cliff’s d = effect size estimate (max range = -1 to 1)Metabolite-specific behaviour with age
weak effect Age and gender effect
Cliff’s d P value
Cliff’s d P value F: all ages (young vs old) 0.22 1.9 x 10⁻¹¹
F: (40-60] vs (60-100] -0.20 4 x 10-12
M: (40-60] vs (60-100] -0.15 4.1 x 10⁻⁸ M: all ages (young vs old) 0.22 1.4 x 10⁻¹³
Gender (F vs M) -0.02 0.04 Gender (F vs M) -0.33 3.9 x 10⁻³⁴
Cliff’s d = effect size estimate (max range = -1 to 1)Summary ➢ Accurate quantification of lipoproteins and small molecules in plasma and serum is possible using the B.I.LISA fitting method. ➢ Quantified plasma metabolites can be used to form biomarker panels for prediction of physiological and pathological states. ➢ This is suited to high throughput profiling and provides an easy set of data for clinicians to interpret ➢ We have shown significant changes in lipoprotein profiles thoughout healthy pregnancy and have further shown that the model for this ‘healthy’ trajectory can be used to indicate risk of preterm birth. ➢ The Bruker quantification method for urinary metabolites is consistent with other peak fitting methods for ascertaining metabolite concentrations and can be conducted for a range of metabolites. ➢ We have used this method to establish normal ranges of physiological variation for a range of metabolites stratified by age and gender.
Acknowledgements
➢ Dr Beatriz Jimenez (Imperial College London) for development of ring trial and
  provision of slides.
➢ Prof Mark Viant and Dr. Wawrick Dunn (University of Birmingham), Dr Manfred
  Spraul and Hartmut Schaefer (Bruker Biospin) for design of methods and design of
  ring trial.
➢ Prof Jeremy Nicholson and Prof John Lindon for design of ring trial and data
  interpretation

➢ Dr Torben Kimhofer and Dr Joram Posma for design of urine range quantification
  experiment
➢ Dr Manfred Spraul and Hartmut Schaefer (Bruker Biospin) and Dr Joram Posma for
  provision of urinary quantification method

➢ Prof. Philip Bennet and Dr. David MacIntyre for design of pregnancy study and
  collection of samples.
➢ Dr Nancy Georgakopoulu for analysis of longitudinal pregnancy samples

➢ Dr Matthew Lewis and the MRC-NIHR Phenome Centre team for analyisis of
  samples and provision of slides relating to the Phenome centre.
You can also read