Incorporating CCS values to enable 4-dimensional annotation of metabolic features - Bruker
←
→
Page content transcription
If your browser does not render page correctly, please read the page content below
Incorporating CCS values to enable 4-dimensional
annotation of metabolic features
Reliable annotation of metabolites for LC-MS/MS based data requires the adept
combination of many parameters. To extend our parameter portfolio we analyzed
trapped ion mobility spectrometry (TIMS) data.

Introduction                                             Experimental                                             NovaMT sample: Hydrophilized                   Keywords:
                                                                                                                                                                 Metabolomics, PASEF,
                                                                                                                  urine (www.novaMT.com, TRX-                    ion mobility, CCS, anno-
                                                                                                                                                                 tation, MetaboScape,
We investigated the reprodu-                             Sample preparation                                       3178-R) was dissolved in 200 µl                Metabolic phenotyping
cibility of CCS values for intra-                                                                                 LC-MS grade water, vortexed and
and inter-lab measurements.                              Urine (Bremen): A sample was                             centrifugated (20817 g for 15 min
Furthermore, we compared the                             collected from a volunteer.                              at 4°C). After adding 250 µl
measured CCS values to those                             The sample was centrifugated                             methanol the sample was
from literature, and we applied                          (20817 g for 10 min at 4°C) and                          vortexed     and    centrifugated
these to a sample comparison.                            filtered (0.22 µm sterile syringe                        (20817 g for 5 min at 4°C). 600 µl
From the present results, we                             filters with MCE membrane                                LC solvent A was added to the
conclude that CCS values serve                           SLGS033SS from EMD Millipore).                           supernatant.
as an excellent additional filter for
metabolite annotation.

Authors: Ulrike Schweiger-Hufnagel 1, Matthias Szesny 1, Aiko Barsch 1, Melvin Gay 2, Torben Kimhofer 3, Joel Gummer 3, Luke Whiley 3, Jeremy Nicholson 3;
         1
           Bruker Daltonik GmbH, Bremen, Germany; 2 Bruker Pty. LTD., Australia, Preston, Australia; 3 Australian National Phenome Centre, Murdoch University,
         Perth, Australia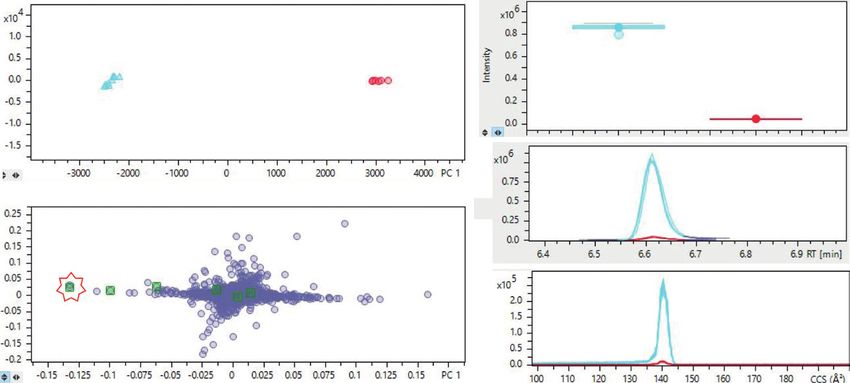
Retention time standard (TRX-2101,        Table 1: LC-TIMS-MS conditions

NovaMT) prepared according to
protocol from NovaMT.
                                             MS                       timsTOF Pro

Data acquisition
                                             Source                   Apollo II ESI source

see Table 1                                                           ESI(+), 4500 V Capillary Voltage
                                             Ionization
                                                                      ESI(-), 4200 V Capillary Voltage

Data processing                              Scan range               20–1000 m/z

                                                                      Internal mass calibration through automation, sodium formate,
Data        were      processed      in      Calibration
                                                                      Mobility calibration before sequence using Agilent Tunemix
MetaboScape 2021 (preliminary
                ®

                                             PASEF                    Collison energy 20/50 eV
version), resulting in a table of
features, so called buckets. An Analyte
list was created combining the               LC                       Elute UHPLC (in Bremen), Waters I-Class (in Perth/AU)
retention times from the T-ReX
                                                                      LC column kit "T-ReX Elute M-column kit: RP", containing Bruker
LC-QTOF solution (https://www.
                                             Column                   Intensity Solo 2 C18, 2.1 x 100 mm and Waters Acquity UPLC BEH C18,
bruker.com/products/mass-spec -                                       1.7 µl Van Guard Pre-column 2.1 x 5 mm
trometry-and-separations/ms-soft-
ware/metabolomics - solution.                Column Oven Temp.        35°C
html), CCS values from the Uni-                                       A: water with 0.1 % formic acid
                                             Mobile phases
fied CCS Compendium (https://                                         B: acetonitrile with 0.1 % formic acid
mcleanresearchgroup.shinyapps.io/                                     Wash 1: Solvent A
                                             Wash solvents
CCS-Compendium/) and fragment                                         Wash 2: acetonitrile / methanol/ water (1:1:1)
spectra from the Bruker HMDB                 Gradient                 0 min 1% B, 0.25 mL/min
Metabolite Library 2.0 and the Bruker                                 2 min 1% B, 0.25 mL/min
MetaboBASE® Personal Library 3.0                                      17 min 99 % B, 0.25 mL/min
                                                                      20 min 99 % B, 0.25 mL/min
(https://www.bruker.com/products/
                                                                      20.1 min 1 % B, 0.35 mL/min
mass-spectrometry-and-separations/                                    22 min 1 % B, 0.35 mL/min
ms-software/metabolomics-spec-                                        28 min 1 % B, 0.35 mL/min
tral - libraries/over view.html). For                                 28.1 min 1 % B, 0.25 mL/min
each system the retention times                                       30 min 1 % B, 0.25 mL/min

were checked and corrected using
                                             Injection volume         2 µl
a retention time standard. Using
MetaboScape, features in the bucket
table were putatively annotated
based on an Analyte List of known
compounds. For this annotation 5
criteria were considered: precursor                                                          E           C
mass accuracy, retention time accu-
racy, isotopic pattern of the precursor
(mSigma), MS/MS score and
accuracy of the CCS value.                         B

Statistical analysis (PCA and t-test)
                                                                  D
was performed in MetaboScape.
                                                                                                 A
For pathway mapping the Caffeine
and      Theobromine     metabolism
pathway (https://www.wikipathways.
org/index.php/Pathway:WP3633)             Figure 1: Annotation of paraxanthine. A Narrow and wide filters set for annotation. B Bucket table
was imported in MetaboScape to            entry for paraxanthine. C Visualisation of AQ scoring. D TIMS cleaned MS spectra for precursor
                                          m/z 181.072. E PASEF-MS/MS spectrum in comparison to Spectral Library spectrum.
illustrate differences in the urine
samples.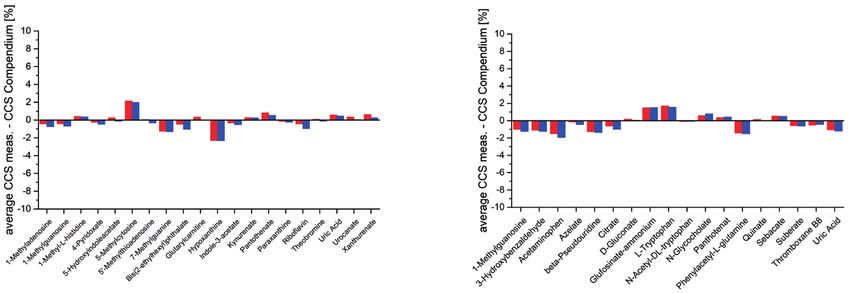
Results                                              the Compendium are now available              be removed. For example as shown for
                                                     for compounds searched for in                 paraxanthine, a bucket table results
Investigation of CCS values                          PubMed and show good correlation              all information in detail (Figure 1 B),
                                                     with those observed using TIMS.               e.g. ΔCCS is 0.8%, and Δm/z is
Data from one urine sample (NovaMT)                                                                -0.242 mDa, for which both is excel-
was acquired on two timsTOF Pro                      Annotation confidence is indicated            lent and is represented by two green
instruments in Perth (ANPC, Australia)               in the Annotation Quality symbol              bars in the AQ symbol. The quality of
and Bremen (Bruker, Germany). These                  (Figure 1). Each feature in the bucket        isotopic pattern of the precursor mass
type of MS instruments combine                       table is categorized by applying              – compared to a theoretical pattern
advantages like high mass accuracy,                  criteria to measure the deviation             obtained for the resulting molecular
sensitivity, dynamic range and mobility              in m/z, retention time, isotopic fit          formula and calculated as mSigma
separation, and are thus highly suit-                (calculated as mSigma), MS/MS                 value – is also used. mSigma scores
able for this workflow. At both places,              score and CCS as compared with                of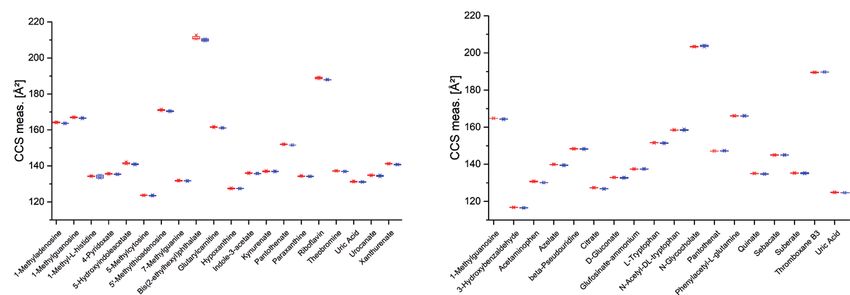
for positive mode and 0.15 % for                      For all analyzed metabolites the                    CCS is a highly valuable characteristic
negative mode. The absolute value                     deviations are < 2%.                                for the annotation of the features.
for the difference in average CCS                                                                         The availability of CCS values makes
value is positive in most cases                       CCS values were compared to                         this a more desired attribute to
(Figure 3), which might arise from                    retention times in respect of usabi-                characterize metabolites with more
slightly different mobility calibration.              lity for use as filter for metabolite               confidence.
                                                      annotation. One disadvantage of
Comparison to reference CCS values                    retention times is the low transfer-                Comparing urine samples
                                                      ability from one system to the other.
The measured CCS values were                          When acquiring data in Perth and                    The NovaMT and Bremen urine
similar to the publicly available values              in Bremen, no additional effort was                 samples were investigated, and the
from the Unified CCS Compen-                          required for the comparison CCS                     Scores plot shows clear differences
dium as shown in Figure 4. Here,                      values. Calibration of CCS was applied              (Figure 5). The differences mainly arise
average differences between the                       automatically     in    MetaboScape,                from caffeine and other xanthines and
measured and Compendium CCS                           whereas retention times had to be                   are highlighted. For caffeine, the Box
value were plotted vs. the metabo-                    adapted to accommodate different LC                 plot, the Extracted Ion chromatogram
lites for positive and negative mode                  methods. We also observed that the                  and the Mobilogram clearly indicate
data from Perth and Bremen. Small                     average CV for CCS values (0.11 %)                  a big difference in intensity between
Average |∆CCS [%]| were determined:                   was better than for retention times                 the two urine samples.
                                                      (0.25 %), as determined for positive
                                                      mode data.                                          Caffeine and Theobromine pathway
   Polarity/ lab       Perth       Bremen

   positive            0.94          0.93             The high stability of CCS values                    For relative quantitative analysis,
   negative            0.88          0.79
                                                      shows its advantage compared to                     a t-test was performed to confirm
                                                      retention time, demonstrating that                  suitable low CV values for all samples
                                                                                                          (Table 2). In Figure 6 we illustrate how
                                                                                                          two urine samples (NovaMT, Bremen)
                Positive mode                                        Negative mode                        differ in respect of xanthines (with
                                                                                                          0, 1, 2, and 3 methyl groups) in the
                                                                                                          Caffeine and Theobromine Pathway.
                                                                                                          To show the reliability of the anno-
                                                                                                          tation, the AQ symbols for the
                                                                                                          investigated metabolites are shown
                                                                                                          in the Figure. While the amount of
                                                                                                          xanthine, 1- and 7-methylxanthine
                                                                                                          are mostly comparable, the amounts
                                         Perth      Bremen
                                                                                                          for theobromine and caffeine and
Figure 4: Differences between CCS values determined in Perth/ Bremen and CCS Compendium.                  paraxanthine differ strongly by
                                                                                                          factors 5, 9 and 20 respectively
                                                                                                          (Table 1). This difference for theo-
       Scores plot                                                                         Box plot       bromine, caffeine and paraxanthine
                                                                                                          in the Bremen sample clearly
                                                                                                          indicates consumption of coffee
                                                                                                          by the proband, which has not
                                                                                                EIC       completely been degraded. In
                                                                                                          NovaMT urine, a smaller amount of
       Loadings plot                                                                                      caffeine was also detected (Figure
                                                                                                          6 D and E). We further see that
                                                                                      Mobilogram
                                                                                                          in NovaMT urine the amount of
       Caffeine
                                                                                                          xanthine, a later degradation product
                                                                                                          of caffeine, is slightly higher than
                                                                                                          in the Bremen sample. This might
Figure 5: Comparison of two urine samples, eight technical replicates each. PCA results with Scores       result from sampling at a later stage
and Loadings plot (left). The metabolites investigated in Figure 6 are highlighted. Box Plot, Extracted
                                                                                                          of coffee consumption.
Ion Chromatogram (EIC), and Mobilogram for caffeine (right). Red NovaMT, turquoise Bremen sample.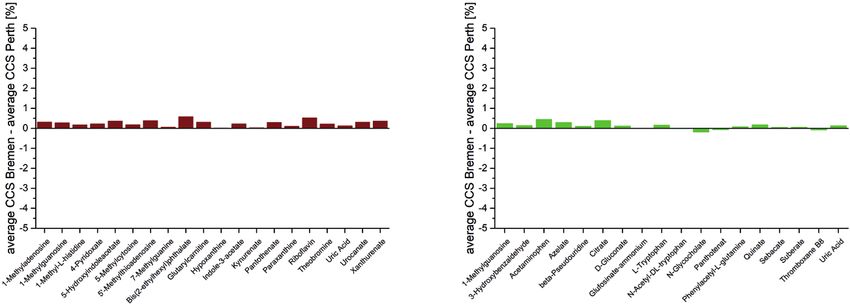
Table 2: Fold changes and CV values for metabolites shown in Figure 6.

   Name                  Position        p-value     Fold change CV NovaMT CV Bremen
                       methyl group                NovaMT/Bremen     [%]      [%]

   Xanthine                 none        9.05E-03           1.4              11.6        11.6

   1-Methylxanthine           1         2.00E-06          -1.6               10         10.3

   7-Methylxanthine           7         1.20E-04           1.5               9.1        14.8

   Paraxanthine             1, 7        < 1E-08           -9.1               9.3         5.1

   Theobromine              3, 7        < 1E-08           -4.6               5.5         10

   Caffeine                1, 3, 7      < 1E-08           -19.6              5.9         3.3

   A                                                                                                   B     3.0
                                                                                                                                O
                             paraxanthine              1-methylxanthine                                                                   H
                                                                                                                         HN               N
                                                                                                               0

                                                                         7-methylxanthine                              O        N         N
                                                                                                                                H
                                                                                                            -3.0

    theobromine                   caffeine
                                                            xanthine               Purine metabolism

Figure 6: Caffeine and Theobromine pathway, presented in a reduced form. Only xanthines are shown, which have been annotated with a high degree of
confidence, represented by the Annotation Quality symbol. Two urine samples were compared “Bremen” and “NovaMT”. The color coding of the metabolite
name boxes indicates different intensities. Red color for higher intensity in the “Bremen” sample, green for the “NovaMT” sample A . B shows the
structure of xanthine and the positions for potential methyl groups.

                                                         Conclusion
                                                         For Metabolomics the reliable annotation of features is essential. In the
                                                         current approach we demonstrated how ion mobility can support this:
                                                         • CCS values from the timsTOF Pro instruments show high intra-lab
                                                           reproducibility for CCS values with a standard deviation < 0.4 Å 2,
                                                           low inter-lab differences in measured CCS values < 0.3%, and high
                                                           accordance of measured CCS values to those from Unified CCS
                                                           Compendium with an average | ∆CCS [%] | < 1%. This allows to use
                                                           CCS values as filter for 4D annotation – in addition to retention time,
                                                           precursor mass, isotopic pattern and MS/MS spectrum.
                                                         • PASEF spectra benefit from ion mobility separation, since cleaner
                                                           MS/MS spectra are obtained using an on-the-fly mobility filter. This
                                                           improves ID in small molecule workflows.
                                                         • The application of using CCS values was shown for pathway
                                                           mapping of metabolites of the Caffeine and Theobromine
                                                           metabolism.
Learn More
You are looking for further Information?
Check out the link or scan the QR code for more details.
www.bruker.com/timstofpro
to change specifications without notice. © Bruker Daltonics 06-2020, LCMS-171, 1878002
Bruker Daltonics is continually improving its products and reserves the right
For Research Use Only. Not for Use in Clinical Diagnostic Procedures.
Bruker Daltonik GmbH Bruker Scientific LLC
Bremen · Germany Billerica, MA · USA
Phone +49 (0)421-2205-0 Phone +1 (978) 663-3660
ms.sales.bdal@bruker.com – www.bruker.comYou can also read