The economic effects of coronavirus in the UK - Resolution ...
←
→
Page content transcription
If your browser does not render page correctly, please read the page content below
S P OT L I G H T

The economic effects of coronavirus in the UK
Utilising timely economic indicators
17 April 2019
Jack Leslie

   This is the fourth edition of our roundup of timely indicators of the impact of
   coronavirus which aims to plug the gap left by traditional measures of economic
   activity which are not timely enough to capture these effects. This analysis will be
   updated weekly, as new data becomes available.

   It has become increasingly clear that the scale of the economic effects of coronavirus
   look set to be huge with indicators suggesting: a sizeable minority of the workforce is
   no longer working, leading to falling incomes; welfare claims have surged; job vacancies
   have collapsed; and the majority of businesses have either closed or face falling
   turnover. But job losses may no longer be increasing. The economic shock has not hit
   all sectors evenly: consumer spending has fallen much faster for some businesses than
   others. The Government is borrowing unprecedented sums to combat the economic
   crisis but there is still no sign that financial markets are unable to digest the increase in
   supply.

   This article covers the labour market, general economic activity, trade and the
   Government’s fiscal position.

The labour market

The scale of the damage to the labour market has become much clearer in the past week:
data show that the reduction in employment is huge and unprecedented, but may not be
increasing further. The number of new Universal Credit (UC) claimants has reached 1.4
million since the crisis started. The number of new applicants fell to 220,000 in the most
recent week, down from its peak of 540,000 in the final week of March This is, however, still
more than twice as bad as the worst of the financial crisis (Figure 1).
More encouraging is timelier data based on the frequency of web searches for
unemployment related terms which has closely matched the path of UC claims in recent
weeks. Web searches have now fallen back to close to levels seen on average during 2019
(Figure 2). This suggests new UC claimants will fall again next week. However, this data is
unlikely to be capturing the majority of the people who have stopped work as their employer
makes use of the Government coronavirus job retention scheme (JRS).

                                                                                                   1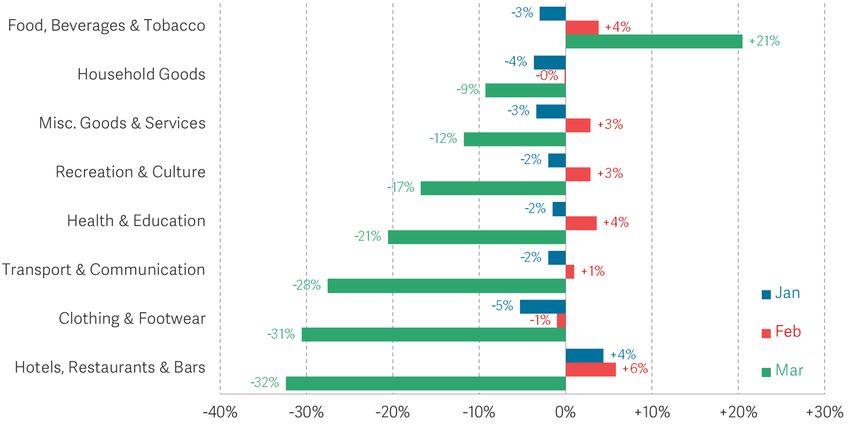
S P OT L I G H T

Figure 1           Universal credit claims remain elevated
                   Weekly new claims to Jobseeker’s Allowance and Universal Credit: GB

                    Notes: Universal Credit and Jobseeker’s Allowance not directly comparable, because UC includes other new claims.
                    UC figures are not seasonally adjusted. JSA figures have been adjusted to be weekly.
                    Source: ONS, Nomis; DWP, Stat Xplore; Work and Pensions Select Committee hearing (25 March 2020).

Figure 2           Unemployment levels may no longer be increasing
                   Web search frequency for a group of unemployment-related terms by week, standard
                   deviations away from average: UK, 2019-2020

                    Notes: Terms include: "job seekers allowance", "JSA", "universal credit" and "unemployment benefit". The financial
                    crisis peak was in July 2009 – the data is normalised from the start of 2007 until the end of 2009 based on the search
                    terms "job seekers allowance", "JSA", and "unemployment benefit".
                    Source: RF analysis of Google Trends.

                                                                                                                                             2
S P OT L I G H T
The latest ONS data suggest that only 52 per cent of workers are currently working (Figure 3)
but that just 0.4 per cent of staff at businesses which are still operating have been made
redundant. This is consistent with unemployment rises being limited by the widespread use
of the JRS as at least 16 per cent of workers were reported as furloughed (with some workers
at temporarily closed firms likely to have been furloughed too). A British Chambers of
Commerce survey has estimated that 66 per cent of businesses have made use of the
furlough scheme.
For these survey results to be consistent with the large rise in UC claimants, it is likely that a
much higher proportion of those working at temporarily closed firms have been made
redundant compared to those working at firms still operating. This raises a risk that, the
longer the crisis continues, the more firms may close and their workers become
unemployed. As discussed in our recent work, policies to keep firms open and operating
safely would reduce this risk. The fact that the labour market crisis has been driven primarily
by people leaving their jobs, rather than a slower decline driven by businesses reducing the
pace of job hiring, presents a unique challenge for Government policy and needs to be taken
into account.
Figure 3 Only half of workers are currently working
Proportion of businesses reporting changes to activity and changes to employment:
UK, 23 Mar - 5 Apr
Notes: Sample may underestimate firm closure as it only includes responding businesses. Closed firms did not
provide responses on the labour market, workers could still be employed, furloughed or made redundant.
Source: RF analysis of ONS.
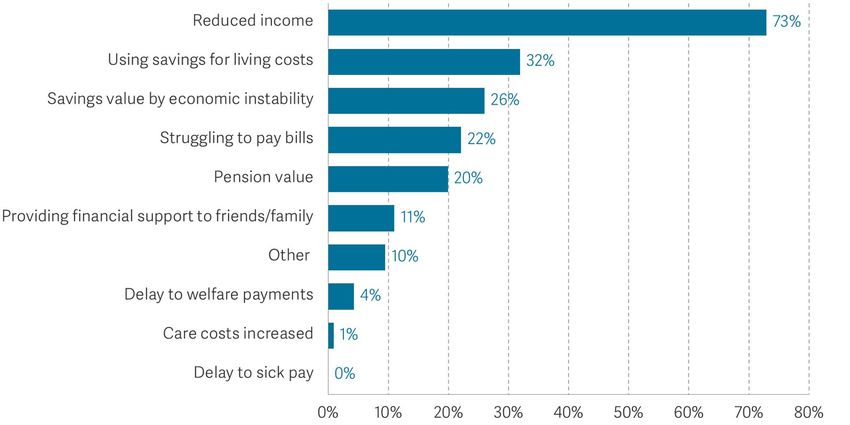
The deterioration in the labour market is affecting household’s finances. As Figure 4 shows,
73 per cent of households have reported falls in income. This is likely to be driven by falls in
employment, and ONS data suggesting 29 per cent of firms reducing working hours. This has
resulted in 32 per cent now using savings to cover living costs, something which is more
3S P OT L I G H T
likely to be an option for better off families; in 2018, more than half of families on low-to-
middle incomes reported having no savings at all. This shows up in the fifth of households
reporting difficulty in paying their bills.
Only four per cent of households reported their finances being affected by delays to welfare
payments; this is encouraging given the huge number of claims the Government has had to
process since the crisis started.
Figure 4 A large majority of households have faced a fall in income
Proportion of household’s reporting finances being affected by the following: GB, 27
Mar – 6 Apr
Source: ONS.
Sectoral impact
Not all sectors of the economy are equally affected. The restrictions on social interactions
are limiting some firms’ ability to operate while households are rebalancing consumption
between different sectors, partially as a result of the decline in income. Figure 5 shows that
the hospitality, clothing, and transport sectors were hardest hit in March; spending fell by
close to a third across these sectors. In contrast, spending rose by around 21 per cent in the
retail food sector, likely as a result of some households purchasing more in response to the
lockdown.
The differential supply and demand effects across sectors have resulted in different
proportions of firms laying off staff. The latest data from the ONS, shows that, while on
average almost 30 per cent of businesses have responded to the economic crisis by laying
off at least some workers in the short term, over half of businesses in the accommodation
and food services industry are laying off workers.
4S P OT L I G H T
Figure 5 Hospitality and some retail sectors are facing larger falls in turnover
Annual growth in Visa’s Consumer Spending Index by sector: UK, 2020
Source: IHS Markit and Visa.
This is backed up by evidence on the fall in vacancies available in different sectors. The jobs
website ‘Indeed’ have published data showing that vacancies have fallen by around 70 per
cent in the food preparation and service, hospitality, tourism, and beauty sectors. And a
report from KPMG and the Recruitment and Employment Confederation shows that
vacancies are falling substantially across retail, hotels, catering, and construction. The worst
affected industries and sectors tend to also be those with the lowest average wages,
substantially increasing the hardship some families will experience as they are less likely to
have savings to cushion income falls.
Trade
Weekly data on shipping volumes are starting to show small falls in the number of visits to
UK ports (Figure 6). However, these data are likely to lag the underlying economic effects for
those ships which started their journeys prior to the crisis starting in Europe. Flight traffic,
which may be more responsive has fallen 92 per cent compared to a year ago in the UK. The
World Trade Organisation has estimated that global trade is likely to fall between 13 and 32
per cent – larger than the falls during the financial crisis where world trade fell by 12 per cent
from peak to trough. Reductions in global trade would typically be accompanied by slower
productivity growth which could limit the ability of the economy to rebound quickly.
5S P OT L I G H T
Figure 6 A significant impact on shipping trade is yet to be seen
Shipping traffic into UK ports
Source: ONS.
Fiscal impacts
The fall in economic activity together with the rise in unemployment and the package of
stimulus measures will substantially reduce the Government’s tax revenue and increase
spending commitments. It is unclear at this stage how much extra the Government will need
to borrow (though it could reach as high as 38 per cent of GDP this year if social distancing
measures are in place over the course of a year). The Debt Management Office has set out
its planned debt issuance for April and, as Figure 7 shows, this will be higher than any single
month during the financial crisis. The Government is clearly mindful of the challenge in
ensuring adequate financing during this period and is extending the use of the existing Ways
and Means facility – effectively the Government’s overdraft with the Bank of England – as it
did during the financial crisis.
From a market perspective, the results of recent gilt auctions are encouraging, with high
demand for Government debt. As Figure 8 shows, the cover ratios (the ratio of financial
market bids for bonds to the amount of debt issued) have averaged above two since early
March. And another metric of auction success, the yield tail (a measure of the range of bid
prices where a larger spread indicates weaker demand), have remained low and fallen since
late-March. But there will be a lot of supply for the market to absorb in the coming weeks
and months, so we will continue to monitor developments here as a potential first sign of
worries about debt sustainability.
6S P OT L I G H T
Figure 7 The Government intends to issue an unprecedented amount of debt
Real gilt issuance by the Debt Management Office, outturns and forecast
Notes: Figures show total issuance at operations in cash. Figures are adjusted into 2020-21 prices using the GDP
deflator based on the most recent data from the Office for Budget Responsibility. The April 2020 forecast is based on
the expected issuance this month.
Source: RF analysis of Debt Management Office.
Figure 8 Financial markets have maintained high demand for government debt
Bid to cover ratio and yield tail at Debt Management Office gilt auctions
Source: DMO; Worldometer.
7You can also read