Arena Hospitality Group - PRESENTATION OF FY 2018 AUDITED RESULTS
←
→
Page content transcription
If your browser does not render page correctly, please read the page content below
Arena Hospitality Group
PRESENTATION OF FY 2018 AUDITED RESULTS

March 4th, 2019
DISCLAIMER

     This document and the oral presentation do not constitute an offer of securities or a solicitation of an offer to
     purchase or sell securities in any jurisdiction.

     The third party information contained herein and orally presented has been obtained from sources the Company
     believes to be reliable.

     While reasonable care has been taken to ensure the accuracy and completeness of information contained in this
     document and orally presented, the Company accepts no liability for the accuracy and completeness or use
     thereof, nor any liability for their update. Information contained in this document and orally presented should not
     be construed as giving of advice or making of recommendation and should not be relied on as the basis for any
     decision or action. In particular, actual results and developments may be materially different from any expressed
     forecast, forward-looking statement, opinion or expectation.

     This document includes non-IFRS financial measures, such as EBIT, EBITDA and EBITDAR. The Company uses
     such alternative performance measures to enhance the understanding of its operating results as well as the
     operating results of the Group. Other companies engaged in the hospitality sector may not calculate similarly
     named measures on a basis consistent with that used by the Company, so these measures may not be
     necessarily comparable. Accordingly, no undue reliance should be placed on any such measure contained in this
     document.

22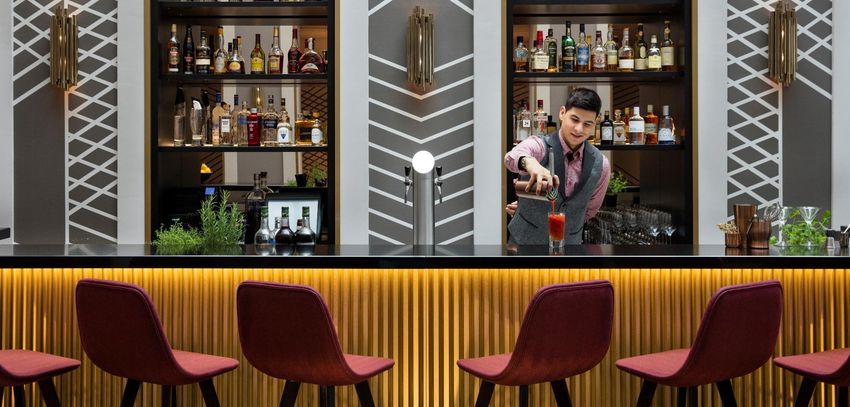
TODAY’S PRESENTERS

               Reli Slonim     Devansh
               CEO             Bakshi
                               Board Member

                Luka            Arnoud Duin
                Cvitan          General
                Strategy,       Manager
                capital         Germany &
                markets & IR    Hungary

33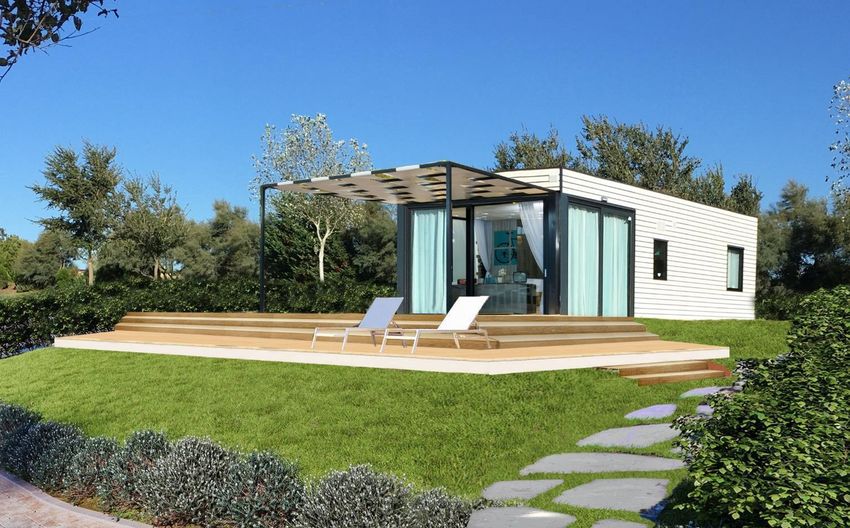
TODAY’S AGENDA

     I.   About us

     II. Highlights of FY 2018

     III. Financial and operating performance in FY 2018

     IV. Debt structure

     V. Future developments and growth

     VI. Appendix

44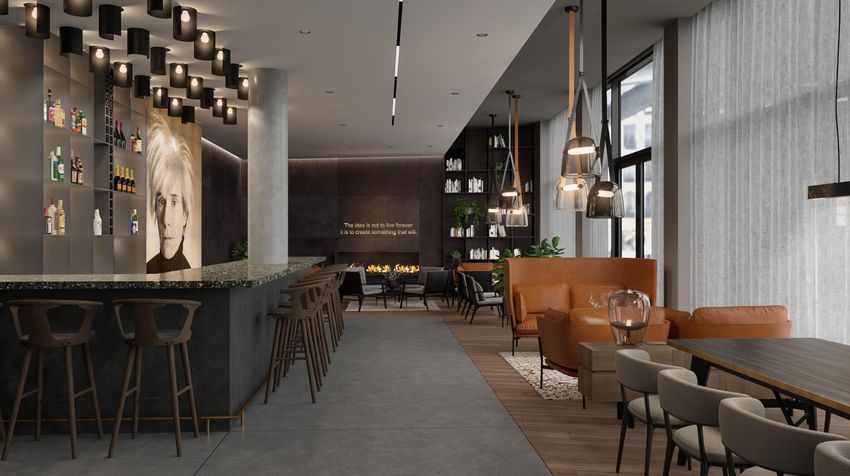
ARENA HOSPITALITY GROUP AT A GLANCE

                                                                                                              3           4                  26
                                                                                                           Countries    Brands    Properties in operation

                                                                                                      10.000+ 1.000+
                                                                                                           Accommodation units              Employees

                                                                                          Operations split

            Revenues breakdown                                                       EBITDA breakdown                            Units breakdown by Country1
                                                                                                5%
                                                                                                                                              4%

                  32%                                                                     23%                                     25%

                            68%                                                                      72%
                                                                                                                                                       71%

           Croatia      Germany&Hungary                                   Croatia    Germany&Hungary       Management             Croatia    Germany   Hungary

     1Including
            rooms in 50% JVs, excluding camps.
55   Company has additional 5,903 units in campsites, out of which 624 are mobile homes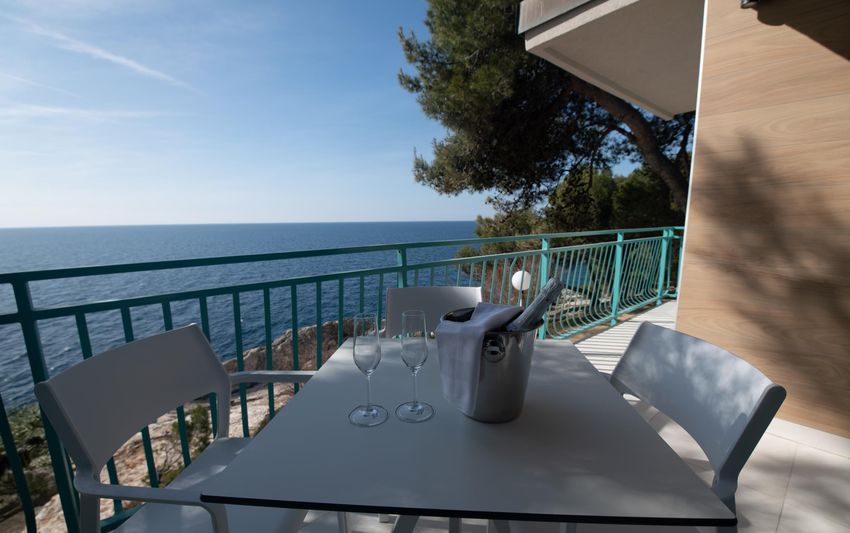
STRATEGY

                                                Capitalize on
            Upgrade                            Synergies with
            Existing                                 German
            Portfolio                             Operations
                               Capitalize on
                                 Growth
                               Potentials in
                                 the CEE
                                  region
            Expand Through                      Continuously
            Acquisitions and
            Other Types of
                                               Improve Guest
            Business Models                       Experience

66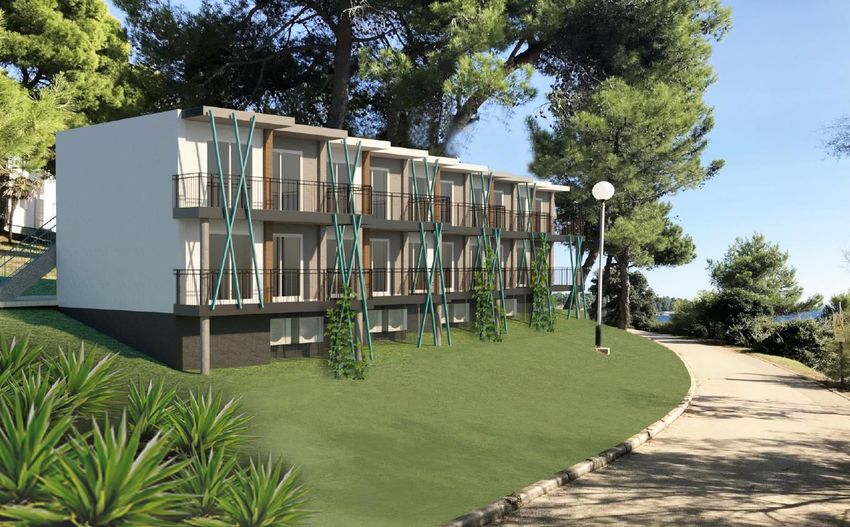
Highlights of FY 2018

77
2018 – HIGHLIGHTS

                                     • We launched our innovative new all glamping concept, pioneering in Croatia such an offering, which transformed
                                       an existing campsite into a luxury glamping experience for guests.

                                     • Trading in all Company’s shares migrated from the Official Market to the Prime Market of the Zagreb Stock
                                       Exchange

                                      • Continuation of the successful ramp-up of Park Plaza Nuremberg which recorded an EBITDA increase by 41.5%

                                      • Positive EBITDA in the first half testament to the diversity of our international operations and benefits of our 2017
                                        investments in high quality sporting facilities at Park Plaza Belvedere Medulin

                                                      Evolution of Key Financial and Operational Indicators
     HRKm                                                                              HRK

     800                                                  758                 40,0%
                              717                                                       700                                                               60%
     700                                                                                                                    53,2%         576
                                                                                        600                           560
                                                                                                                                                54,0%
     600             30,3%                29,7%
                                                                                        500       472
                                                                      28,3%   30,0%
     500    436                                                                                                                                           50%
                                                                                        400                 4…
     400                                                                                                                    298                 311
                                    251                         250                     300
     300                                                                                                  214
                                           213                         215    20,0%                                                                       40%
     200          141 132                                                               200

     100                                                                                100

       0                                                                      10,0%       0                                                               30%
                  2016              2017                        2018                                2016                2017                2018
88
            Total revenue    EBITDAR             EBITDA           EBITDA margin                         ADR (HRK)      RevPAR (HRK)         Occupancy
Financial and operating
     performance

99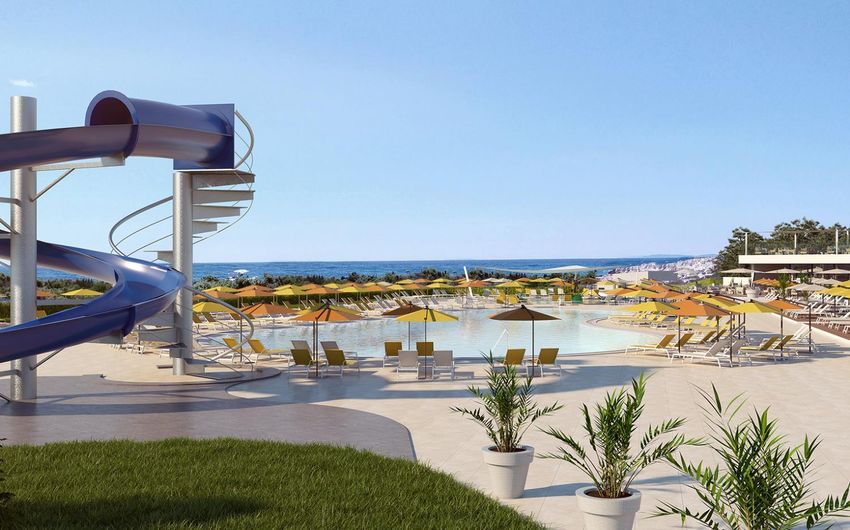
ARENA HOSPITALITY GROUP REVENUES AND EBITDA

                               Revenue evolution                                                                     EBITDA evolution
     HRKm                                                                       HRKm
                                                            1           758
     760                                                                        270
                                             15
     740
                                                                                250
                 717           24                                                                                (16)
     720
                                                                                230                    41
     700                                                                                                                      (6)                                                         215
                                                                                         213                                                  (5)              (5)
     680                                                                        210                                                                                          (10)
     660
                                                                                190
     640

     620                                                                        170

     600                                                                        150
              Revenues       Croatia    Germany and Managed and      Revenues

                                                                                         EBITDA 2017

                                                                                                       Revenue

                                                                                                                 Payroll

                                                                                                                           commissions, etc

                                                                                                                                              Administration

                                                                                                                                                               Maintenance

                                                                                                                                                                             Other OPEX

                                                                                                                                                                                          EBITDA 2018
                                                                                                                            Franchise fees,
                2017        revenues      Hungary    centralized       2018
                                         revenues     services

     •     Total revenue increased by 5.6% on top of the record breaking          •    Revenue growth contributed positively with HRK 41 million
           2017 season with year-on-year growth reported in all our
           segments; hotels, self-catering holiday apartment complexes            •    Payroll increased due to an overall increase in salaries but also
           and campsites                                                               due to an increase of # employees (48 employees more). As %
                                                                                       of total revenues this item increased by 210 bps
     •     In Croatia this growth was mainly due to a solid performance in
           the high season, underpinned by a strong performance in the            •    Other offsetting costs include Franchise fees, Administration
           shoulder season                                                             and Maintenance which grew as a result of sales growth but
                                                                                       also because some costs such as utilities and waste
     •     In Germany the growth was driven by Park Plaza Nuremberg                    management increased more due to new terms imposed by the
           although the other hotels had a respectable performance                     service providers

10
10
CROATIAN PORTFOLIO KPI’S
Financial KPIs Operational KPIs
HRKm HRKm
600 40,0% 48,6%
600 50,0%
504 506 521 48,6%
480
35,0% 500
32,8% 45,0%
400 400
33,2% 30,8%
30,0% 300 253 40,0%
246
200 168 159 165 155 200
35,0%
100
0 20,0% 0 30,0%
2017 2018 2017 2018
Total revenue EBITDAR EBITDA ADR (HRK) RevPAR (HRK) Occupancy
EBITDA margin EBITDAR margin
• Total revenue increased by 5.0% with year-on-year growth reported in all our segments; hotels, self-catering holiday apartment complexes
and campsites. This growth was mainly due to a solid performance in the high season, underpinned by a strong performance in the
shoulder season
• Accommodation revenue grew by 5.8% to HRK 419.4 million and RevPAR was up 3.1% to HRK 253.4. This improved performance was
supported by a 3.1% increase in average daily rate and a 130 bps improvement in occupancy (% 365 days)
• The increase in revenue was offset by increased pressure on notably certain uncontrollable operational costs such as labour costs, waste
management expenses and cleaning services expenses. As a result, EBITDA decreased by 2.4% to HRK 155.3 million
Note: Revenue, EBITDAR and EBITDA exclude central services
11
11DISECTING THE CROATIAN PERFORMANCE DRIVERS
Revenue evolution EBITDA evolution
HRKm HRKm
504
160 159
500 16 (3) 2
155
2 (4)
480 6
480
140
460
440
120
420
400 100
Revenues Hotels Holiday Camps Revenues EBITDA 2017 Hotels Holiday Camps EBITDA 2018
2017 Apartments 2018 Apartments
HOTELS HOLIDAY APARTMENTS CAMPS
2018 Change vs 2017 2018 Change vs 2017 2018 Change vs 2017
Occupancy (%)1 63,7% 20 62.2% -110 41,3% 0
ADR (HRK) 788,6 0,0% 757.1 0,0% 321,2 9,1%
RevPAR (HRK) 502,6 0,4% 470.6 -1,7% 132,8 9,2%
1 In basis points
12
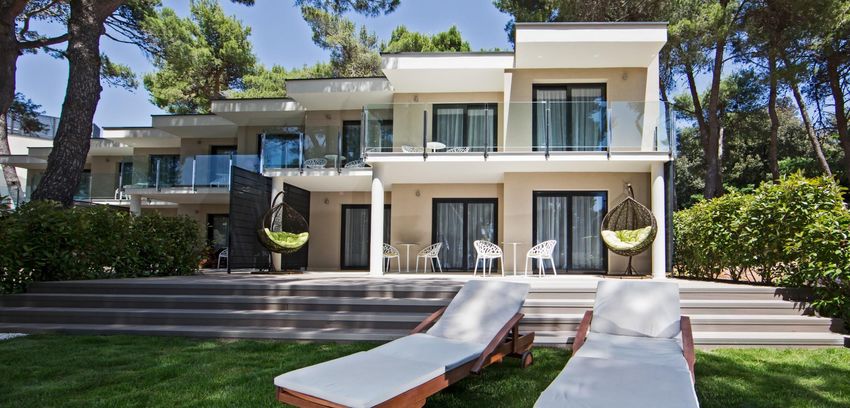
12ARENA ONE 99 GLAMPING – CASE STUDY
• The first full glamping site, luxury camping in the nature, in Croatia
• 199 fully equipped luxury glamping tents for couples or families
• Outdoor wellness area with hot tubs, massage, rain room, relaxation areas, and a special deck
for yoga
• Animation activities for children and adults
• Restaurants, lounge and beach bars, green market & grocery store, windsurfing centre, SUP
yoga, jogging & bike trail
• Vehicle-free campsite (with secure parking in the campsite entrance)
• Winner of Croatia’s best Campsite and the Golden Goat Award
• HRK 70 million invested
Revenues
EBITDA
+285.9% +322.7%
13
13GERMAN AND HUNGARIAN PORTFOLIO KPI’S
Financial KPIs Operational KPIs
HRKm HRKm
243
250 228 40,0%
800 734 745 84,0%
81,9%
200 700
30,0% 610 82,0%
600 561
150 80,0%
20,3% 500
20,0%
18,8% 400 78,0%
100
71 74 300 76,3% 76,0%
43 49 10,0%
50 200
74,0%
100
0 0,0% 0 72,0%
2017 2018 2017 2018
Total revenue EBITDAR EBITDA ADR (HRK) RevPAR (HRK) Occupancy
EBITDA margin EBITDAR margin
• Reported revenue grew by 6.8% to HRK 243.2 million supported by the successful ramp-up of our Park Plaza Nuremberg coupled with
increased demand for city breaks during the summer months
• Accommodation revenue growth was supported by an increase in ADR of 1.4% coupled with a 560 bps increase in Occupancy
• Reported EBITDA increased by 15.4% benefiting from the strong performance of our Park Plaza Nuremberg and further enhanced by
lower rental payments following the acquisition of freehold interests of art’otel cologne and art’otel berlin kudamm in 2017
Note: Revenue, EBITDAR and EBITDA exclude central services
14
14PARK PLAZA NUREMBERG – CASE STUDY
• Park Plaza Nuremberg opened in June 2016 with 177 rooms
• The hotel is located in the city prime position near the shopping and business centre of
Nuremberg, opposite to the main train station and about 7.7 kilometres (12 minutes by subway)
from the city’s international airport
• Nuremberg is situated in southern Germany, halfway between Munich and Frankfurt, making it
a convenient location and international centre for meetings, events and conferences (“MICE”)
and travel
• Nuremberg is also among the most dynamic high-tech cities in Europe well known for a
number of leading international trade fairs
• The hotel is experiencing a revenues growth of 16.5% and an EBITDA increase of staggering
41.5%
Revenues
EBITDA
+16.5% +41.5%
15
15Debt structure 16 16
NET DEBT AS AT 31 DECEMBER 2018

                                                                                             Year ended 31.12.2018
      HRK m                                                                      (1)   Group        Leverage                              Company                Leverage
      Debt                                                                              943,8             4,4x                               565,5                   3,8x
      Zagrebačka banka                                                                  524,5             2,4x                               524,5                    3,5x
      Erste banka                                                                        35,0             0,2x                                35,0                    0,2x
      Deutsche Hyphothekenbank                                                          379,9             1,8x                                 n/a                     n/a
      Accrued interest and capitalized costs                                              4,4                                                  6,1
      Cash                                                                              802,5            -3,7x                               682,4                     -4,6x

      Net debt                                                                          141,3                     0,7x                         -116,8                  -0,8x
     1Leverage   calculated as debt/EBITDA. EBITDA Group HRK 215m, EBITDA Company HRK 149m

                             Sustainable maturity profile                                                                Key Comments
     HRKm
                                                                      692               • Refinancing of the VZB loan at the end of 2018 in Germany will enable the
     700                                                                                     Group to save on the interest bill as the interest rate reduced from 6% to 2.4%

     600                                                                                • The Group raised HRK 35.0 million with Erste bank in Croatia to partly fund
                                                                                             the investment in Arena One 99 Glamping. The loan has a maturity of 5 years
     500                                                                                     and bears an interest rate of 1.95%

     400                                                                                • Zagrebačka banka loans in Croatia are secured with the Company's
                                                                                             properties in Croatia
     300                                                                                          • HRK 450.3 million matures in 2027 and bears an interest rate of
                                                                                                      2.5%
     200                                                                                          • HRK 75.0 million matures in 2028 and bears an interest rate of 2.4%
                                                              62
     100         46        46         46          47                                    • Loans outside Croatia are secured against the properties in Nuremberg,
                                                                                             Cologne and Berlin kudamm
       0
             2019         2020       2021        2022        2023   2024 and            • Maturities of the loans outside Croatia are until 2026/2027
                                                                    thereafter
                                                                                        • The interest rates on all the loans are fixed
17                         Croatia   Outside of Croatia   Total
17
Investments and Strategy 18 18
CAPEX OVERVIEW

           • Through the public offering the Group raised HRK 788 million in gross proceeds

           • Since the public offering the Group is investing 3x more on average than prior to the offering

           • Total capex of the Group in 2018 and 2019 amounts to c. HRK 400 million (excluding the capex planned for Hotel Brioni)

HRKm

 600

 500

                                                                                                                Average capex 2018-2019:
 400

                                                                                                                HRK 196m              2018
 300
                         Average capex 2013-2017:                                                                                     Arena One 99 Glamping:    HRK 70m
                                                                                                    4371
                                                                                                                                      2019
 200
                         HRK 71m                                                                                                      Campsite Kažela:          HRK 128m
                                                                                                                                      Verudela Beach:           HRK 60m
                                                                                                                                      Art’otel berlin kudamm:   HRK 53m

 100
                                                                                                           3x                241
                                         146                                                                       150
                                                                71                                  69                                Total growth capex: HRK 311m
                    52                                                               38
   0
                  2013                  2014                  2015                   2016           2017          2018      2019E

                                                                         Capex       Acquisitions

       1   Acquisition of freeholds in art’otel cologne and art’otel berlin kudamm
  19
  19
CAPITAL INVESTMENTS, REFURBISHMENTS AND
EXPANSION
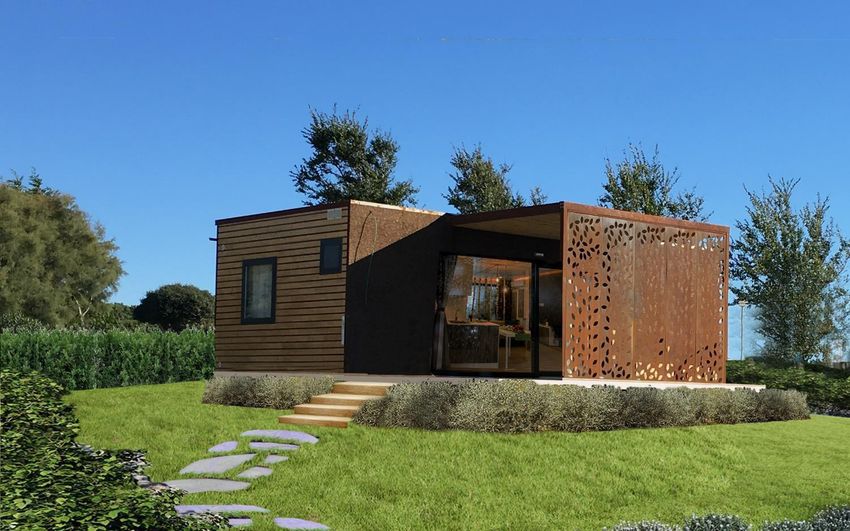
• 152 new, fully equipped premium and family Camping Homes featuring ecological and recycled materials
Campsite Kažela and offers 37 m2 of interior space, more than 25 m2 of covered terrace and 250 m2 of private garden
2019
HRK 128 million • Guest experience will be enhanced by one activity pool and one relax pool, new entrance and reception, a
great offering of local food and drinks and a well-thought-out programme of activities for children and adults
art’otel berlin kudamm • Plans to refurbish art’otel Berlin kudamm are in final stages. Rooms and the public areas will be refurbished,
2019
HRK 53 million upgrading the hotel to a contemporary luxurious hotel
Verudela Beach apartment • Complete refurbishment of the units and auxiliary facilities
complex 2019-2020 • Sample apartments approved, 10 units will be refurbished for the 2019 season whilst the remaining 146 units
HRK 60 million and 20 villas will be ready for the 2020 summer season
• The Group is finalising plans to reposition the property as an upper upscale Park Plaza branded hotel
Hotel Brioni
HRK 190 million
2020-2022 • Construction tender is in process and the project is planned to start late 2020 with a view to re-opening in
2022 if satisfactory terms agreed with constructors
• The Group continues to identify and review potential expansion opportunities in Croatia and Central and
Expansion Ongoing
Eastern Europe
• Spend 3-4% of revenues every year on routine maintenance, repairs and refurbishment to PPE
General CAPEX Guidelines 2019-2020
• Targeting 10% EBITDA return at the end of third year for investment capital expenditure projects in Croatia
20
20INVESTMENT 2019 – HRK 128 million
ARENA KAŽELA CAMPSITE - Camping Villa
ARENA KAŽELA CAMPSITE - Camping Home Green
ARENA KAŽELA CAMPSITE - Camping Home Next
ARENA KAŽELA CAMPSITE - Activity pool
INVESTMENT 2019 – HRK 53 million
art’otel berlin kudamm
art’otel berlin kudamm
art’otel berlin kudamm
art’otel berlin kudamm
INVESTMENT 2019 – HRK 60 million
ARENA VERUDELA VILLAS & BEACH
ARENA VERUDELA VILLAS & BEACH
ARENA VERUDELA VILLAS & BEACH
HOTEL BRIONI

35
35
HOTEL BRIONI

36
36
Q&A

37
37
Appendix

38
38
CONSOLIDATED AND COMPANY INCOME STATEMENT

39
39
CONSOLIDATED AND COMPANY STATEMENT OF FINANCIAL
 POSITION

40
40
CONSOLIDATED AND COMPANY STATEMENT OF CASH
 FLOWS

41
41
CONSOLIDATED AND COMPANY STATEMENT OF CASH
 FLOWS

42
42
ARENA HOSPITALITY GROUP INVESTOR RELATIONS

     Luka Cvitan

     Arena Hospitality Group d.d.

     Smareglina ulica 3, 52100 Pula
     Radnička cesta 39, 10000 Zagreb
     Croatia – Centar 2000

     Tel: +385 1 3496 459
     Tel: +385 52 223 811
     Fax: +385 52 215 263
     E-Mail: ir@arenahospitalitygroup.com

43
43
You can also read