Monthly Climate Bulletin - April 2020 - Sprep
←
→
Page content transcription
If your browser does not render page correctly, please read the page content below
Monthly Climate Bulletin
April 2020
CONTENTS

Summary                         2

El Niño–Southern Oscillation    3

Madden–Julian Oscillation       5
Wind                            6
Cloud and Rainfall              7
Oceanic Conditions             10
Mean Sea Level Pressure        15
Model Outlooks                 16
Cyclones                       20
Further Information            21

1 | Monthly Climate Bulletin
SUMMARY
Issued 08 May 2020

•     The tropical Pacific Ocean remains neutral with respect to the El Niño Southern Oscillation
      (ENSO) with negative Indian Ocean Dipole phase possible in mid-2020. International climate
      models forecast ENSO-neutral until July 2020.
•     A moderate to strong pulse of the Madden Julian Oscillation (MJO) has moved into Maritime
      Continent longitudes, to the north of Australia. The pulse is likely to weaken in the coming
      days and become indiscernible within a week.
•     The Intertropical Convergence Zone (ITCZ) was marginally weak than normal in the western
      Pacific, shifted slight north and extended further east than normal. The South Pacific Conver-
      gence Zone (SPCZ) was enhanced and shifted south of its normal position over Vanuatu, Fiji,
      Tonga, Samoa and Niue resulting in higher than normal rainfall for these islands.
•     Sea level in April was higher than normal in the central and eastern equatorial Pacific while
      some countries in the south and north Pacific experienced lower than normal sea level.
•     The Coral Bleaching Alert for early May shows a region of potential bleaching spanning
      northern Fiji and Samoa. Areas of Warning exist around northern PNG, Palau and FSM. The
      Coral Bleaching Outlook for May favours bleaching persisting around Samoa. Bleaching is
      also favoured around PNG, Solomon Islands, Fiji, Samoa and the northern Cook Islands.
•     For May to July 2020, a majority of the models used in this summary favour below normal
      rainfall for Nauru, northern Tuvalu and Kiribati. Warmer than average maximum and minimum
      temperatures are favoured for all the COSPPac countries except for Kiribati with near average
      temperature close to the equator.
•     Eight tropical cyclones formed in the southwest Pacific region including four severe cyclones.
      Harold was one of the most intense cyclones to make landfall in the Pacific Islands in April.

    © SPREP 2020
    This copyright statement protects our work from commercial exploitation, while ensuring that the information can be freely used for scien-
    tific, educational or research purposes, provided SPREP and the source document are acknowledged.

    2 | Monthly Climate Bulletin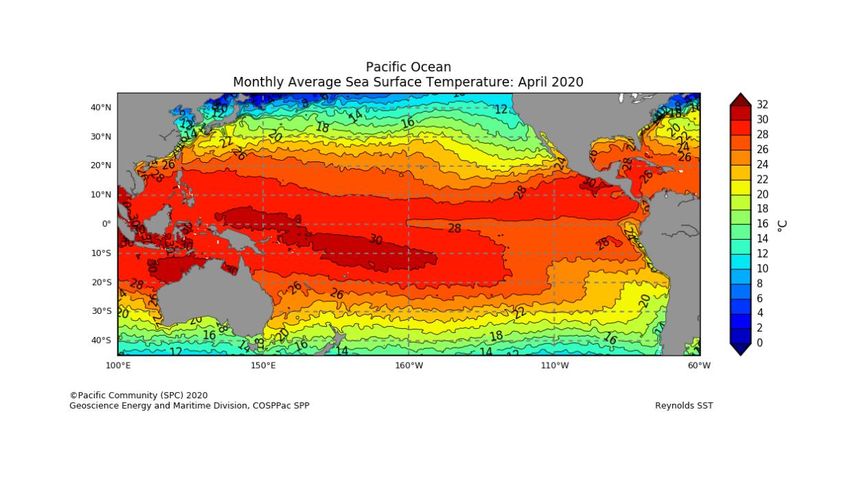
EL NIÑO–SOUTHERN OSCILLATION
ENSO neutral with negative Indian Ocean Dipole possible in 2020
ENSO Wrap-Up issued on 28 April 2020

The El Niño Southern Oscillation (ENSO) and Indian        ed ENSO is likely to stay neutral through the southern
Ocean Dipole (IOD) both remain neutral. Neutral EN-       hemisphere winter (June-August). By late winter/early
SO conditions are likely to persist over the coming       spring (August-September), three of the eight climate
months, with some likelihood a La Niña like state         models surveyed by the Bureau reach or exceed La
could develop in the tropical Pacific Ocean late in the   Niña levels, while the remaining five stay neutral. EN-
southern hemisphere winter (August) or spring             SO predictions made during autumn (March-May) tend
(September-November) less than 50% chance). Most          to have lower accuracy than predictions made at other
models suggest a negative IOD could develop in the        times of the year, so current ENSO forecasts should
Indian Ocean from mid-winter.                             be used with some caution. The Bureau's ENSO Out-
Atmospheric and oceanic indicators of ENSO includ- look remains at INACTIVE but conditions and outlooks
ing the Southern Oscillation Index (SOI), trade winds, will be assessed regularly against the criteria needed
cloudiness near the Date Line, and sea surface tem- for elevation to La Niña WATCH.
peratures in the tropical Pacific Ocean generally per- The Indian Ocean Dipole (IOD) is currently neutral. All
sist at levels consistent with a neutral ENSO state. six international climate models surveyed suggest
Sub-surface temperatures in the tropical Pacific negative IOD conditions could develop from the mid-
Ocean have cooled over the past two months, indicat- dle of the southern hemisphere winter (July). Howev-
ing increased potential for cooling at the surface in the er, each of the models show a broad spread of possi-
coming months under the right conditions.                 ble scenarios between the neutral IOD and negative
Some warmer than average tropical surface waters, IOD levels, with almost no sign of a re-emergence of a
near to and west of the Date Line, are generating per- positive IOD event. But again, caution must be taken
sistent cloudiness in the region. This pattern in the as accuracy of IOD forecasts made at this time of year
western Pacific may be reducing the impact of anoma- is low, with forecast accuracy improving from late au-
lously warm local sea surface temperatures around tumn (May).
this region, which would typically tend to increase rain- The approximate 30-day and 90-day Southern-
fall.                                                     Oscillation Index (SOI) values to 30 April were -0.5
Most climate models surveyed by the Bureau indicat- and -2.4 respectively.

 3 | Monthly Climate Bulletin
EL NIÑO–SOUTHERN OSCILLATION
ENSO and Indian Ocean Dipole Neutral
ENSO Wrap-Up Issued on 28 April 2020

   Bureau of Meteorology NINO3.4 ENSO Model Outlooks for May, July and September

           Bureau of Meteorology NINO3.4 International Model Outlooks

4 | Monthly Climate Bulletin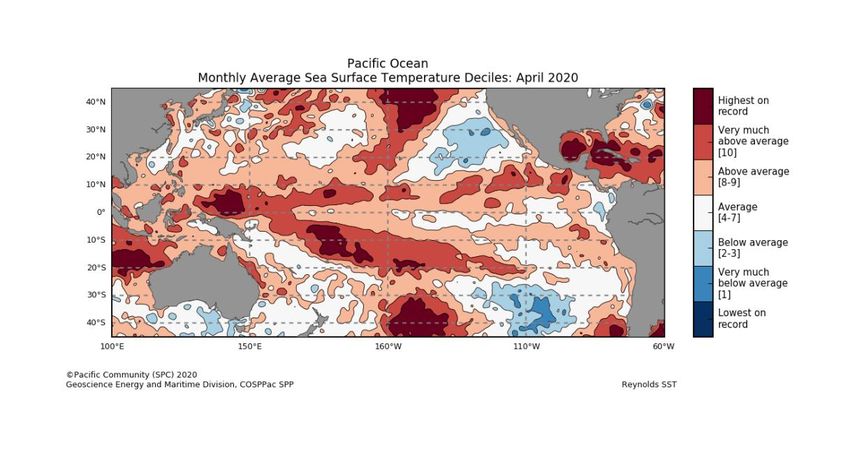
MADDEN–JULIAN OSCILLATION
Weekly Tropical Note [Issued on Tuesday 05 May 2020

A moderate strong pulse of the Madden Julian Os-
cillation (MJO) has moved into Maritime Continent
longitudes, to the north of Australia. The consen-
sus of international climate models is that the pulse
is likely to weaken in the coming days and become
indiscernible within a week. At this time of the year,
the influence of the MJO over northern Australia
(and western Pacific Islands) is relatively weak.

Parts of northern Queensland (Australia) typically
see above average rain, but the greatest effects
are felt to the north of Australia, over the near-
equatorial region including parts of Papua New
Guinea and Indonesia.

This is an abbreviated version of the Weekly Tropi-
cal Note. Click on the Weekly Tropical for more
information

5 | Monthly Climate Bulletin
WIND
The equatorial trade winds in the 5-day snapshot ending 29 April and for April show near nor-
mal trade winds across the equatorial tropical Pacific.
During La Niña events, there is a sustained strengthening of the trade winds across much of
the tropical Pacific, while during El Niño events there is a sustained weakening, or even rever-
sal, of the trade winds.

 6 | Monthly Climate Bulletin
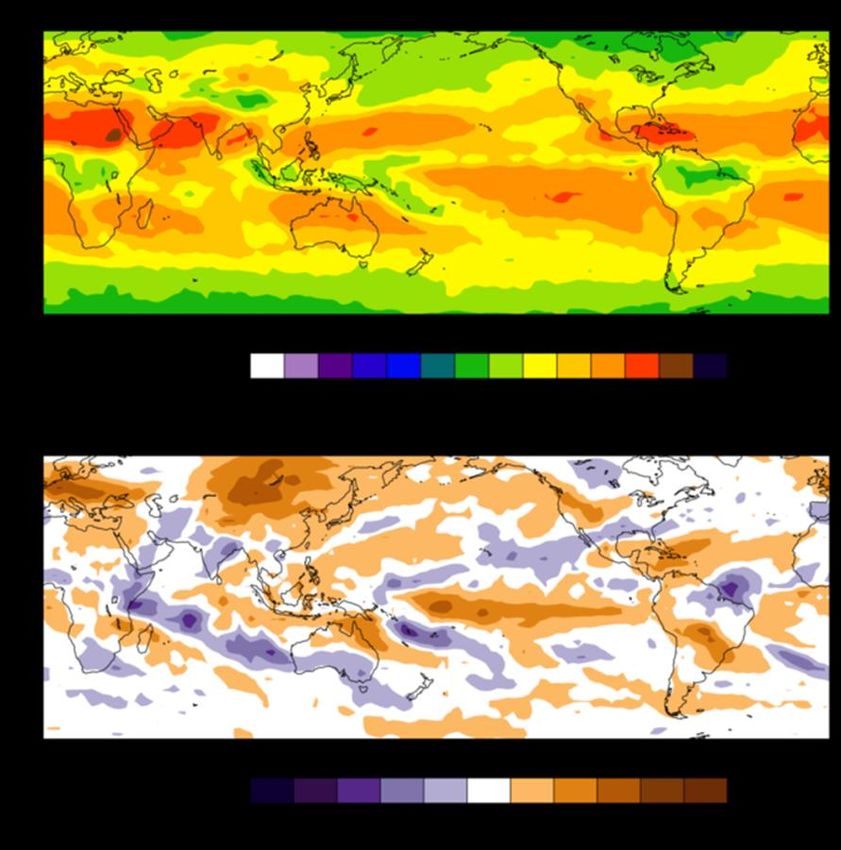
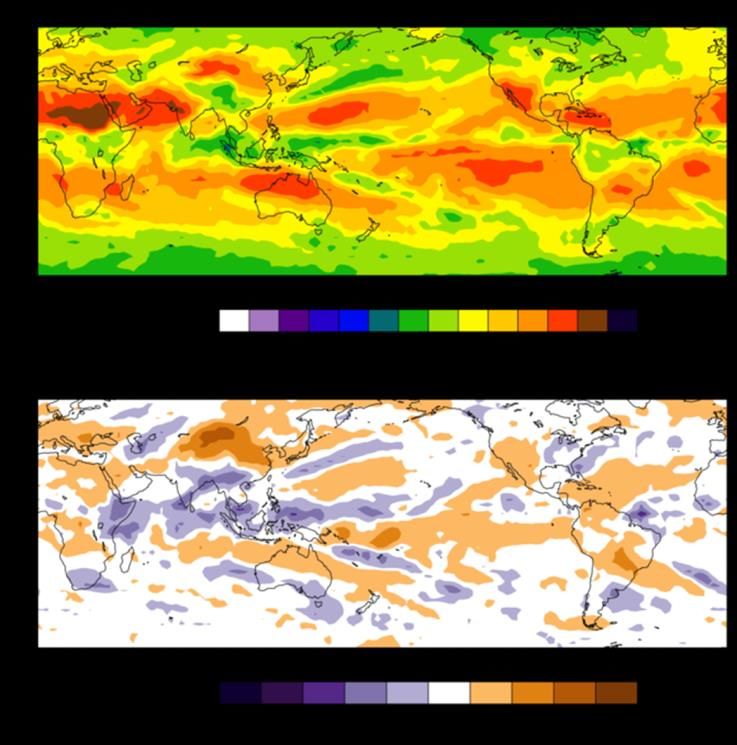
CLOUD AND RAINFALL

The April 30-day OLR total and anomaly maps suggest the Intertropical Convergence Zone
(ITCZ) was marginally weakened in the western Pacific, shifted slightly north from its normal po-
sition and extended further east than normal. The South Pacific Convergence Zone (SPCZ) was
enhanced and shifted southwards of its normal position over Vanuatu, Fiji, Tonga, Samoa and
Niue resulting in higher than normal rainfall for these islands. The ITCZ and SPCZ appear to
have merged further east than is normal for April, just north of the Solomon Islands.
 Note: Global maps of OLR below highlight regions experiencing more or less cloudiness. The
top panel is the total OLR in Watts per square metre (W/m2) and the bottom panel is the anoma-
ly (current minus the 1979-1998 climate average), in W/m2. In the bottom panel, negative values
(blue shading) represent above normal cloudiness while positive values (brown shading) repre-
sent below normal cloudiness.

                    OLR Total and Anomalies, 30 Day OLR

 7 | Monthly Climate Bulletin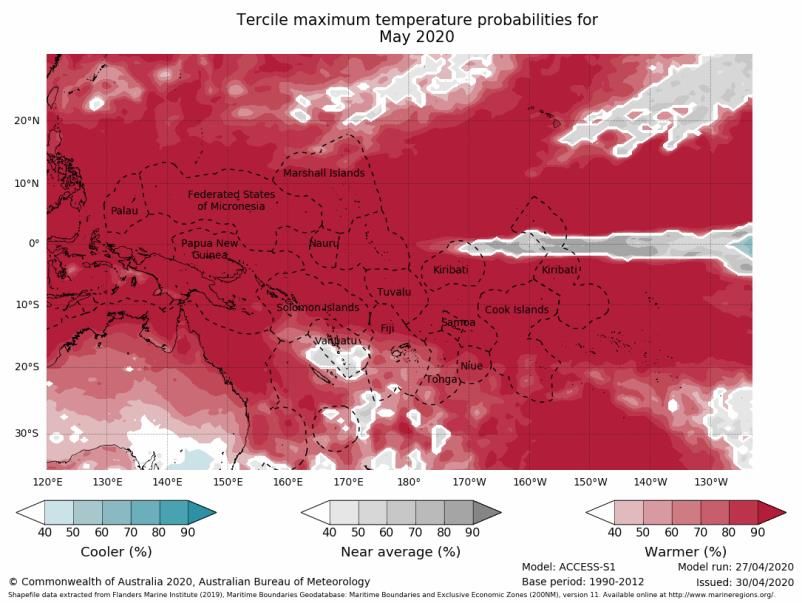
OLR Total and Anomalies, 7 Day OLR

8 | Monthly Climate Bulletin
30-Day Rainfall Anomalies

           https://www.cpc.ncep.noaa.gov/products/Global_Monsoons /Figures/curr.p.30day.figb.gif

9 | Monthly Climate Bulletin
OCEAN CONDITIONS
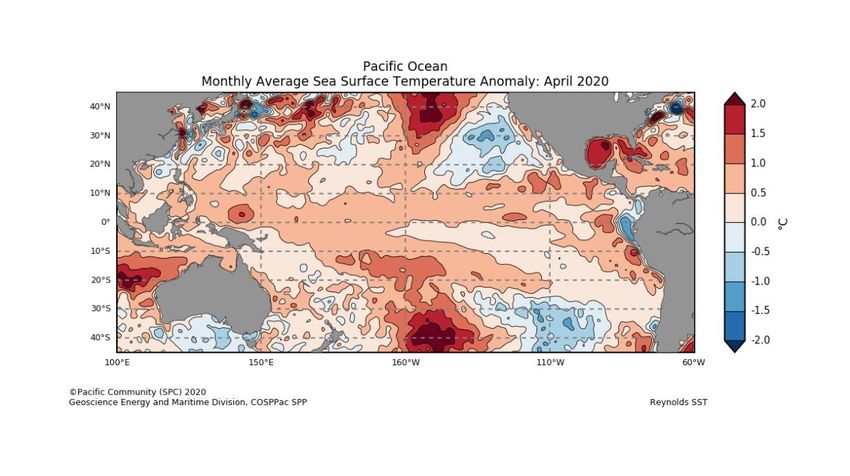
SEA SURFACE TEMPERATURE
Sea surface temperatures (SSTs) for April were slightly warmer than average across most of the
equatorial Pacific Ocean but remain within the neutral range. The eastern equatorial Pacific has
warmed slightly compared to two weeks ago, while temperature anomalies in the central region
have decreased slightly.
SSTs also remain warmer than average around the COSPPac countries. SSTs ranged from half
to one degree warmer than average around Pacific, and up to one and half degree warmer than
average around northern PNG, Samoa, Niue and southern Cook Islands. Cooler than average
SST were around the Vanuatu EEZ. In terms of the deciles, regions of Highest on Record for
April spanned across PNG, FSM, Tuvalu, Fiji, Samoa and Niue EEZs. Average to below average
(2-7) spanned across PNG, Solomon Islands, Vanuatu and Fiji EEZ. In comparison to March,
SSTs for the NINO regions show higher positive anomalies for NINO 3 and 3.4 region while
NINO4 has reduced warming. All regions indicate ENSO neutral range. The April SST anomalies
for the NINO3, NINO3.4 and NINO4 regions were +0.7°C, +0.5°C and +0.4°C, respectively.
Mean Sea Surface Temperature
10 | Monthly Climate BulletinOCEAN CONDITIONS
SEA SURFACE TEMPERATURE
Anomalous Sea Surface Temperature
Sea Surface Temperatures Deciles
11 | Monthly Climate BulletinOCEAN CONDITIONS
SUB SURFACE
The Bureau of Meteorology's four-month sequence of equatorial sub-surface temperature
anomalies (to 23 April) shows cooler than average waters extend in a band across most of the
equatorial Pacific, between about 100 and 200-m in the western to central equatorial Pacific
and rising to a depth of around 50-m at the eastern edge of the equatorial Pacific. In the west-
ern equatorial Pacific very weak warm anomalies persist in the top 150 m, but have decreased
significantly in strength and extent compared to March. Since January, warm anomalies in the
western equatorial Pacific near the surface have decreased, while the pattern of cooler anoma-
lies at depth has strengthened.
Weekly Temperatures Mean and Anomalies Monthly Temperatures Anomalies
Bureau of Meteorology Sea Temperature Analy-
sis:http://www.bom.gov.au/marine/sst.shtml
TAO/TRITON Data Display:http://www.pmel.noaa.gov/tao/jsdisplay/
12 | Monthly Climate BulletinOCEAN CONDITIONS
CORAL BLEACHING
The daily Coral Bleaching Alert for 01 May 2020 shows a region of Alert Level 1 spanning north-
ern Fiji and Samoa. Areas of Warning exist around northern PNG, Palau and FSM EEZ. The
remainder of south west Pacific Island countries are on Watch. The four weeks Coral Bleaching
Outlook till 24 May shows the region of Alert Level 2 to persist around the Samoa EEZ. Areas of
Alert Level 1 exist in PNG, Solomon Islands, Fiji, Samoa and northern Cook Islands EEZ. The
remainder of the south west Pacific countries are on warning, Watch or no stress.
Daily Coral Bleaching Alert
(Source: Pacific Community COSPPac Ocean Porta Coral Bleaching)
4-Weeks Coral Bleaching Outlook
(Source: Pacific Community COSPPac Ocean Portal)
13 | Monthly Climate BulletinOCEAN CONDITIONS
OCEAN SURFACE CURRENTS AND SEA LEVEL
OCEAN SURFACE CURRENTS AND SEA LEVEL
The most recent 7-day ocean surface currents plot shows a stronger than normal westward flow-
ing Equatorial Current in the equatorial Pacific.
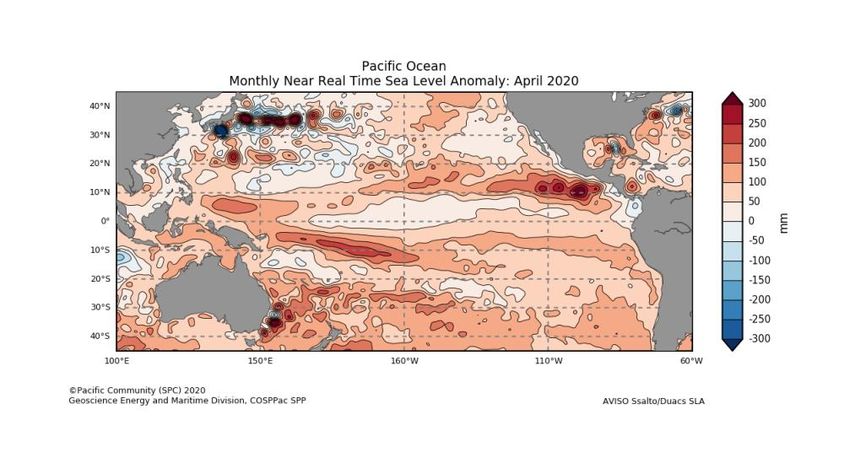
Sea level in April was higher than normal in the central and western equatorial Pacific. The highest
sea level anomalies (1.5-3cm) were situated around eastern Palau, western FSM, northern Solo-
mon Islands, Tuvalu, Samoa and northern Cook Islands. Parts of FSM, PNG, Solomon Islands,
Vanuatu, Fiji, Tonga, Niue and southern Cook Islands experienced negative sea level anomalies .
Ocean Surface Current (Last 7-Days)
Bureau of Meteorology POAMA
Monthly Sea Level Anomalies
Source: Pacific Community COSPPac Ocean Portal
14 | Monthly Climate BulletinMEAN SEA LEVEL PRESSURE The April mean sea level pressure (MSLP) anomaly map shows negative anomalies east of about 160°E. Positive anomalies were present in the western Pacific, over northeast Australia, FSM, Marshall Islands, Papua New Guinea and Solomon Islands. Areas of above (below) average MSLP usually coincide with areas of suppressed (enhanced) con- vection and rain throughout the month. Mean Anomalous Bureau of Meteorology South Pacific Circulation Patterns: http://www.bom.gov.au/cgi-bin/climate/cmb.cgi?variable=mslp&area=spac&map=anomaly&time=latest 15 | Monthly Climate Bulletin
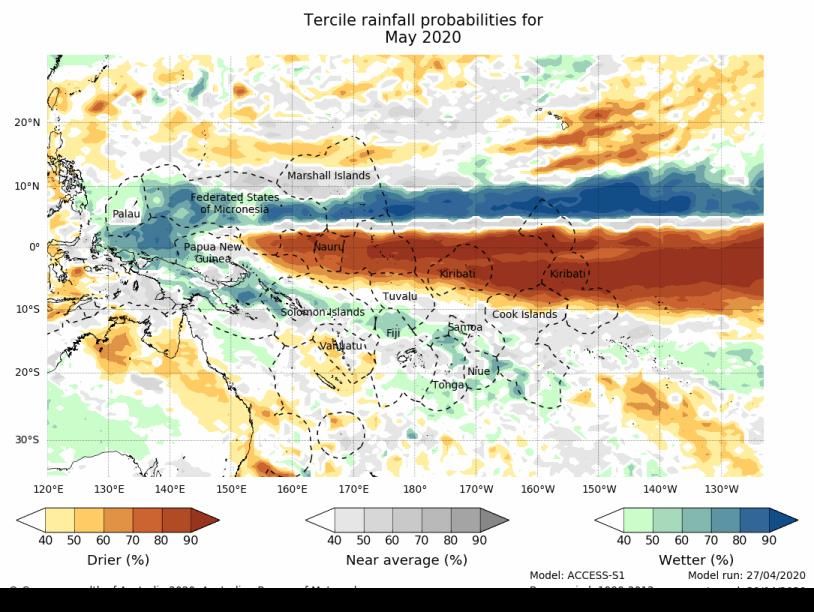
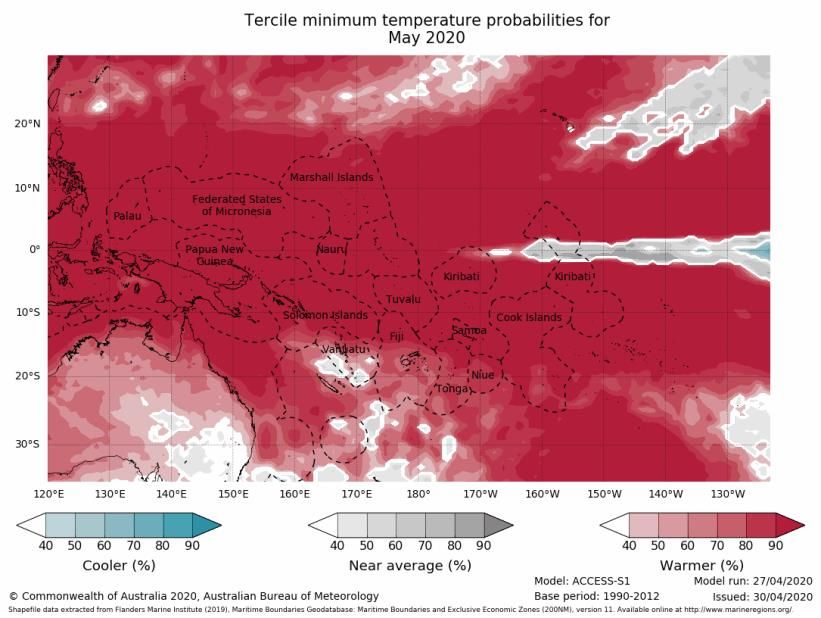
SEASONAL RAINFALL OUTLOOK
May—July 2020
For the month of May, the ACCESS-S model favours drier than average conditions for the north-
ern Marshall Islands, New Caledonia, parts of Vanuatu, Nauru, northern Tuvalu, northern Cook
Islands, northern and southernmost French Polynesia and Kiribati. Wetter than average conditions
is favoured for Palau, FSM, the New Guinea highlands region, PNG Islands, southern PNG,
southern Marshall Islands, western and eastern Solomon Islands, northern Fiji, Tonga, Samoa
and parts of the southern Cook Islands and central French Polynesia. The three months outlook
(May-July) favours a similar outlook to that for May with drier than average conditions extending to
southern FSM and Fiji but not for the northern Marshall Islands. Wetter than average conditions
are also favoured also for the central Cook Islands and Niue. Warmer than average maximum and
minimum temperature is favoured for all COSPPac countries except for Kiribati with near average
temperature.
The Copernicus multi-model outlook favours drier than average conditions for Nauru, Kiribati and
northern Tuvalu and wetter than average conditions for Palau, southern FSM, southern Marshall
Islands, Rotuma (Fiji), Wallis and Futuna and Samoa.
The SCOPIC statistical model favours below-normal rainfall for most parts of PNG, FSM, central
Solomon Islands, Vanuatu, Fiji, Tonga, Niue and southern Cook Islands. Above normal rainfall is
favoured for western Solomon Islands, Tuvalu, Kiribati and northern Cook Islands.
The APEC Climate Centre multi-model favours below normal rainfall for Palau, PNG, Nauru, Tuva-
lu, Kiribati and northern Cook Islands. Above normal rainfall is favour for southern Marshall Is-
lands.
For May to July, most of the models agree on below normal rainfall for Nauru, northern Tuvalu and
Kiribati.

   Monthly
   ACCESS-S
   Maps

 16 | Monthly Climate Bulletin
SEASONAL RAINFALL OUTLOOK
May—July 2020

                                 Monthly ACCESS-S Maps

 17 | Monthly Climate Bulletin
SEASONAL RAINFALL OUTLOOK
May—July 2020
Seasonal ACCESS-S maps
SCOPIC
‘About SCOPIC’ www.pacificmet.net/project/climate-
and-ocean-support-program-pacific-cosppac
18 | Monthly Climate BulletinSEASONAL RAINFALL OUTLOOK
May—July 2020
Copernicus (C3S multi-system)-Rainfall
APEC Climate Information Toolkit for the Pacific: http://clikp.sprep.org/
19 | Monthly Climate BulletinTROPICAL CYCLONE
2019/2020 Season
Eight tropical cyclones (Rita, Sarai, Tino, Uesi, Vicky,
Wasi, Gretel and Harold) formed in the 2019-20 south
Pacific (east of the tip of Cape York, Queensland) cy-
clone season. These cyclones affected Solomon Islands, The tropical cyclone season outlook for 2018-19
is available via: http://www.bom.gov.au/
New Caledonia, Vanuatu, Fiji, Wallis and Futuna, Tonga,
climate/cyclones/south-pacific/
American Samoa, Samoa and Niue. Out of the eight cy-
clones, four severe cyclones: Rita, Tino, Uesi, and Har- MeteoFrance Tropical Cyclone Weekly Forecasts
old. Harold was one of the most intense cyclones to make
landfall in the Pacific Islands during April on record
(minimum mean sea level pressure 912 hPa). The long-
term average for the period 1969-70 to 2017-18 is nine
cyclones. Although the official cyclone season ended in
April 2020, historical data has shown that cyclones can
formed outside the normal cyclone season. Updates on
tropical cyclone forecast from the MeteoFrance weekly
forecasts will resume in October 2020.
The tropical cyclone season outlook for 2019-20 is availa-
ble via: http://www.bom.gov.au/climate/cyclones/south-
pacific/
Individual Model Links
UKMO Global long-range model probability maps: http://
www.metoffice.gov.uk/research/climate/seasonal-to-decadal/gpc-outlooks/
glob-seas-prob
ECMWF Rain (Public charts) - Long range forecast: http://www.ecmwf.int/en/
forecasts/charts/seasonal/rain-public-charts-long-range-forecast
POAMA Pacific Seasonal Prediction Portal: http://poama.bom.gov.au/
experimental/pasap/index.shtml
APEC Climate Center (APCC): http://www.apcc21.org/eng/service/6mon/ps/
japcc030703.jsp
NASA GMAO GEOS-5:http://gmao.gsfc.nasa.gov/research/ocean/
NOAA CFSv2:http://www.cpc.ncep.noaa.gov/products/CFSv2/
CFSv2seasonal.shtml
IRI for Climate and Society: http://iri.columbia.edu/our-expertise/climate/
forecasts/seasonal-climate-forecasts/
20 | Monthly Climate BulletinOTHER INFORMATION
Southern Oscillation Index
The Southern Oscillation Index, or SOI, gives an indication of the development and intensity of El Niño and
La Niña events across the Pacific Basin. The SOI is calculated using the difference in air pressure between
Tahiti and Darwin. Sustained negative values of the SOI below −7 often indicate El Niño episodes. These
negative values are usually accompanied by sustained warming of the central and/or eastern tropical Pacific
Ocean, and a decrease in the strength of the Pacific Trade Winds. Sustained positive values of the SOI
greater than +7 are typical of La Niña episodes. They are associated with stronger Pacific Trade Winds and
sustained cooling of the central and eastern tropical Pacific Ocean. In contrast, ocean temperatures to the
north of Australia usually become warmer than normal.
Multivariate ENSO Index (MEI)
The Climate Diagnostics Center Multivariate ENSO Index (MEI) is derived from a number of parameters
typically associated with El Niño and La Niña. Sustained negative values indicate La Niña, and sustained
positive values indicate El Niño.
20 degrees Celsius Isotherm Depth
The 20°C Isotherm Depth is the depth at which the water temperature is 20°C. This measurement is im-
portant, as the 20°C isotherm usually occurs close to the thermocline, the region of most rapid change of
temperature with depth, or the division between the mixed surface layer and deep ocean. A deeper than
normal 20°C isotherm (positive anomaly) implies a greater heat content in the upper ocean, whilst a shal-
lower 20°C isotherm (negative anomaly) implies a lower than normal heat content in the upper ocean.
Regions
SST measurements may refer to the NINO1, 2, 1+2, 3, 3.4 or 4 regions. These descriptions simply
refer to the spatially averaged SST for the region described. The NINO regions (shown in the figure
below) cover the following areas:
Region Latitude Longitude
NINO1 5-10°S 80-90°W
NINO2 0-5°S 80-90°W
NINO3 5°N to 5°S 150-90°W
NINO3.4 5°N to 5°S 120-170°W
NINO4 5°N to 5°S 160°E to 150°W
NOTE: NINO1+2 is the combined areas 1 and 2
21 | Monthly Climate BulletinYou can also read