RBK & AIB Backing the Midlands Corporate Sector Welcome & Introduction - AWS
←
→
Page content transcription
If your browser does not render page correctly, please read the page content below
RBK & AIB Backing the Midlands Corporate
                 Sector

             Welcome & Introduction
                            Gerard Corcoran
 Head of AIB Meath, Westmeath & Longford | Retail & Business Banking
            T: (046) 903 7850 E: Gerard.j.Corcoran@aib.ie

                             Dermot Ryan
       Head of Business Banking, Meath, Westmeath & Longford
             T: (086) 772 5128 E: Dermot.f.ryan@aib.ie
The Challenge of Brexit
for Ireland

November 2017

John Fahey
Senior Economist
AIB

2

Sterling
      City of              Customs
     London                & Tariffs

Northern
                                 Transition
Ireland/        BREXIT          Arrangement
Scotland

                           Future of
    Migration
                            the EU
                Trade
                 Deal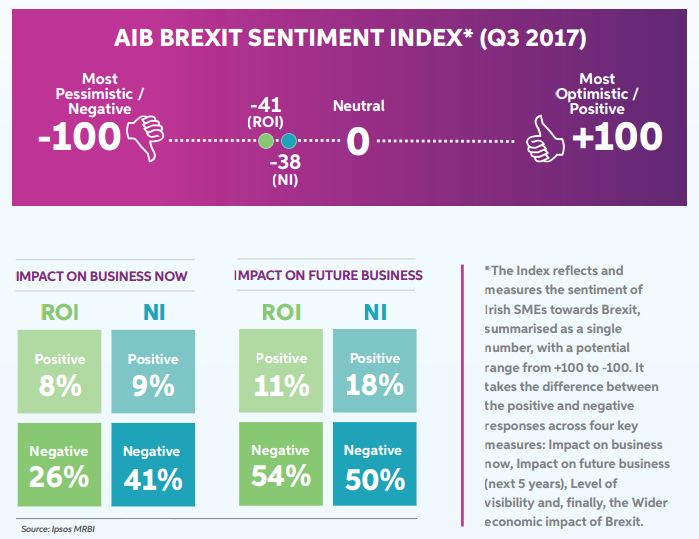
Does the UK know what it wants ?

                                   Financial Times 16th Dec 2016
Brexit is a major challenge for Ireland

  •   Brexit has serious implications for Ireland given close trade links with UK

  •   Trade with UK equates to 35% of Irish GDP/GNI. Thus, it is a key trading partner
Trade with UK equates to 35%
  • Irish
 of       GDP. Thus,
     UK takes   someit40%
                       is a key
                             of Irish indigenous firms exports, so very important market
         trading partner
  •   Common labour market with UK – Common Travel Area pre-dates EU membership
     UK takes 43% of Irish
  • Expectedfirm
 indigenous    negative
                  exports,impact
                           so    of Brexit on UK economy will have knock-on effect on
veryIrish exports
     important     to UK
               trading partner

  • Common
 Expected       landimpact
           negative   borderofwith the UK – Northern Ireland
Brexit on UK economy will have
  •knock-on
    A lot ofeffect
              crossincountry
                      Ireland investment between Ireland and the UK, especially in
      retailing, agri-food, banking, insurance, energy
Sterling has fallen sharply on
Brexit concerns, which will hit
        exports to UK
Brexit brings risks and opportunities
• Higher trading costs from more administration, differing rules and regulations,
compliance costs, possible customs duties/tariffs when UK leaves EU
• Brexit could impact the considerable cross-country investment between UK and
Ireland
Trade with UK equates to 35%
of Irish GDP. Thus, it is a key
• Border
trading partner
with Northern Ireland will become an external EU land border, with
possible Customs checks and other restrictions on free movement of goods
UK takes 43% of Irish
• Ireland will
indigenous firm lose
exports,
key so
ally within EU when UK leaves as share similar views on
very taxation,
important regulation,
trading partner
state involvement in economy etc.
Expected negative impact of
• Brexit will see an outflow of investment and jobs from the UK to EU countries,
Brexit on UK economy will have
including
knock-on Ireland,
effect especially in financial services
in Ireland
• Brexit
Sterling haswill provide
fallen sharplyIreland
on with a big advantage over UK in competing for global
FDIconcerns,
Brexit comingwhich
into Europe
will hit that needs full, unfettered access to EU markets
exports to UKBrexit expected to lower growth rate of Irish economy
Impact of Brexit on Output (% deviation from base)
ESRI estimate that Irish output would be reduced by 2-2.5% on a soft Brexit
Sharp fall-off in trade with UK likely on a hard Brexit
Output almost 4.0 % lower over time if there is hard Brexit and a fall back on WTO rules
Employment 2% lower and unemployment rate nearly 2% higher in hard BrexitWTO Tariffs/Customs controls likely in Hard Brexit
Membership of WTO
UK would need to negotiate full membership of WTO and begin
international trade talks with many countries, including EU
WTO Rules
UK would have to fall back on WTO rules which require a common
No Trade Agreement /
set of tariff rates to be applied to all countries where no free trade
access to Single Market
deals exists and thus Customs checks and duties
Tariffs
Applying tariffs raises prices, but low/no tariffs weakens position in
any trade talks
EU applies significant common external tariffs which would be levied
as Customs duties on UK exports to EU in absence of trade dealTariffs and non-tariff barriers both problematic for trade
Non-Tariff Barriers
• Rules of Origin for Goods
• Standards of Production (inspections)
• Transport Licenses
• Delays, Physical inspections
• Increased Admin CostsAgri-sector would be severely impacted by hard Brexit
Share of Exports by Industry Destined for the UK (ESRI)
Main EU tariffs relate to food
50%
products, keeping prices up.
45 %
UK may not maintain these
40%
post-Brexit
35%
Food and Beverages account 30 %
for 25% of total Irish exports 25 %
to UK 20 %
Around 40% of Irish food 15 %
exports go to the UK 10 %
Other sectors very dependent
5%
0%
on UK market include
machinery and transport,
metal products, textiles
Some 40% of indigenous Irish
exports go to UK compared to
10% for foreign owned
companiesImpact will be regional\sectoral with winners\losers
• Brexit should be positive for Dublin region because of increased FDI from UK
• Should be increased inflow of investment/jobs in financial services in particular
Trade with UK equates to 35%
• Irish
of Underpin the housing
GDP. Thus, it is a keyand CRE markets in Dublin and its hinterland
trading partner
• Negative for border counties and rural economies dependent on agri/tourism,
especially if customs
UK takes 43% of Irish controls and tariffs introduced
indigenous firm exports, so
• Tourism
very important tradingseeing
already partnera fall-off in UK numbers owing to weak sterling
• Could negative
Expected impact
be a sharp of in market prices in UK if existing tariffs removed on food
drop
Brexit on UK economy will have
imports. Irish beef and cheese sectors particularly vulnerable as key export market
knock-on effect in Ireland
• Longer
Sterling hasterm, there could
fallen sharply on be increased FDI into Ireland if UK loses free access to EU
markets
Brexit – Financial
concerns, which willservices,
hit IT, Pharma, healthcare sectors most likely to benefit
exports to UKSharp fall of sterling adds to Brexit concerns
• Sterling has fallen sharply on Brexit concerns, which hits
exports to UK
• Also impacts Irish firms competing with UK exports to
Euro / Sterling Exchange Rate
Ireland and elsewhere £
0.96
• Many
TradeIrish
withexporters
UK equatesto UK are small firms with no Treasury
to 35% 0.92
function
of Irish GDP. Thus, it is a key exposure
so don’t hedge currency
trading partner 0.88
• Cross border trade picks up as shoppers head North
following sterling's big fall. 0.84
UK takes 43% of Irish
• Bigindigenous
rise in on-line
firmsales goingsoto the UK
exports, 0.80
very important trading partner
• Sterling weakness has already seen a big fall-off in tourist
0.76
numbers from the UK this year 0.72
Expected negative impact of
• Brexit
Irish on UK
firms, economy
though, havewill have used of sterling trading in
become 0.68
weakknock-on effect
and volatile in Ireland
fashion in past decade Nov-15 May-16 Nov-16 May-17 Nov-17
Source: Thomson Datastream
• EUR/GBP
Sterling has
has entered a 87-92p
fallen sharply on trading band in past six
months
Brexit concerns, which will hit
exports to UKFX Market Outlook
£ Euro / Sterling Exchange Rate
1.00
0.90
0.80
0.70
0.60
Nov-03 Nov-05 Nov-07 Nov-09 Nov-11 Nov-13 Nov-15 Nov-17
Source: Thomson Datastream
Progress of Brexit negotiations key factor influencing sterling in period ahead.
If ‘soft’ brexit looks on the cards, EUR/GBP could move down to 85p or below
if ‘hard’ Brexit more likely, EUR/GBP could move above 93-95p level to trade in a 95-100p bandExit Negotiations Timeline?
The Withdrawal Terms Future Relationship Transition Arrangements
(June-December 2017) (January – June 2018) (July-November 2018)
Some key issues Some key issues
Some key issues
• Disentangling past • Scope of discussions on future • Role of European Court of
ties/commitments relations – trade, security etc Justice in this period
• Budget discussions on the • Sketch aims for post-Brexit FTA • Benefitting from market access
Exit Bill the UK faces • Different to normal trade deal requires adhering to EU Rules
• Citizen Rights -4m EU/UK as no trade barriers at present • Customs arrangements
migrants, preserving their • Level playing field- prevent • Free movement of labour and
rights, how to enforce it “Regulatory Dumping” e.g. immigration controls
• Ireland/NI, type of border, workers rights, subsidy rules • Cost to UK for access to EU
Irish citizens in NI, provision • Extent of market access to be markets/use of EU agencies
to allow NI re-join EU if maintained • Likely period of time transition
United Ireland • Disputes resolution mechanism arrangement will lastFuture customs arrangements the key issue
UK to leave EU, Single Market and Customs Union – end of common external tariffs
Exit deal will need to contain transition arrangements to avoid disruption to trade until
an EU/UK trade deal is done
UK suggests a common UK-EU Customs Union during transition period
UK wants to conclude full free trade deal with EU within 2 years of its 2019 departure
The more UK wants to regain autonomy/sovereignty and do third country trade deals,
the less favourable that its access to EU markets will be in future
Worst outcome is no deal and UK has to fall back on WTO rules. These require a
common set of tariff rates to be applied to all countries where no free trade deals exits
Unclear what the arrangements on customs would apply after transition period ends.
UK wants ‘a new customs partnership’ or ‘highly streamlined customs arrangements’
But EU will not allow integrity of Single market and ECJ to be undermined
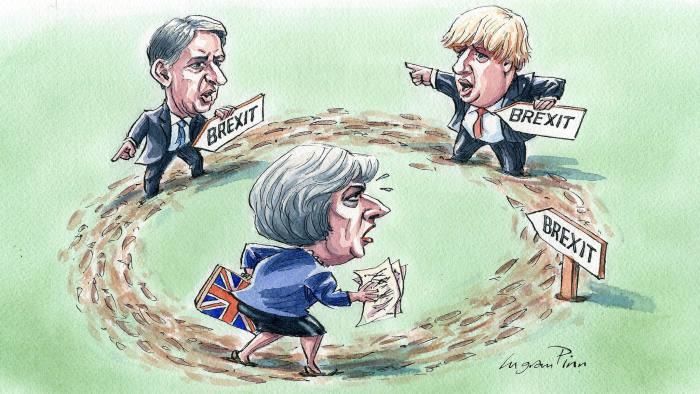
It may be 2021 or later before we know what Brexit truly meansSMEs pessimistic about Brexit
But, despite uncertainty, upbeat Irish economic indicators
                    Ireland Mfg and Services PMIs                                                                                      Construction Investment
70                                                                                                              %                   (Volume, 3 Qtr Moving Average, YoY% Change)
                                                                                                                40
65
                                                   Services
                                                                                                                30
60
                                                                                                                20
55
                                                                                                                10
                                                                Manufacturing
50
                                                                                                                 0
45                                                                                                              -10

40                                                                                                              -20

35                                                                                                              -30

30                                                                                                              -40
 Oct-07             Oct-09             Oct-11              Oct-13              Oct-15                 Oct-17      Q2 2007        Q2 2009       Q2 2011       Q2 2013        Q2 2015            Q2 2017
                                                                       Source: Thomson Datastream, Investec                                                                             Source : CSO

                    Consumer Confidence (ESRI - KBC)                                                            %           Irish Retail Sales (ex-autos) - Volume, YoY, %
120                                                                                                             10
                                                                                                                 8

100                                                                                                              6
                                                                                                                 4
 80                                                                                                              2
                                                                                                                 0
 60                                                                                                              -2
                                                                                                                 -4
 40                                                                                                              -6
                                                                                                                 -8
 20                                                                                                             -10
     Oct -07 Oct -08 Oct -09 Oct -10   Oct -11   Oct -12   Oct -13   Oct -14   Oct -15    Oct -16     Oct -17     Q3 2007       Q3 2009        Q3 2011       Q3 2013       Q3 2015            Q3 2017
                                                                 Source: ESRI - KBC, Thomson Datastream                                                                    Source: Thomson Datastream
Unemployment falls sharply on strong economic growth
Irish Exports of Services
(Volume, 3 Qtr Moving Average, YoY% Change) % Core Domestic Spending* (3 Qtr MA, % Yr-on-Yr)
20 8
6
15
4
10
2
0
5
-2
0
-4
-5 -6
Q2 2007 Q2 2008 Q2 2009 Q2 2010 Q2 2011 Q2 2012 Q2 2013 Q2 2014 Q2 2015 Q2 2016 Q2 2017 Q2 2011 Q2 2012 Q2 2013 Q2 2014 Q2 2015 Q2 2016 Q2 2017
Source : CSO *Domestic Spending excluding investment in aircraft and intangibles Source: CSO, AIB ERU Calculations
% Employment (YoY, %)
6 % Unemployment Rate (%)
16
Private
4
14
2
Total
12
0
10
-2
Public
8
-4
-6 6
-8 4
Q2 2010 Q2 2011 Q2 2012 Q2 2013 Q2 2014 Q2 2015 2016Q2 2017Q2 Oct-07 Oct-08 Oct-09 Oct-10 Oct-11 Oct-12 Oct-13 Oct-14 Oct-15 Oct-16 Oct-17
Source: Thomson Datastream, CSO Source: Thomson DatastreamDebt ratios fall, budget deficit nearly eliminated
% Government Debt Ratios (%) Irish Household Debt
% (% of Disposible Income)
130 240
120
220
110
Net Gov Debt (i.e. ex cash & liquid assets)
200
/ modified Gross National Income Ratio
100
180
90
160
80
Gross General Gov Debt/ GDP Ratio
70 140
60 120
50
100
2010 2011 2012 2013 2014 2015 2016 2017(f) 2018(f) 2019(f) 2020(f)
Q2 2003 Q2 2005 Q2 2007 Q2 2009 Q2 2011 Q2 2013 Q2 2015 Q2 2017
Sources: Dept of Finance, Irish Fiscal Council, AIB ERU (Note Inflated/ Distorted GDP figues from 2015) Source: CSO, Central Bank, AIB ERU
General Government Balance* (% GDP) % Irish Benchmark Yields
2 %
12 12
0
10 10
-2 8 8
-4 6 6
-6 4 4
-8 2 2
-10 0 0
-12 -2 -2
2010 2011 2012 2013 2014 2015 2016 2017(f) 2018(f) 2019(f) 2020(f) Oct -11 Oct -12 Oct -13 Oct -14 Oct -15 Oct -16 Oct -17
5 Year 10 Year Source: Thomson Reuters
*Excludes banking recapitalisation costs in 2010 -11 Source : Dept of FinanceSolid Irish growth to continue as Brexit looms
AIB Irish Economic Forecasts
Construction picking up from still low output levels
Budgetary policy turns mildly expansionary % change in real terms unless
stated
2017 (f) 2018 (f) 2019 (f)
Activity supported by low interest rate environment GDP 4.5 3.5 3.0
FDI strong despite concerns on corporate tax GNP 3.0 3.0 2.5
Very low Irish inflation, well below Eurozone and Personal Consumption 2.5 2.5 2.5
UK
Government Spending 2.0 2.0 2.0
Global economy, including the Eurozone, picking
Fixed Investment 4.0 6.0 5.0
up
However, Brexit is a major challenge for economy
Core Fixed Investment* 7.0 6.0 5.0
Sharp fall in sterling impacts exports to UK &
Exports 4.0 4.0 4.0
tourism Imports 2.0 4.3 4.2
Irish GDP grew by a strong 5.1% in 2016 HICP Inflation (%) 0.3 1.0 1.3
Irish GDP growth generally forecast at around 4.5% Unemployment Rate (%) 6.2 5.2 4.7
for 2017 and circa 3.5% in 2018 Budget Balance (% GDP) -0.3 -0.2 -0.1
ESRI estimate long-term growth rate of economy at
*Excludes investment in aircraft and intangibles
around 3.5% in 2016-2025 periodRisks to the Irish economic recovery
Main risks to Irish recovery no longer internal but external, in particular Brexit
Brexit major issue for Ireland given its strong trading links with UK and sharp fall by
sterling
Possibility of reduced FDI from US if Trump administration slashes corporate taxes
Questions around Irish corporation tax regime (Apple ruling, calls for tax harmonisation
in EU) could impact FDI, but Ireland can veto any proposed EU tax changes
Supply constraints in new house building activity, which is recovering at a slow pace with
output still at very low levels
Competitiveness issues - high Dublin house prices, high rents, high personal taxes
Continuing credit contraction – fewer banks, tighter credit conditions, on-going
deleveraging
Note: All Irish data in tables are sourced from the CSO unless otherwise stated. Non-Irish data are from the IMF, OECD and Thomson Financial. Irish forecasts are from AIB
Economic Research Unit. This presentation is for information purposes and is not an invitation to deal. The information is believed to be reliable but is not guaranteed. Any
expressions of opinions are subject to change without notice. This presentation is not to be reproduced in whole or in part without prior permission. In the Republic of Ireland it is
distributed by Allied Irish Banks, p.l.c. In the UK it is distributed by Allied Irish Banks, plc and Allied Irish Banks (GB). In Northern Ireland it is distributed by First Trust Bank. In the
United States of America it is distributed by Allied Irish Banks, plc. Allied Irish Banks, p.l.c. is regulated by the Central Bank of Ireland. Allied Irish Bank (GB) and First Trust Bank
are trade marks used under licence by AIB Group (UK) p.l.c. (a wholly owned subsidiary of Allied Irish Banks, p.l.c.), incorporated in Northern Ireland. Registered Office 92 Ann
Street, Belfast BT1 3HH. Registered Number NI 018800. Authorised by the Prudential Regulation Authority and regulated by the Financial Conduct Authority and the Prudential
Regulation Authority. In the United States of America, Allied Irish Banks, p.l.c., New York Branch, is a branch licensed by the New York State Department of Financial Services.
Deposits and other investment products are not FDIC insured, they are not guaranteed by any bank and they may lose value. Please note that telephone calls may be recorded
in line with market practice.You can also read