São Paulo City Profile - Frost & Sullivan
←
→
Page content transcription
If your browser does not render page correctly, please read the page content below
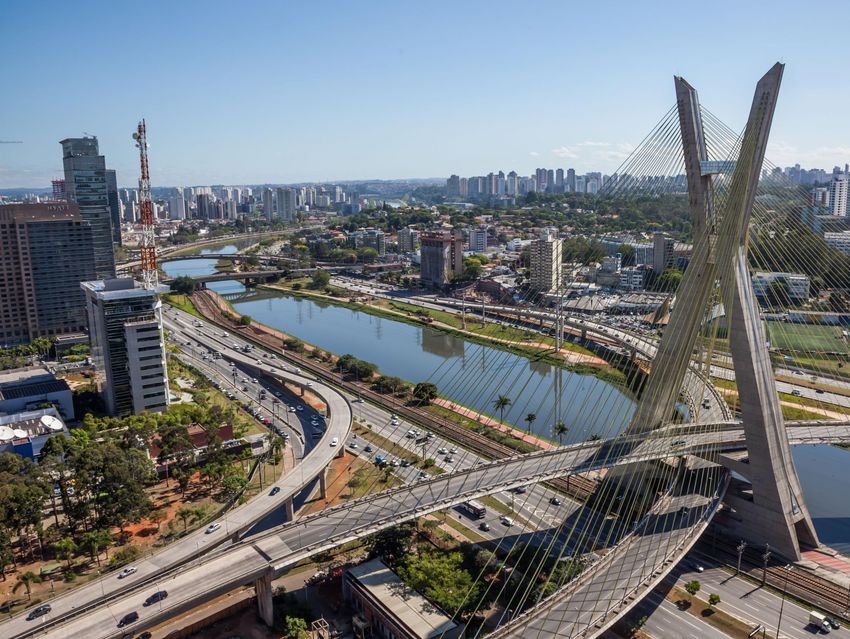
São Paulo City Profile

                    1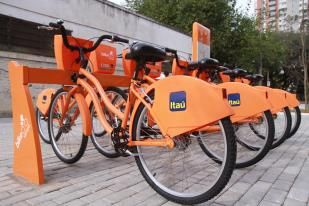
São Paulo – Building a Smart & Equitable City
São Paulo City, the most populous city in Brazil. It is also the 7th most populous city in the world and in the
metropolitan areas there are abut 20 million inhabitants.

       Population                  Public Transport                 Private Vehicles                New Mobility

 21.3m                          41%         (modal share)         5,914,433(parc)               ~ 10         operators
 • Highest population           Nowadays the city has buss        Car ownership in the city     • Carsharing – 1,7KK
   density in Brazil            pass cards that facilitated the   remains very high. New          members
 • 6,999 people live in         transportation and expected       car sharing and related       • Carpool – 250k
   each square mile             to see digitalization soon        business models are             members
                                                                  expected to impact the        • Ridehailing – 500k
                                                                  market in the close future.     users

    Digital Strategy                  Public Policy                    EV Charging                    Smart City

Mobility Law (12.587 / 2012):    Progressive                      20      public charge         Ranked   80th         on the
Calls for the need of an        São Paulo has no Zero Carbon      stations in the city run by     global list of smart city
urban mobility plan and also    deadline. However, actions
highlights innovation in
private individual transport
                                have started to access
                                restriction in some avenues on
                                                                  at least   4   different      readiness. Ranked    1st
                                Sundays “vehicle free zones”      providers                              in Brazil

                                                                                                                              2
São Paulo at a Glance

                                                        25,000      Population (000s)       Population Density        8,000

                                                        20,000                                                        7,500

                                                        15,000                                                        7,000

                                                        10,000                                                        6,500

                                                         5,000                                                        6,000

                                                            0                                                         5,500

                                                                 2010
                                                                 2011
                                                                 2012
                                                                 2013
                                                                 2014
                                                                 2015
                                                                 2016
                                                                 2017
                                                                 2018
                                                                 2019
                                                                 2020
                                                                 2021
                                                                 2022
                                                                 2023
                                                                 2024
                                                                 2025
                                                                          Sao Paulo overview

        Age split of São Paulo’s population
                                                                 Boroughs: 31
                  0 – 14 yrs   16 – 64 yrs    65+ yrs
                                                                 Area size: 3,043km2
                                                                 Level of elevation: 760m
                    12%           34%           3%
                                                                 Urban Structure: Zonal
                                                                 Population: 12,106,920 (2017)
                    12%           35%           4%               Density: 6,999 inhabitants per km2
                                                                 Physical activity: On average, 30 mins per
   Population        24%          69%           7%               day are spent in light physical activity

                                                                                                 Source: Frost & Sullivan

                                                                                                                    3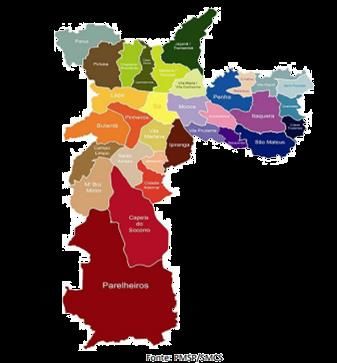
São Paulo Transportation Mode Shares
Long term trends for the different modes of transport available.

                   1%                                                                        2%
          5%
        32%
                          53%                                                                      42%
                                                                                      41%

             13%                                                                             13% 2%
                   1%

                   2000                                                                     2016

       Car                      Public Transport    Taxis and Private Hire Vehicles   Walking           Cycling

                    • The rise of apps such as Uber, Cabify, EasyTaxi and 99Taxi has led to a steady decrease in car
    KEY               usage
 TAKEAWAY           • Cycling has increased a great amount mainly due to investments in bicycle paths
                    • Walking has stayed constant as expected.

                                                                                                        Source: Frost & Sullivan

                                                                                                                           4
Snapshot of Transportation Modes – Motorization rates & Fares
Taxis and private hire vehicles have seen large growth – due to increased investment and interest in ride
hailing apps.

                                                  Total number of Buses*              Total Number of Taxis and PHVs
                                                                      15.00
   Revenue Generated in 2016                                      14.65
                                                    14.2614.2214.30
                                                13.93
     Bus:€$36
           652.2
              million
         million                                                                                         57,000
     Subway: $667 million

     Urban Rail: $684 million

                                                                                                                  Standard Fares
Urban Rail and                               0.570.580.57
                                         0.56
metro Utilization                                                                                                           $ 1,18
                                     0.54
                                 0.53
                             0.53
                         0.52
                                                                              5,254,660                                     $ 1,18

 4,000,000
 passengers per                                                                                                             $ 1,85
      day
                                                                                                                            $ 10,3 per
                        Motorization Rate per 1000*                Total Two-Wheeler Vehicles                               hour
                                                                                  * - Numbers are in thousands; Source: Frost & Sullivan,

                                                                                                                                    5
Conventional Vehicle Parc

 4,500,000                                                                                    7,000,000
 4,000,000
                                                                                              6,000,000
 3,500,000
                                                                                              5,000,000
 3,000,000
                                                                                                                LCV Diesel
 2,500,000                                                                                    4,000,000
                                                                                                                LCV petrol
 2,000,000                                                                                    3,000,000         PV Diesel
 1,500,000                                                                                                      PV Petrol
                                                                                              2,000,000         PV total
 1,000,000
                                                                                              1,000,000         LCV total
  500,000
        0                                                                                     0
             2007   2008    2009    2010    2011    2012    2013     2014    2015    2016

                • By investing more in public transport and encouraging alternative forms of transport such as
                  cycling and car sharing, the São Paulo City Council has been able to reduce the motorization rate
   KEY            over the past few years.
TAKEAWAY        • The PV parc is expected to grow towards the future, the city remains a good opportunity land for
                  vehicle ownership
                • Due to Flex (Alcohol and Petrol) engines the only Petrol cars have drastically decreased

                                                                                                    Source: Frost & Sullivan

                                                                                                                       6
New Energy Vehicle Parc

            0.7
Thousands

                                                                             Total number of
            0.6                                                              charging points
                                                                             in São Paulo
            0.5
                                                                             City:
            0.4
            0.3
                                                                                               20
            0.2
            0.1
              0
                           2013    2014             2015            2016
                                                                             Charging Point Operators
                  Hybrid      EV

            Types of
                                          Number of Public
            Connector Available:
                                          Charging Points:
                                                15
            AC:                                                               BMW Group Brasil,
            - Slow (7kW)
            - Fast (22kW)
                                             Number of                        Neosolar Energia,
                                          Private Charging   Average Price
            DC:
            - Tesla (120kW)
                                               Points:         per kWh:       AZ Energy and
                                                  5
            - CHADeMO (50kW)                                     $0.07        Schneider Electric
            - CCS (50kW)
                                                                                        Source: Frost & Sullivan

                                                                                                           7
Technology Trends and Outlook
High adoption rates of advanced technology imply growing relevance of smart city, connected cars, and
new mobility solutions
Mainly present in private parking
lots and shipping malls
5G
Parking
4 street level
sensors 715,000
pollution
monitoring Pollution
streetlights 87% Roll out as early as
stations sensors
Key
Lighting of population are 2020- trials
internet users currently taking
figures
place
6,000 traffic Intelligent Opened in
lights Traffic 1982 the
Traffic Control
management monitoring
Centre
center of
SP and
Key
suppliers digitalized
in 20014
$
• Siemens, CET, São Paulo City
municipality
57% $3.8 bn
of São Pauloers eCommerce
own a smartphone market potential
Source: Frost & Sullivan
8São Paulo Strategic Plan 2015 The Strategic Plan 2015 is a long term strategy with the
aim of achieving 13 goals; the medium-term initiatives are targeted to being delivered by 2016, 2020,
2024 and 2028.
SP - PlanMob
• Universal accessibility
• optimize the use of • reduce average
for pedestrians,
the road system; travel time;
• Universal accessibility
• implement • increase the use of
for the mobility
environment the collective in the
systems un the urban
appropriate to the city's transportation
area matrix;
movement of the
active modes;
Expand travel Improve access Protect the
choices for all for underserved environment and
São Pauloers communities quality of life
• encourage the use of • Improve freight • contribute to the
active modes; logistics; policy of reducing
• reduce atmospheric • consolidating social inequalities;
emissions; democratic • reduce the number of
• make the macro management in the accidents and deaths
accessibility of the improvement of in traffic;
city more urban mobility;
Maintain and
homogeneous. Eliminate traffic
Support
São Paulo City Strategic Plan protect DOT’s deaths and
economic growth
physical assets injuries
Key Takeaway: The São Paulo government in partnership with other government agencies and the private sector is
advancing towards its vision of a safe, sustainable, equitable and efficient transportation network based on its Strategic
Plan 2015 policies and the core principles of the PlanMob long-term plan
Source: Frost & Sullivan
9Infrastructure & Mobility Roadmap: São Paulo City
It was planned for significant capital investments which include a number of initiatives for improving the
city’s infrastructure and mobility with focus on sustainability and greater efficiency
Key Targets & Investments
São Paulo City historic Its’ highly expected that
$16 investment is usually 5% of 5% the city will remain it’s
billion the whole budget of the city budget level of investment in the
in mobility and mobility and
transportation. In 2016 this transportation for the
numbers was 16bn next years
• Built Sidewalks
250.000M² per year;
• Building new cycling • Increase the accessibility
paths and racks; of the sidewalks; • TO 2030
• Build new bus lanes • Increase the use of Bike sharing; • Consolidate the cycling • Monitoring the road system
• Research about walking
in the city and structure • 3000 cruises operating in
• Build new accessibility;
connected routes • Bicycles paths in Bridges and • Updated the law for real time;
• New bus terminals and lanes;
private transportation • 2676 crossings operating
viaducts • Integrate in the private
in fixed time with
• Revise the legislation of transportation means mid-
Centralized monitoring;
transportation private vehicles vehicles
• 1100 km of fiber optic
• Reduce the number of network - cimu;
• Build terminals and mini- • Reduce the number of • 1680 cctv cameras;
terminal for load deaths in the traffic to deaths in the traffic to
3/100 thousand and • 119 variable message
transportation and 6/100 thousand panels;
stocking inhabitants reduce the average speed
of roads
2015 Short-term Milestones
2020 Medium-term Milestones
2030
*MTA – Metropolitan Transportation Authority Source: Frost & Sullivan
10São Paulo’s Data and Digital Strategy
The digital strategy involves collecting and providing open data, improving online tools and websites and
making sure everyone has access to these resources through having internet connectivity.
Implement a unique São Paulo’s Digital City Strategy Examples and Trials
identification system
for the citizen as a 8 goals of the municipality
patient, through the Digitalization of the data and process
effective adoption of Operational
the SUS card. integration of the
Civil Guard
Communications São Paulo is also investing in the digitalization of the
Center Metropolitan, municipality process and databases.
To implement, in the CETEL and the To transform the Such as: Ensure that 100% of the data published by the
Municipal Schools of Operations Center of current “attention” City Hall are available in an open format, integrating basic
Elementary the Military Police, places of the accessibility tools; Ensure that 100% of new processes
Education, The COPOM municipality into reducing costs and processing times.
Pedagogical Web and functional structures
make them available for service within the
via WiFi to Poupatempo São Paulo, the connected city
student equipment Implement a Mobility Standard
Control and
Operation Center Digitalization of the city as a infrastructure
project
Create an Integrated Infrastructure projects of the public transport road flow and
Modernize the five
Operations Center for integration of the various modalities for favoring safe, fast,
Area Traffic Centers
the Municipality affordable and sustainable inter modality
Objective: Increased capacity of the structural system to
transport passengers with speed, punctuality, regularity
Deploy Intelligent
and safety, guaranteeing the other attributes of transport
Transportation
quality (comfort, low fares, respect for the principles of
Systems
sustainability, technological relevance and universal
accessibility)..
Source: Frost & Sullivan
11Freight in São Paulo City
Freight makes up 2% of São Paulo City’s total road traffic – the effects of which greatly impact the city’s
mobility landscape
Freight traffic as a percentage of total road traffic
3% Logistics Regulation:
2%
Level – Low
2%
Sao Paulo has access
restrictions in certain part of
1%
the city .
1%
0%
2008 2009 2010 2011 2012 2013 2014 2015 2016 2017
LCV Rail
Modal
4 Split of
Freight
Intermodal
transport hubs Traffic Truck
Truck
Source: Frost & Sullivan
12Snapshot of New Mobility Services Offered in São Paulo City
Services such as ride sharing and ride hailing mean São Paulo City has the capability and infrastructure to
support next generation mobility schemes such as MaaS.
Car sharing – 60 cars Ride hailing – 50,000 cars
Ride sharing Bike sharing – 7,400 bikes
RJ SP
Source: Frost & Sullivan
13Key quotes
São Paulo is a city in permanent movement.
However, it faces major daily problems with
traffic and travel.
The Master Plan addresses urban mobility
based on the integration and articulation
between different modes of transportation. It It's not just an application that helps you save
establishes minimum and permanent money, but rather establish contacts as well. In
resources to expand the network and qualify 2016 we had more than 1 million seats in Brazil.
public transport and non-motorized means of The average travel in Brazil is 250 km.
transport (cycle system and pedestrian The Can of the car is changing. But people will
circulation), less polluting. It also recognizes not stop having a car, because, it is practical.
new components of the urban mobility system Especially if you have feilhos. Now, we believe
(logistics, waterway and car sharing system) that the use of the car will be more shared.
for structuring a more comprehensive, efficient
and environmentally balanced shift matrix.
Frederic Ollier, Blah Blah Car
Government of São Paulo
Source: Frost & Sullivan
14São Paulo as a Smart City
There are many digital and smart city related initiatives going in Sao Paulo and objectives with actions plans
being consolidated by the city government.
Smart Energy Smart Waste Smart Water The London
Datastore
The market share for The mayor has set a Thames Waters plans
smart energy could on investing A free and open data
reach up to
50% £1.3bn sharing portal with
more than
$2.1bn recycling target to be
on smart meters
by 2020.
reached by 2020 and
has specified the before 2050 –
installing roughly
700
importance of data sets, providing
moving toward a 900,000 meters.
stats for transport,
circular economy environment etc.
Sao Paulo Smart Transport
municipality gives in ‘Surface Intelligent
Market
Intelligent mobility is to
a website a huge Transport Systems’ Increase by 10% the Potential
amount of open data CET – Engineer participation of active modes of
about the public Company of Traffic has a displacement (cycling, walking
transport system and intelligent center in Sao and other active modes) by $1,3
related information Paulo, restored in 2014 2020 and also Reduce the Billion
available in the to monitor more than 1 number of road deaths to equal
Open Data SP million security cameras. to or less than 6 per 100,000 by
the same time Source: Frost & Sullivan
15You can also read