Evidence based decision making and COVID-19: what a posteriori probability distributions speak - Research ...
←
→
Page content transcription
If your browser does not render page correctly, please read the page content below
Evidence based decision making and COVID-19:
what a posteriori probability distributions speak.
Sudhir Bhandari
SMS Medical College and Hospitals, Jaipur, Rajasthan, India
Amit Tak ( dramittak@gmail.com )
SMS Medical College and Hospitals, Jaipur, Rajasthan, India https://orcid.org/0000-0003-2509-2311
Jyotsna Shukla
SMS Medical College and Hospitals, Jaipur, Rajasthan, India
Bhoopendra Patel
Government Medical College, Barmer, Rajasthan, India
Ajit Singh Shaktawat
SMS Medical College and Hospitals, Jaipur, Rajasthan, India
Sanjay Singhal
SMS Medical College and Hospitals, Jaipur, Rajasthan, India
Jitendra Gupta
SMS Medical College and Hospitals, Jaipur, Rajasthan, India
Shivankan Kakkar
SMS Medical College and Hospitals, Jaipur, Rajasthan, India
Amitabh Dube
SMS Medical College and Hospitals, Jaipur, Rajasthan, India
Sunita Dia
Medstar Washington Hospital Center, Washington DC-20010, USA.
Mahendra Dia
North Carolina State University, Raleigh, NC 27695-7609, USA
Todd C Wehner
North Carolina State University, Raleigh, NC 27695-7609, USA
Research Article
Keywords: a posteriori probability distributions, COVID-19, epidemiology, evidence based decision making,
public health, SARS CoV-2.
DOI: https://doi.org/10.21203/rs.3.rs-40390/v1
Page 1/15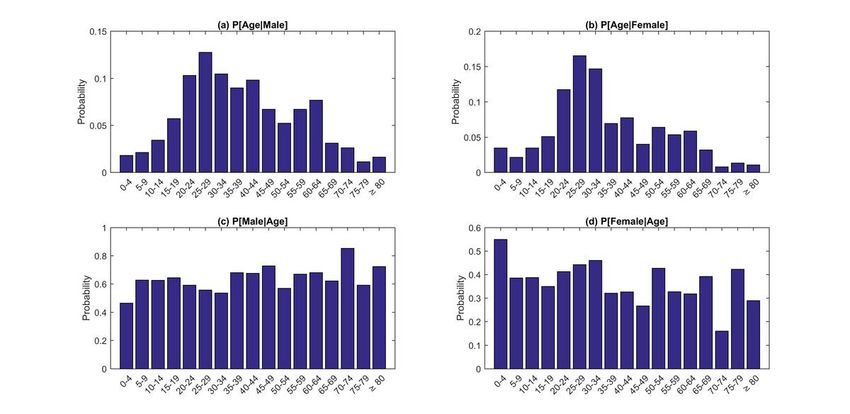
License: This work is licensed under a Creative Commons Attribution 4.0 International License.
Read Full License
Page 2/15
Abstract
Background: In the absence of a vaccine for coronavirus disease-19, the management of the current
pandemic revolves around public health measures such as social distancing, lockdown, and contact
tracing. A number of epidemiological models are used in decision making and for generating research
intelligence. The models require information regarding the structures of social contact between different
ages and genders. The present study fosters evidence-based decision making by estimating various a
posteriori probability distributions from data of COVID-19 patients.

Patients and Methods: In this retrospective observational study, 987 real-time RT-PCR SARS CoV-2
positive patients from SMS Medical College, Jaipur, India were enrolled after approval of the institutional
ethics committee. The data regarding age, gender, and outcome were collected from case sheets. The
univariate and bivariate distributions of COVID-19 cases with respect to age, gender, and outcome were
estimated. The age distribution of COVID-19 cases was compared with the age distribution of general
population using goodness of t c2 test. The independence of attributes in bivariate distributions was
evaluated using the chi square test for independence.

Results: The age group ‘25-29’ has shown highest probability of COVID-19 cases (P[25-29] = 0.14, 95% CI:
0.12- 0.16). The men (P[Male] = 0.62, 95%CI: 0.59-0.65) were dominant sufferers. The most common
outcome was recovery (P[Recovered] = 0.79, 95%CI: 0.76-0.81) followed by admitted cases (P[Active]=
0.13, 95%CI: 0.11-0.15) and death (P[Death] = 0.08, 95%CI: 0.06-0.10).

The age distribution of COVID-19 cases differs signi cantly from the age distribution of the general
population (c2 = 399.04, p < 0.001). The bivariate distribution of COVID-19 across age and outcome was
not independent (c2 =106.21, df = 32, p < 0.001).

Conclusion: The age, gender, and outcome distributions helps in evaluating disease dynamics and the
social structure of the community. The knowledge of patterns of disease frequency helps in optimum
allocation of limited resources and manpower. The study provides information for various
epidemiological models, to decide the duration of lockdown.

Introduction
According to the World Health Organization report, 8,061,550 con rmed cases and 440,290 con rmed
deaths due to coronavirus disease–19 (COVID–19) were recorded by 18 June, 2020 across 216 countries
of the world (WHO, 2020). In the absence of a vaccine, the control of disease pandemic includes public
health measures such as lockdown and social distancing. The effectiveness of social distancing and the
duration of lockdown was investigated using various mathematical models. A number of epidemiological
models including SIR used age structured data and social contact matrices to study the progress of the
COVID–19 epidemic (Singh R, 2020). The patterns of disease frequency distributions in a community is a
function of cultural habits and social contacts. The lesser frequency of occurrence of COVID–19 in
children might be due to their having fewer outdoor activities and less international travel (Lee PI, 2020).
                                                    Page 3/15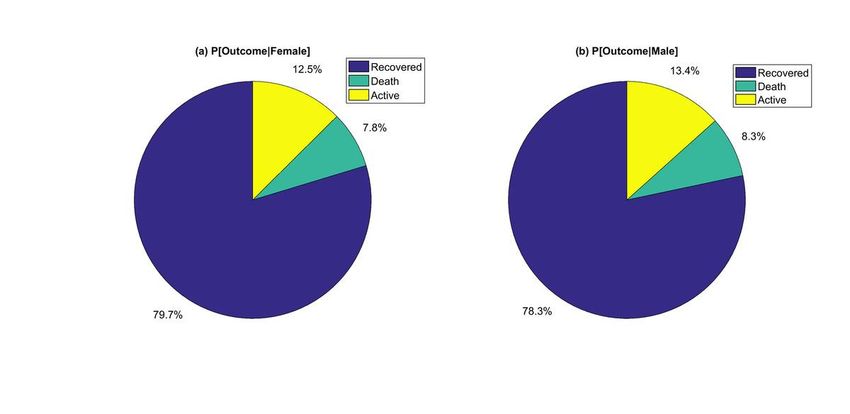
Furthermore, the effects of public health measures such as lockdown, social distancing, and personal
protective measures are re ected in the probability distributions. The probability distributions of various
predictors of mortality risk such as random blood sugar over ages reveals causes of mortality
(Bhandari,2020). The objective of the present study is the estimation of probabilities for univariate and
bivariate distributions of COVID–19 cases, over different ages and genders, as observed in paitents in
tertiary care hospitals in Rajasthan.

Patients And Methods
In this hospital-based retrospective observational study, 987 real-time RT PCR, SARS CoV–2 positive
cases from SMS Medical College and Hospital, Jaipur, Rajasthan, India were enrolled. Among the
patients, 129 were admitted, 80 had died and, 778 had recovered from COVID–19.

Data Collection
The age, gender, and outcome data were recorded from the case sheets of the patients. The age
distribution of population and age-speci c mortality rates were sourced from the government of India
repository (Census of India, 2020). Observations were excluded if there were missing data of age, gender
or mortality.

Data analysis
The univariate discrete probability distributions of age, gender, and outcome were estimated. P[Death],
expressed as a percent is also known as case fatality rate (Epidemiology Working Group for NCIP
Epidemic Response, 2020)

The bivariate discrete probability distribution of age and gender, age and outcome, and gender and
outcome were also estimated. The conditional probability distributions of P[Age | Outcome], P[Outcome |
Age], P[Age | Gender], P[Gender | Age], P[Gender | Outcome] and P[Outcome | Gender] were obtained using
the law of conditional probability:

where P[C | D] is the conditional probability of occurrence of event C when event D has already occurred,
P[C∩D] is the probability of occurrence of event C and D simultaneously and P[D] is the probability of
occurrence of event D (Indrayan, 2020).

                                                  Page 4/15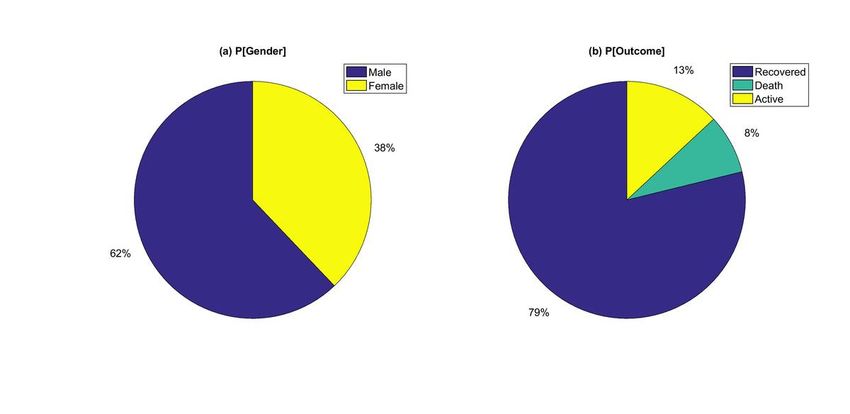
The age distribution of COVID–19 was compared with the general age distribution. Comparisons were
also made for means of age between various levels of gender and outcome. Finally, we compared the
outcome among various levels of gender and age groups.
Statistical analysis
The quantitative variables were expressed as mean and standard deviation, estimates were expressed as
95% con dence intervals and comparison was performed using two tailed Student t-test. The qualitative
variables were expressed as proportions and compared with chi-square test. The goodness of t chi-
square test was used to test distributions. The statistical level of signi cance was considered at 5%. The
statistical analyses were done using JASP software (JASP Team) and MATLAB 2016a (MATLAB Team).
Results
The univariate probability distribution of age (P[Age]) of coronavirus disease–19 cases has showed
maximum probability in the ’25–29’ age group followed by the ’30–34’ age group and there was a
minimum probability in the ’75–79’ age group. The occurrence of COVID–19 cases across age was
signi cantly different (x2=411.53, df = 16, p < 0.001) (Figure 1 and Table S1). The age distribution of
COVID–19 cases differed signi cantly with age distribution of the population (x2=399.04, p < 0.001)
(Figure 2). The probability of men (P[Male] = 0.62, 95% CI: 0.59–0.65) suffering from COVID–19 was
higher than for women (P[Female] = 0.38, 95% CI: 0.35–0.41) (Figure 3 Panel A and Table S2). The
probability of recovered cases (P[Recovered] = 0.79, 95%CI: 0.76—0.81) was higher than for death cases
(P[Death] = 0.08, 95%CI: 0.06–0.10) or admitted cases (P[Active] = 0.13, 95% CI: 0.11—0.15) (Figure 3
Panel B and Table S3).
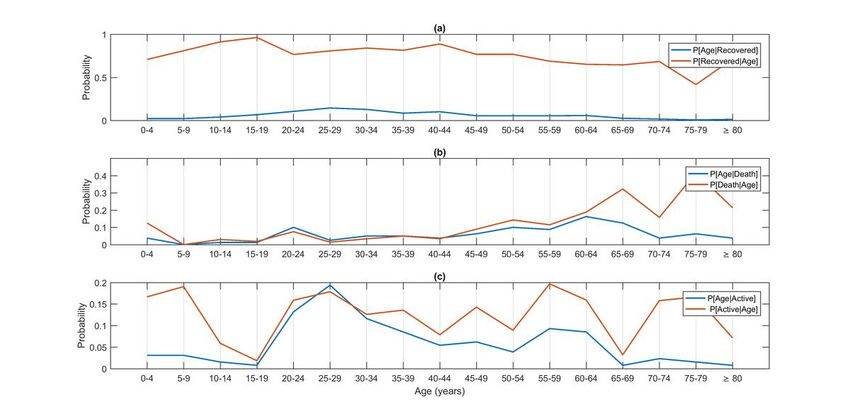
The bivariate probability distribution of age and gender showed males in the ’25–29’ age group
constituted maximum cases of COVID–19 (Table S4). The conditional probability of age for both gender
(P[Age | Male] and P[Age | Female]) were highest in the ’25–29’ age group (Figure 4 Panel A and Panel B).
The distribution of COVID–19 cases across age and gender was independent (x2=df = 16, p = 0.17).
The distribution of COVID–19 cases across age and outcome was not independent (x2=df = 32, p <
0.001) (Figure 5 Panel A). The conditional probability distribution of age for given deaths (P[ Age | Death])
was highest in the ’60–64’ age group, but the conditional probability for death for a given age ( P[ Death |
Age]) was highest in the ’75–79’ age group (Figure 5 Panel B and Table S5).
The bivariate probability distribution of gender and outcome showed the highest proportion of
coronavirus cases were male and recovered (Table S6). The distribution of COVID–19 cases across
gender and outcome was independent (x2=df = 2, p = 0.88). The conditional probabilities for males for a
given outcome were higher than for females (Figure 6 Panel A-C).The conditional probabilities of
Page 5/15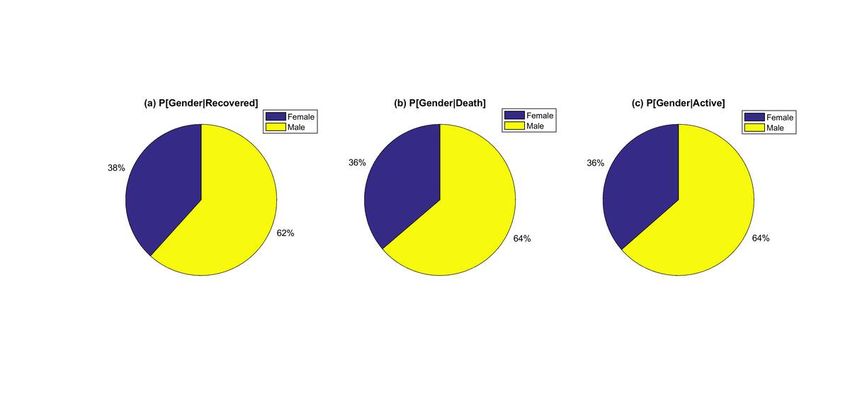
outcome for a given gender were higher for recovered cases, followed by active cases and death. (Figure
7 Panel A-C).

Discussion
Management of the COVID–19 pandemic with limited resources and manpower is a challenging task for
public health authorities. The knowledge of disease patterns helps in decision making as well as for
optimum allocation of resources. The observed disease patterns affected by biological susceptibility,
social contact structure, and cultural habits. The rate of evolution of epidemic curve in Rajasthan is
among the top eight states of India (Bhandari,2020). The mean age of COVID–19 cases was 37.08 years
in Rajasthan, which was lower than the mean age-based on 65 research articles (Adhikari SP,2020;
Gandhi PA, 2020; Kakkar, 2020). The age distribution of the general population of Rajasthan was right
skewed. The mode of the general age distribution curve was the ’10–14’ age group. While the mode of the
age distribution of COVID–19 cases occur at ’25–29’ age group. This could be explained by the decision
of early closure of schools and colleges by the government (Times of India, 2020). The lower frequency
of occurrence of COVID–19 in children might be the result of fewer outdoor activities and less
international travel (Lee PI, 2020). A national study from China on 2135 pediatric patients showed no
signi cant difference in susceptibility across age groups, although clinical manifestations in children
were less severe (Dong Y, 2020). The study showed men constitute more cases of COVID–19, which
might be due to higher independence as compared to females (Ram U, 2014; Adhikari SP). However, the
sex ratio of Rajasthan is 926 females per 1000 males (Census of India, 2011). The case fatality rate was
8.1% which is more than reported for China, i.e., 7.2% (Dhar Chowdhury S, 2020).The higher rate may be
due to fewer testing facilities and less contact tracing (Rajagopalan S, 2020). In an epidemiological study,
COVID–19 cases in Maharashtra and New Delhi also showed the dominance of males and no
association between gender and mortality. The age-speci c mortality rate was also high among patients
aged 61–70 years(19.2%), 71–80 years (15.8%) and above 80 years (13.9%) as in our study (Figure 5.
Panel B, red line graph).

The P[Death|Age] suggests the probability of death in older age groups was higher, but P[Age|Death]
suggests that the need for life saving equipment was equal in all age groups. Similarly, the P[Active|Age]
suggests that the requirement for hospital beds was equal over age groups, but P[Age|Active] suggests
that more hospital beds were occupied by younger age groups.

In the Indian context,we collated few recommendations based on estimated a posteriori probability
distributions:

Recommendation 1. The probability of death in elderly group P[ Death| > 60] is higher. The people above
60 years should stay at home.

Recommendation 2. Number of active cases helps in the estimation of requirements for hospital beds
and medical equipment. The P[Age|Active] suggests most of the hospital beds are occupied by younger
age groups. As suggested P[Death|Age] that younger age groups have a low mortality risk, management
                                                 Page 6/15
strategies for mild cases might include home isolation. That would free up more hospital beds for the
elderly population who are at higher risk of mortality.
Recommendation 3. The case fatality rate is quite high in our study, possibly due to low COVID–19
testing. Thus, there is a need to increase COVID–19 testing to improve the estimation of fatality rate.
Furthermore, we recommend the involvement of experts from multiple elds such as operations research,
epidemiology, economics, management and sociology in policy making.
Conclusion
The patterns of COVID–19 cases and hospital outcome across age and gender form the basis of
evidence-based decision making in public health domain. Additional demographic, clinical and laboratory
data permit us to determine the magnitude of medical resources and manpower required along with
public health measures.
Limitations Of The Study
The study estimates probability distributions from the early dataset of COVID–19 cases. As decisions on
public health measures like lockdown, contact tracing, and testing guidelines are modi ed, those in turn
affect the patterns of disease. Thus,real-time estimations are required and should be adjusted for the
confounding effects.
Abbreviations
CI: con dence interval
COVID–19: coronavirus disease–19
P[Age]: discrete probability distribution of age
P[Gender]: discrete probability distribution of gender
P[Outcome]: discrete probability distribution of outcome
P[Age | Gender]: conditional discrete probability distribution of age for a given gender
P[ Gender | Age]: conditional discrete probability distribution of gender for a given age
P[Age | Outcome]: conditional discrete probability distribution of age for a given outcome
P[ Outcome | Age]: conditional discrete probability distribution of outcome for a given age
P[Gender | Outcome]: conditional discrete probability distribution of gender for a given outcome
Page 7/15P[Outcome | Gender]: conditional discrete probability distribution of outcome for a given gender
SARS CoV–2: severe acute respiratory syndrome coronavirus 2
Declarations
Ethics approval and consent to participate - The present study used de-identi ed data of patients and the
ethical approval has been taken from Institutional Ethics Committee.
Consent for publication- Not applicable
Availability of data and materials - Data will available on reasonable request from corresponding author.
Competing interests- The authors declare that they have no known competing nancial interests or
personal relationships that could have appeared to in uence the work reported in this paper.
Funding- No funds were obtained from anywhere.
Authors’ contributions- All authors contributed equally.
Acknowledgements- The contributors of the article acknowledge the invaluable inputs of Departments of
Medicine, Community Medicine, and Microbiology of SMS Medical College and Attached Hospitals,
Jaipur, and the Government of Rajasthan for their ongoing support against the menace of the global
pandemic of COVID‐19.
References
1. Adhikari SP, Meng S, Wu Y-J, Mao Y-P, Ye R-X, Wang Q-Z, et al. Epidemiology, causes, clinical
manifestation and diagnosis, prevention and control of coronavirus disease (COVID-19) during the
early outbreak period: a scoping review. Infectious Diseases of Poverty [Internet]. 2020 Mar 17;9(1).
Available from: http://dx.doi.org/10.1186/s40249-020-00646-x
2. Bhandari S, Shaktawat AS, Tak A, Patel B, Gupta K, Gupta J, et al. A multistate ecological study
comparing evolution of cumulative cases (trends) in top eight COVID-19 hit Indian states with
regression modeling. Int J Acad Med [serial online] 2020 [cited 2020 Jun 30];6:91-5. Available from:
http://www.ijam-web.org/text.asp?2020/6/2/91/287965
3. Bhandari S, Shaktawat AS, Tak A, Patel B, Shukla J, Singhal S, et al. Logistic regression analysis to
predict mortality risk in COVID-19 patients from routine hematologic parameters. Ibnosina J Med
Biomed Sci [serial online] 2020 [cited 2020 Jun 30];12:123-9. Available from :
http://www.ijmbs.org/text.asp?2020/12/2/123/288204
4. Dhar Chowdhury S, Oommen AM. Epidemiology of COVID-19. Journal of Digestive Endoscopy
[Internet]. 2020 Mar;11(1):03–7. Available from: http://dx.doi.org/10.1055/s-0040-1712187
Page 8/155. Dong Y, Mo X, Hu Y, Qi X, Jiang F, Jiang Z, Tong S. Epidemiology of COVID-19 among children in
China. Pediatrics. 2020 Apr 1; Available from: https://doi.org/10.1542/peds.2020-0702
6. Gandhi PA, Kathirvel S. Epidemiological studies on coronavirus disease 2019 pandemic in India: Too
little and too late? Medical Journal Armed Forces India [Internet]. 2020 May; Available from:
http://dx.doi.org/10.1016/j.mja .2020.05.003
7. Epidemiology Group of the New Coronavirus Pneumonia Emergency Response Mechanism of the
Chinese Center for Disease Control and Prevention. Epidemiological characteristics of the new
coronavirus pneumonia[J/OL]. Chinese Journal of Epidemiology, 2020,41 (2020-0217).
http://rs.yiigle.com/yufabiao/1181998.htm. DOI: 10.3760/cma.j.issn.0254-6450.2020.02.003
8. Indrayan A and Malhotra RK. Medical biostatistics. 4th In Relationships : Qualitative Dependent, CRC
Press, Taylor & Francis Group, Florida, USA. 2018 pp. 181-182.
9. JASP Team, JASP version 0.12.2 [Computer software] University of Amsterdam, Neherlands ;
Copyright 2013-2019
10. Kakkar S, Bhandari S, Shaktawat A, Sharma R, Dube A, Banerjee S, et al. A preliminary clinico-
epidemiological portrayal of COVID-19 pandemic at a premier medical institution of North India.
Annals of Thoracic Medicine [Internet]. 2020;15(3):146. Available from:
http://dx.doi.org/10.4103/atm.ATM_182_20
11. Lee PI, Hu YL, Chen PY, Huang YC, Hsueh PR. Are children less susceptible to COVID-19?. Journal of
Microbiology, Immunology, and Infection. 2020 Feb 25.
12. MATLAB Team, Statistics and Machine Learning Toolbox 10.2, Classi cation Learner App, MATLAB.
version 0.0.341360 (R 2016a). Natick, Massachusetts : The Mathworks Inc.
13. Singh R, Adhikari R. Age-structured impact of social distancing on the COVID-19 epidemic in India.
arXiv preprint arXiv:2003.12055. 2020 Mar 26.
14. Times of India https://timeso ndia.indiatimes.com/home/education/news/govt-announces-closure-
of-all-educational-establishments-across-india-till-march-31/articleshow/74659627.cms Accessed :
19 Jun 2020
15. Ram U, Strohschein L, Gaur K. Gender Socialization: Differences between Male and Female Youth in
India and Associations with Mental Health. International Journal of Population Research [Internet].
2014;2014:1–11. Available from: http://dx.doi.org/10.1155/2014/357145
16. Rajagopalan S, Tabarrok AT. Pandemic Policy in Developing Countries: Recommendations for India.
SSRN Electronic Journal [Internet]. 2020; Available from: http://dx.doi.org/10.2139/ssrn.3593011
17. Census of India 2011 . Government of India Accessed on 19 Jun 2020.Available from:
https://censusindia.gov.in/2011-prov-results/paper2/data_ les/Raj/7-popu-10-19.pdf
18. World Health Organization, Coronavirus disease- 2019 Accessed on : 18 Jun 2020. Availabe from:
https://www.who.int/emergencies/diseases/novel-coronavirus-2019
Figures
Page 9/15Figure 1
Box plot of univariate discrete age distribution of COVID-19 cases (N = 987) with error bars (blue) at 95%
con dence intervals in the state of Rajasthan.
Figure 2
Stem plot of age distribution of observed (blue dots) cases of COVID-19 and expected cases (red dots) in
the state of Rajasthan.
Page 10/15Figure 3
Pie charts of univariate discrete probability distribution of COVID-19 cases (N = 987) in the state of
Rajasthan (a) P[Gender] (b) P[Outcome].
Page 11/15Figure 4
Histogams of conditional probability distributions of age and gender of COVID-19 cases (N = 987) in the
state of Rajasthan. Panel A: P[Age|Male], Panel B: P[Age|Female], Panel C: P[Male|Age], and Panel D: P[
Female|Age].
Page 12/15Figure 5
Line plots of conditional probability distributions of age and outcome of COVID-19 cases (N = 987) in the
state of Rajasthan. Panel A: P[Age|Recovered] (blue line) and P[Recovered|Age] (red line), Panel B:
P[Age|Death] (blue line) and P[Death|Age] ( red line), and Panel C: P[Age|Active] (blue line) and
P[Active|Age] (red line).
Page 13/15Figure 6
Pie charts of conditional probability distributions of gender for given outcome (N = 987) in the state of
Rajasthan. Panel A: P[ Gender|Recovered], Panel B: P[Gender|Death] (c), and Panel C: P[Gender|Active].
Figure 7
Pie charts of conditional probability distributions of outcome for given gender (N = 987) in the state of
Rajasthan. Panel A: P[Outcome|Female], and Panel B: P[Outcome|Male].
Page 14/15Supplementary Files
This is a list of supplementary les associated with this preprint. Click to download.
SupplementaryInformationFile.docx
Page 15/15You can also read