The 2018 Winter Games in PyeongChang How will the hosting nation, South Korea perform? - Spliss
←
→
Page content transcription
If your browser does not render page correctly, please read the page content below
The 2018 Winter Games in PyeongChang
How will the hosting nation, South Korea perform?
A focus on South Korea participating in the international comparison of the Sports Policy
factors Leading to International Sporting Success (SPLISS 2.0)
Veerle De Bosscher, Andreas Ch. Weber & Simon Shibli

    1. Introduction
With the 2018 Olympic Winter Games starting this week, our newsletter focusses on the host nation, South Korea. In
the first section, South Korea's success and successful disciplines are identified. Second, as South Korea was a partner
nation involved in the SPLISS 2.0 project, we will show the overall results of the country on the nine elite sport policy
pillars used in the SPLISS 2.0 benchmarks, and discuss the main strengths and weaknesses of the national elite sport
system. It is worth noting that the world of elite sport moves quickly as perhaps best demonstrated by South and
North Korea uniting to bring about a joint women's ice hockey team; and Russia who topped the table in Sochi 2014
being banned from taking part.

    2. Performance analysis of South Korea’s strong Olympic winter disciplines
General performance

Table 1 shows the performance of the nine SPLISS-nations that won medals at the 2014 Sochi Games. The nations are
ordered according to the total number of medal won and the resulting rank in the medal table. At the 2014 Sochi
Games, these nine nations combined for 103 medals out of the 291 medals (35%) won by 26 nations. Canada and the
Netherlands outperformed the other SPLISS-nations be winning 25 and 24 medals respectively with both achieving a
top-5 ranking in the overall medal table. The nine medals won by South Korea puts the 2018 host nation in 12th place
together with Japan.

                                                           1
Rank NOC Gold Silver Bronze Total
4 Canada (CAN) 10 10 5 25
5 Netherlands (NED) 8 7 9 24
8 France (FRA) 4 4 7 15
10 Switzerland (SUI) 6 3 2 11
12 South Korea (KOR) 3 3 2 8
12 Japan (JPN) 1 4 3 8
22 Finnland (FIN) 1 3 1 5
23 Great Britain (GBR) 1 1 2 4
25 Australia (AUS) 0 2 1 3
Table 1: Medal performance of SPLISS-Nations at the 2014 Sochi Games
Performance by Sport
The graph below gives an overview of the Olympic disciplines that contributed South Korea possesses a
most to the medal success of South Korea between 1988 and 2014. competitive advantage in the
skating sports, mainly in Short Track
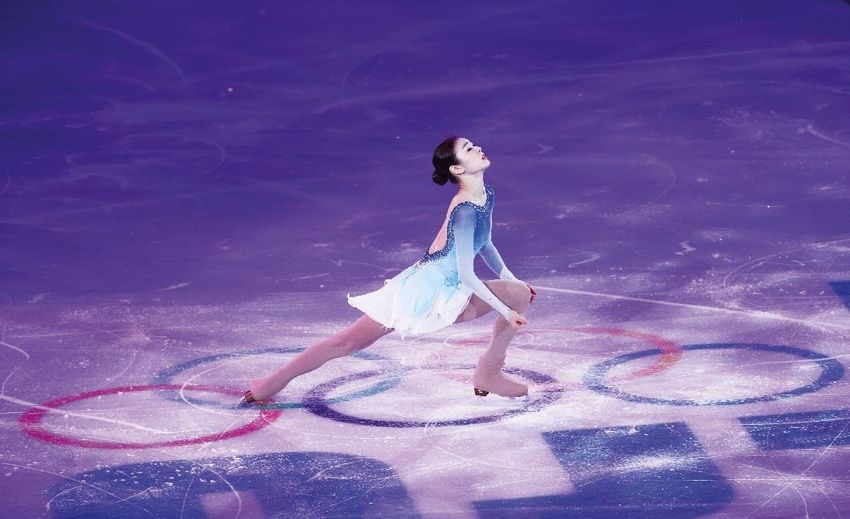
Overall, South Korea won 53 Olympic medals in three Olympic disciplines. The Ice Skating
majority of their medals where won in short track (42 medals, 79%), followed by nine medals in speed skating (17%)
and two in figure skating (4%). South Korea seems to possess a competitive advantages in short track, which was
introduced to the Olympic programme at the 1992 Albertville Games. The remaining two successful disciplines are
also ‘ice-sports’ and have a long history of being part of the Winter Games programme: Figure Skating was introduced
in 1924 (male and female events) while Speed Skating was first included for males in 1924 and females in 1960 (IOC,
2011).
Medal Distribution of South Korea 1988-2014
2; 4%
9; 17%
42; 79%
Short Track Speed Skating Figure Skating n = 53
Figure 1: Medal distribution of Olympic disciplines in South Korea from 1988 and 2014
At the 2014 Sochi Games, the eight medals in the three disciplines won by South Korea resulted in 12th place in the
medal table as measured in total number of medals won, while Canada won 25 medals resulting in 4th place and 24
medals won by the Netherlands places them 5th out of 26 medal-winning nations.
2
The direct rival nations of South Korea for medals in speed skating and short track      South Korea’s direct rival nations
at the 2018 PyeongChang Games will be Canada and the Netherlands. As a                    are Canada and the Netherlands
comparison, over the same period, Canada won 132 medals in 12 disciplines
while the Netherlands won 68 medals in three disciplines. The Canadian top 3 disciplines at the Winter Games from
1988 to 2014 are: 28 medals in short track (21% of total medals), 24 in speed skating (18%) and 18 in freestyle skiing
(14%), while the Netherlands won almost all of its medals in speed skating (98%), followed by short track (1%, 1 medal)
and snowboarding (1%, 1 medal). Hence, Canada has the most diversified portfolio of successful winter sports, while
South Korea has a focused portfolio consisting mainly of short track. The portfolio of the Netherlands consists almost
entirely of speed skating.

3. Potential to increase success as a hosting nation: broaden the sports portfolio
Nations hosting the Games generally manage to increase their medal success; which is recognised as the home nation
effect. Different causes are proposed in the literature such as increased finances or familiarity with competition venues
for example (e.g., Balmer, Nevill, & Williams, 2001; Johnson & Ali, 2004; Shibli, Gratton, & Bingham, 2012).
Additionally, Weber, De Bosscher, and Kempf (2017) found evidence that nations that host the Winter Games expand
their portfolio of funded sports and disciplines. Hence, the questions to be asked is: In which new disciplines could
South Korea be competitive to increase its medal success?

Error! Reference source not found. shows the composition of the Olympic programme of the 2014 Sochi Winter
Games including 15 disciplines and 98 events (=100%) and the success of South Korea per discipline. The disciplines
shown in grey were introduced before the 1988 Games and are considered traditional Olympic winter disciplines,
while the five new disciplines (i. e. freestyle skiing, snowboard, short track, curling and skeleton) included since 1988
are coloured yellow. The percentages per discipline indicate the relative size of the market, i.e. the number of Olympic
medals as provided by the IOC at the 2014 Sochi Games.

There is potential for South Korea to increase its success in speed skating at the    Could South Korea close the gap
expense of the Netherlands which traditionally dominates this discipline and            with the Netherlands in speed
increased its market share from 19% at the 2010 Games to 64% in 2014.               skating? Will it have a competitive
Meanwhile, the two medals won by South Korea is equal to a market share of          advantage in the new event ‘mass
6% in 2014 which is an important decrease from the 14% market share won in                         start speed skating’?
2010 . As the IOC and the International Skating Union (ISU) have decided to include a new male and female event in
speed skating at the 2018 Games, i.e. mass start speed skating, and thereby increased the discipline’s size in the
programme to 14 events, the IOC provides competitive nations with even more medal-winning possibilities in this
discipline. Hence, South Korea’s strategy could be to regain some of the market share from the Netherlands and
increase the number of medals won compared to 2014 (i.e. 2 medals).

                                                           3
Medals of South Korea at 2014 Sochi Games

                                               2% 2%
                                          2%                                                           Cross Country Skiing
                                                                                                       Speed Skating
                                          3%               13%
                                     3%                                                                Biathlon
                                4%                                                                     Alpine Skiing
                                                                                                       Freestyle Skiing
                             4%                                         13%                            Snowboard
                           5%                                    2 medals                              Short Track
                                          1 medal
                                                                                                       Figure Skating
                                                                                                       Luge
                           8%              5 medals
                                                                         11%                           Ski Jumping
                                                                                                       Bobsleigh
                                                                                                       Nordic Combined
                                   10%
                                                               10%                                     Ice Hockey
                                                 10%                                                   Curling
                                                                                                       Skeleton

                                                                                           n = 98

                         Figure 2: Distribution of Success of South Korea at the 2014 Sochi Games per discipline

Furthermore, South Korea could develop its success in ice sports by targeting Curling or one of the new snow-based,
medal-rich disciplines like Snowboarding (i.e. 10% of the total number of medals) for example.

The results at the Games from the 9th to the 25th of February 2018 in PyeongChang will be an interesting test of the
extent to which South Korea is able to use the host nation effectto grow its portfolio of successful winter sports and
increase its medal success.

4. South Korea’s elite sport policy results from the SPLISS 2.0 study: a comparison with 15
nations
About SPLISS and its methods: www.spliss.net

The SPLISS 2.0 project compared elite sport policy in 15 nations worldwide across nine Pillars ((De Bosscher, Shibli,
Westerbeek, & van Bottenburg, 2015). In this project the research team identified, compared and contrasted elite
sport policies and strategies in place for the Olympic Games and other events in 15 distinct nations. With input from
58 researchers and 33 policy makers worldwide and the views of over 3,000 elite athletes, 1,300 high performance
coaches and 240 performance directors that were surveyed, this work is the largest benchmarking study of national
elite sport policies ever conducted. The nations taking part in SPLISS 2.0 were: Australia, Brazil, Canada, Japan and
South Korea, Belgium (Flanders & Wallonia), Denmark, Estonia, Finland, France, The Netherlands, Northern Ireland,
Portugal, Spain and Switzerland. The methods are based on the 9-Pillar model that measures elite sport policies of 96
critical success factors (and 750 sub factors). The Pillars are: (1) financial support; (2) organisation and structure of
elite sport policies; (3) sports participation; (4) talent identification and development; (5) athletic career support; (6)
Sport facilities; (7) coach provision and development; (8) national and international competition; (9) Scientific research
and innovation. See De Bosscher, De Knop, Van Bottenburg, and Shibli (2006) for more information about this model.
                                                                   4
The objective of the SPLISS project is to better understand which sport policies lead to international sporting success
(and how), and to obtain further insight into the effectiveness and efficiency of elite sport policies of nations at an
overall sports level. See De Bosscher et al. (2015) for the complete project results.

The Pillars that had the strongest relationship with success in winter
                                                                                                 Research and innovation,coaches, organization
sports were (in order of importance): research and innovation (Pillar
                                                                                                        and structure of elite sport policies and
9), Coaches (Pillar 7), organization and structure of elite sport                                          Financial support have the strongest
policies (Pillar 2) and Financial support (Pillar 1).                                                 relationship with success in winter sports

How did South Korea perform on the 9 pillars of elite sport policies?

                                                                        P1, financial
                                                                          support
                                                                        100%
                                       P9, research and                                            P2, structure and
                                                                         80%
                                          innovation                                                 organisation
                                                                         60%

                                                                         40%
                           P8, (inter)national                           20%
                                                                                                              P3, sport
                              competition                                                                   participation
                                                                          0%

                                  P7, Coach
                                                                                                         P4, Talent ID and
                               development and
                                                                                                                TD
                                  provision
                                                      P6, training                        P5, (post)athletic
                                                       facilities                          career support

                                                     KOR *                 AVG                 MAX

              Figure 3: Scores of South Korea in the 9 Pillars of elite sport policy against the average and maximum scores of 15 nations

Figure 3 presents the Pillar scores of South Korea on the nine pillars of the SPLISS   South Korea has the highest elite
model. The country clearly is an outlier among the sample nations with                  sport expenditures of all nations
substantial national funding invested in elite sport. At the time of data             and scores around the average on
collection, South Korea (a country with approximately 50 million inhabitants),                            all other Pillars
was, the highest investor in elite sport polities with an average annual budget
spent on elite sport policies of 253 million euros1. Korea’s elite sport expenditures have increased considerably,
notably since 2006. These figures are partly distorted by the inclusion of expenditure on international events (Pillar 8)
in our analysis, such as the Asian Games, World Student Games and World Athletics Championships (but not the
Olympic Games of PyeongChang). This event funding accounts for 53% of total elite sport expenditures, which is much
higher than other nations. International exposure, appears to be an important objective in South Korea. Surprisingly,
Korea is not the strongest nation in its scores on Pillar 8 (international competition); here the highest score was

1Korea as an outlier: this is strengthened when PPP (purchasing power parity) values are taken, which extremely influence South Korea; for example, while elite
sport expenditures are comparable to Japan in absolute values, they are almost the double in PPP values.
                                                                               5
achieved by Japan. The surveys showed that less than half of all coaches are happy with the number of competitive
opportunities available to South Korean athletes.
Looking at the other pillars, Korea's scores are around the average. Most of the support services happen through
financial resources (such as national training centres, funding elite athletes, rewarding medalists, a national sport
science centre), but not through a strong coordinated approach to elite policy development. For example, as shown
throughout the results in Pillar 5 (athletic career support) and Pillar 7 (development and provision for elite coaches),
Korean athletes and coaches were among the highest earners in the sample nations. Athletes receive post career
support such as a pension for medalists, prize money for coaches of medalists, pensions for athletes who retire after
injuries, and a welfare fund for athletes. Funding is clearly an important tool for South Korea to facilitate its elite sport
ambitions. Still, less than 30% of the elite sport coaches indicated that their income is sufficient to operate as a full
time coach. Also, coaches in Japan and Korea on average devote the most time to training, around 50 hours per week.
This finding confirms global arguments that often the job of coaches is insufficiently recognized.
It should also be noted that, while athletes’ perceptions of their coach’s expertise was rated fairly 'high' to 'very high'
in all countries (ranging 70% to 85% positive ratings), in Korea only 62% of the athletes rated the expertise of their
coach as high or (very) high.
A benchmark of South Korea with successful winter sport nations
Figure 4 compares the scores of South Korea on the nine Pillars, to two other successful winter sports nations: Canada
and the Netherlands. The figure confirms that a blueprint of successful elite sport policies does not exist (De Bosscher
et al., 2015), as successful winter sport countries score well on different Pillars.
The strengths of Canada can be seen in Pillars 7 (coaches), 8 ((inter)national competition) and 9 (research and
innovation), whereas the Netherlands is relatively better on the right hand side of the graph (in Pillars 2, 3, 4, 6),
showing the importance of its organizational model that not only enhances sport participation and talent development
(mainly in speed skating) but also proves to be effective and efficient at subsequently turning this broad base into elite
sporting success (at least in this sport). Canada had (along with France) the best score of all nations on coaching
provision and development (Pillar 7). Furthermore Canada scores well on international competition (Pillar 8) and it
also has a developing academic sport science culture that increasingly makes direct contributions to elite sport.
The Netherlands is almost diametrically opposed to the Canada scores, showing relative strengths in Pillars 2
(organization), 3 (participation), 4 (talent ID and development) and 5 (athletic career support). The Netherlands is
ranked third in winter sport success and fifth in summer sports in spite of a score below average on Pillar 1 (financial
support). However, in winter sports, 42 of the 46 (91%) medals won, were in speed skating; two in snowboard and
two in short track. Still this country serves as a good example of a nation that uses its resources wisely to "punch above
its weight", not just in winter sports but in summer sports too.
P1, financial support
100%
90%
P9, research and 6 P2, structure and
80%
innovation organisation
70%
60%
50%
40%Figure 4: Radar graph of Canada, Korea*, and the Netherlands compared to the average and maximum scores of 15 nations
Money in … medals out?
Figure 5 presents the ‘money in-medals out’ (efficiency) relationship for the 15 SPLISS 2.0 sample nations with
expenditures and market shares of medals. For comparability reasons, values were adapted for Purchasing Power
Parity (PPP)2 (expressed in international $) and are shown on the X-axis3. Elite sport expenditures in our measurement
include (a) government funding, (b) national lotteries, (c) NOCs and (d) nationally coordinated sponsorship (excluding
possible overlaps between each funding source).
There are three key messages arising from this analysis of Pillar 1 against success. First, there is a strong positive
relationship between the absolute amount of elite sport funding invested by nations and their success. In general, the
correlation between investment and success is lower than in summer sports (0.52*). It is expected that in winter
sports, countries depend highly on natural resources to develop success (such as mountains and snow). Nation by
nation diagnostics shows that Canada, the Netherlands, Switzerland and to a lesser extent Finland can be seen to
perform above expectations in winter sports, given their elite sport expenditures. South-Korea is situated around the
benchmark (or in line with expectations) line.
Second, there are diminishing returns on investment where merely investing more money does not automatically lead
to more success. This point confirms the nature and continuation of the global sporting arms race. Third, within the
sample there is considerable variation in the efficiency ratios of investment to success. There are clear indications that
some nations use the resources that are invested more efficiently than others. This finding in itself confirms the
importance of investigating in the other Pillars that represent the throughput policy factors in more depth. There is
2 (a) Purchasing power parity (PPP) is an economic concept and a technique used to determine the relative value of currencies to be equivalent to (or on par with) each currency's
purchasing power. It asks how much money would be needed to purchase the same goods and services in two countries, and uses that to calculate an implicit foreign exchange rate..
3 A linear regression analysis with case wise diagnostics was conducted to support this graph. The dotted line in the graphs is an estimation based on residuals. Noting the limitation of a
small sample, analysis of residuals helps to, under ceteris paribus conditions, compare the predicted success, based on the independent variable (here elite sport expenditures), with
actual success. The higher the residual, the better it performs given its elite sport expenditure, and the more efficient the country can be assumed to be (see De Bosscher, 2007);
7much to be learned from which factors are invested in; how they relate to each other; and how they are managed in
an integrated approach by policy makers.
14,0%
CAN
12,0%
10,0%
Success Wintersports
8,0%
KOR
6,0%
NED FRA
4,0%
SUI
FIN
2,0% AUS JPN
ESTFLA ESP
0,0% DEN BRA
0 WAL POR50 100 150 200 250 300 350 400 450
N-IRL
Elite sport expenditures (PPP-values, i$)
Figure 5: Elite sport expenditures per year (PPP-values) and the market share of the SPLISS nations in winter sports at world championships and
Olympic Games (2009-2012) (taken from the infostrada database)
More Information
Contribution to this newsletter
Veerle De Andreas Ch. Simon Shibli,
Bosscher, SPLISS Weber, Lecturer, Sport Industry
chair, Sport and Swiss Federal Research Center
Society research Institute of Sport (SIRC), Sheffield
group, Vrije Magglingen SFISM Hallam University
Universiteit
Brussel (VUB),
Belgium
8Do you want more detailed SPLISS results?
www.spliss.net
De Bosscher, V., Shibli, S., Westerbeek, H. & van Bottenburg, M. (2015). Successful elite sport policies. An international
comparison of the Sports Policy factors Leading to International Sporting Success (SPLISS 2.0) in 15 nations. Aachen:
Meyer & Meyer.
http://www.m-m-sports.com/successful-elite-sport-policies-9781782550761.html
400 pages, in colour
222 photos & illustrations
Paperback
ISBN: 9781782550761
€ 36.95
Contact: veerle.de.bosscher@vub..be
SPLISS is coordinated by: Vrije Universiteit Brussel (Belgium)
In joint collaboration with:
SPLISS-2.0 partners (in addition to the consortium)
Belgium, Université Catholique de Louvain ● Brazil, University of São Paulo ● David Legg, Mount Royal University ●
Denmark, Danish Institute for Sports Studies & University of Southern Denmark ● Estonia, National Audit Office of
Estonia ● France, Institut National du Sport et de l'Éducation Physique-INSEP ● Finland, KIHU - Research institute for
Olympic Sports ● Japan, Waseda University ● United Kingdom, Sport Northern Ireland ● Portugal, Beira Interior
University ● Spain, National Institute of Physical Education of Catalonia, INEFC ● South-Korea, Korea Institute of
Sport Science ● Switzerland, Swiss Federal Institute of Sport Magglingen SFISM
9References
Balmer, N. J., Nevill, A. M., & Williams, A. M. (2001). Home advantage in the Winter Olympics (1908-1998). Journal of
Sports Sciences, 19(2), 129-139.
De Bosscher, V., De Knop, P., Van Bottenburg, M., & Shibli, S. (2006). A Conceptual Framework for Analysing Sports
Policy Factors Leading to International Sporting Success. European Sport Management Quarterly, 6(2), 185-
215.
De Bosscher, V., Shibli, S., Westerbeek, H., & van Bottenburg, M. (2015). Successful elite sport policies. An
international comparison of the Sports Policy factors Leading to International Sporting Success (SPLISS 2.0) in
15 nations. Aachen: Meyer & Meyer.
IOC. (2011). Report on the Seven Sports for the XXII Olympic Winter Games. Lausanne: International Olympic
Committee.
Johnson, D. K. N., & Ali, A. (2004). A tale of two seasons. Participation and medal counts at the Summer and Winter
Olympic Games. Social Science Quarterly, 85(4), 974-993.
Shibli, S., Gratton, C., & Bingham, J. (2012). A forecast of the performance of Great Britain and Northern Ireland in
the London 2012 Olympic Games. Managing Leisure, April-July(17), 274-290.
Weber, A. C., De Bosscher, V., & Kempf, H. (2017). Positioning in Olympic Winter sports: analysing national
prioritisation of funding and success in eight nations. European Sport Management Quarterly, 1-17.
doi:10.1080/16184742.2017.1336782
10You can also read