Strategic Opportunities in the Bond Portfolio - Rachel Woods, CFA Vice President, Senior Analyst Fixed Income Strategies SunTrust Robinson ...
←
→
Page content transcription
If your browser does not render page correctly, please read the page content below
Strategic Opportunities in the Bond Portfolio

          Rachel Woods, CFA
          Vice President, Senior Analyst
          Fixed Income Strategies
          SunTrust Robinson Humphrey
          Rachel.Woods@suntrust.com

FMS NY/NJ Chapter
October 24, 2018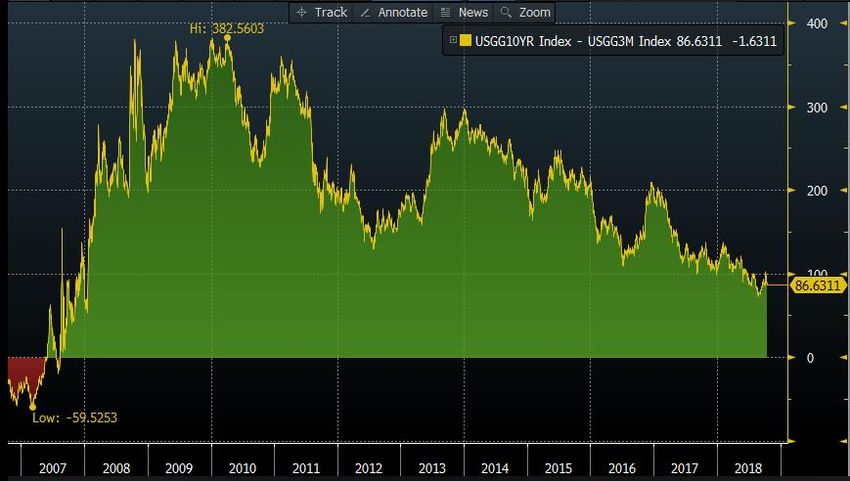
Session Overview

▪      Knowns & Unknowns: Navigating the Difficult Terrain Ahead

▪      Balance Sheet Trends NY/NJ Banks

▪      The Bond Portfolio in the Current Environment

▪      Key Investment Sectors: Risks, Rewards, and Relative Value

    This presentation is for informational purposes only and is being furnished on a confidential basis. By accepting this information, the recipient agrees that it will use the information only to evaluate its
    potential interest in the strategies described herein and for no other purpose and will not divulge any such information to any other party.
    This presentation does not constitute a commitment to lend money, underwrite any proposed transaction, purchase securities or other assets, provide financing, arrange financing, or provide any other
    services. SunTrust Robinson Humphrey, Inc. and its representatives and affiliates make no representation and have given you no advice concerning the appropriate regulatory treatment, accounting treatment,
    or possible tax consequences of the proposed transactions described herein. Prior to entering into any proposed transaction, you should determine, without reliance upon SunTrust Robinson Humphrey, Inc. or
    its representatives or affiliates, the economic risks and merits, as well as the legal, tax and accounting characteristics and consequences, of the transaction and that you are able to assume these risks. These
    materials should not be relied upon for the maintenance of your books and records or for any tax, accounting, legal or other purposes.
    All materials, including proposed terms and conditions, are indicative and for discussion purposes only. Finalized terms and conditions are subject to further discussion and negotiation and will be evidenced by
    a formal written agreement. Except as required by applicable law, we make no representation or warranty, express or implied, to you or to any person as to the content of the information contained herein.
    Opinions expressed herein are current opinions only as of the date indicated. Any historical price(s) or value(s) are also only as of the date indicated. We are under no obligation to update opinions or other
    information.
    In connection with Treasury Regulation Section 1.6011-4, it is our mutual intent that the tax structure and tax treatment of the transactions contemplated by this presentation are not confidential and that
    notwithstanding anything herein to the contrary that each of us (and our employees, representatives and agents) may disclose to any and all persons, without limitation of any kind, the tax structure and tax
    treatment of the transactions contemplated herein.

1    www.suntrustrh.com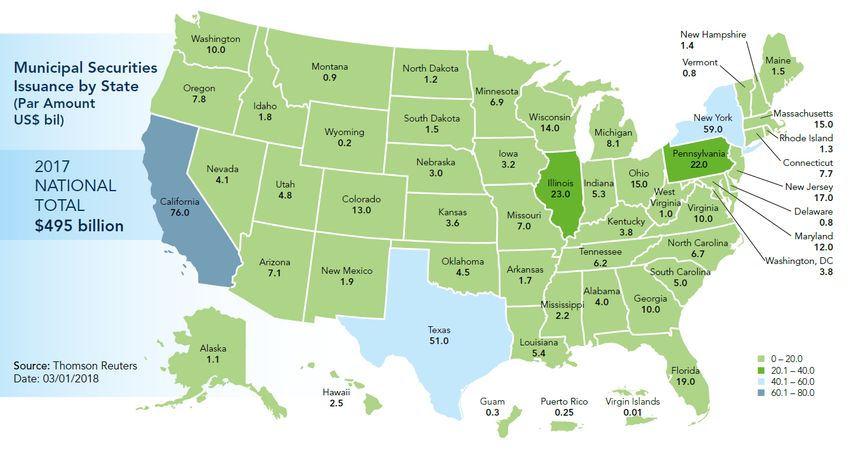
Knowns & Unknowns: Navigating the Difficult Terrain Ahead
Economist Jokes

Ronald Reagan used to say that if trivial pursuit were designed by economists,
it would have 100 questions and 3,000 answers.

Why was astrology invented? So economics would seem like an accurate
science.

Economic forecasters assume everything, except responsibility.

3   www.suntrustrh.com
Section Overview

▪    The Federal Reserve - Monetary Policy
▪    The Yield Curve – Potential Inversion
▪    The Market – Observations from the Past

4   www.suntrustrh.com
Knowns & Unknowns

“There are known knowns. These are things we know that we
know. There are known unknowns. That is to say, there are
things that we know we don’t know. But there are also unknown
unknowns. There are things we don’t know we don’t know.”

- Donald Rumsfeld, Former Secretary of State

5   www.suntrustrh.com
The Federal Reserve
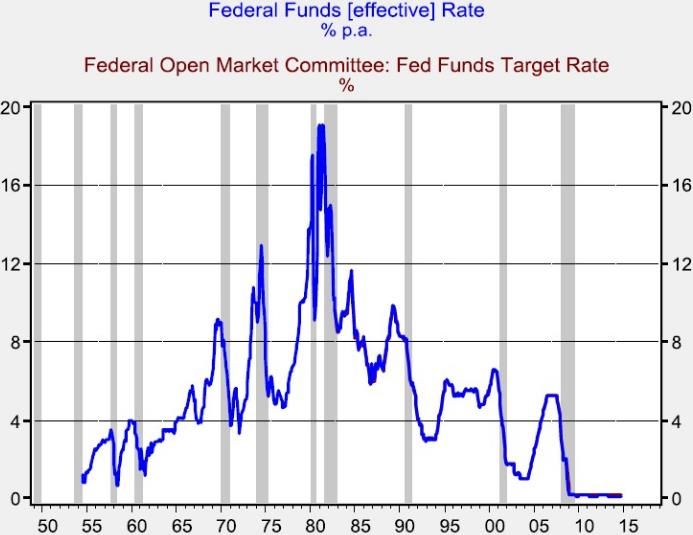
What We Know:
▪ Fed has increased the target rate eight times to its current range of 2.00-2.25%
• Target range was 0-0.25% from December 2008 to December 2015
▪ Fed remains hawkish, projecting one more hike in 2018 and three hikes in 2019
• The last hike is like the last kiss in a relationship; you rarely think it’s the last one while it’s happening
Source: Bloomberg
6 www.suntrustrh.com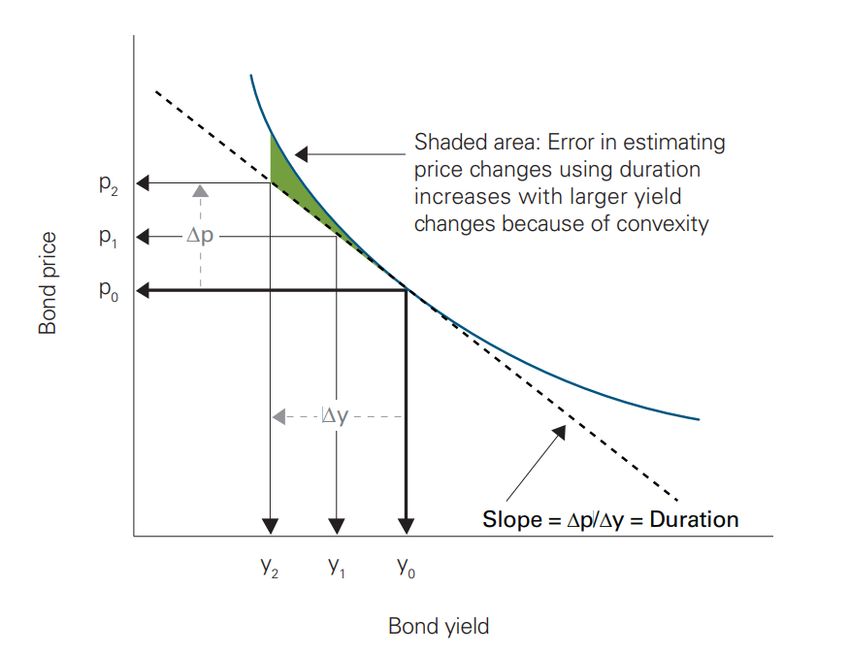
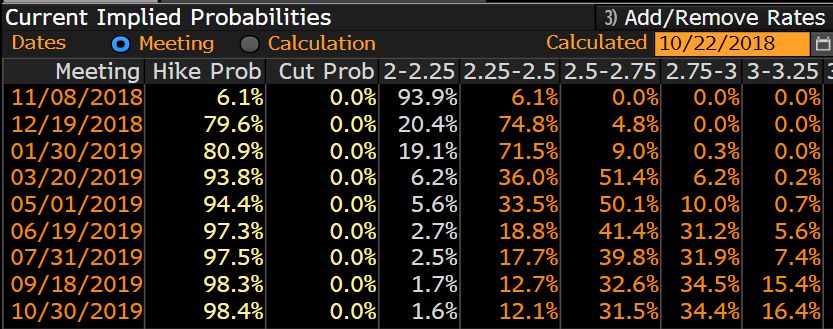
The Federal Reserve

Difference of Opinion:
    ▪ Market considerably more dovish than the Fed
        • Current implied probabilities shows 80% probability for a December hike and two hikes next year

Source: Bloomberg

7   www.suntrustrh.com
The Fed and Curve Inversion
▪ Fed tightening has an extremely
high correlation to subsequent
recessions
▪ Since 1950, Fed has embarked on
thirteen hiking cycles
• Ten of those cycles resulted in
recessions
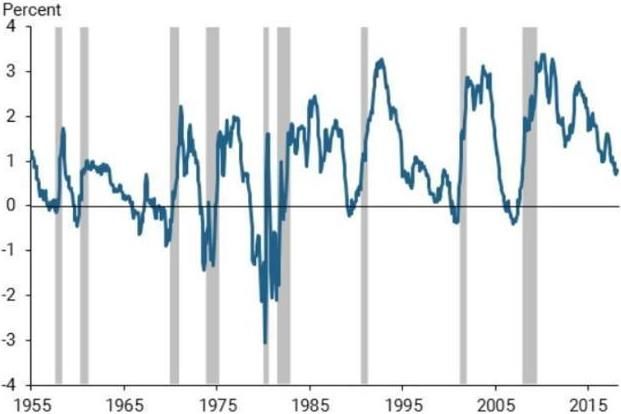
▪ Curve inversion widely considered a
harbinger of recession, for good
reason
• Predicted all nine US recessions
since 1955 – who wants bet
against that track record?
Source: Bloomberg, Federal Reserve Bank of Atlanta; Business Insider
8 www.suntrustrh.comThe Yield Curve
What We Know:
▪ Since first hike this cycle in December 2015:
• 2-year higher by 185 bps, 5-year higher by 128 bps, 10-year higher by 91 bps, 30-year higher by 35 bps
Source: Bloomberg
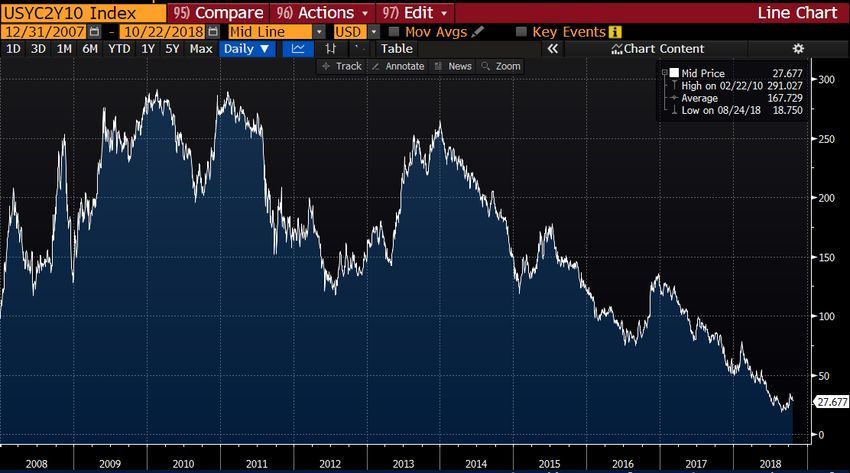
9 www.suntrustrh.comThe Yield Curve
Flat to Inverted?:
▪ The yield curve is flat, very flat, but it is not yet inverted
• Current spread between 2-year and 10-year yield just 28 basis points
Source: Bloomberg
10 www.suntrustrh.comThe Yield Curve
Wiggle Room?:
▪ According to Larry Kudlow, Director of US National Economic Council, we’re looking at the wrong curve
• Should focus on the difference between the 3-month bill and the 10-year note
Source: Bloomberg
11 www.suntrustrh.comThe Market
Observations from the Past:
Lag between inversion and recession:
Averages from last three curve inversion periods:
▪ With 2s/10s spread at just 23bps, we are historically less than six months from inversion
▪ Yields rose in the months leading up to inversion and fell immediately once the curve inverted
Source: Bloomberg, Federal Reserve
12 www.suntrustrh.comThe Yield Curve
Different this Time?
The four most dangerous words in investing are “This time it’s different.” – Sir John Templeton
Some big unknowns to consider:
▪ Trump – nature, attack of Fed, etc.
▪ Trade/Tariffs- specifically with China
▪ Mid-term elections – possible that this will all be obsolete in a few weeks
▪ Geopolitical/Economic Struggles Across Globe
13 www.suntrustrh.comBalance Sheet Trends: NY/NJ Banks
NY/NJ Bank Profitability Trends

                                         7.0%

                                         6.5%

                                         6.0%

                                         5.5%

                                         5.0%

                                         4.5%
              % Average Earning Assets

                                         4.0%

                                         3.5%

                                         3.0%

                                         2.5%

                                         2.0%

                                         1.5%

                                         1.0%

                                         0.5%

                                         0.0%
                                             2007   2008   2009       2010      2011    2012    2013       2014    2015     2016       2017   2018

                                                                  Net Interest Income   Interest Expense     Yield on Earning Assets
Source: SNL
15   www.suntrustrh.com
NY/NJ Bank Loan Trends
7.5% 75.0%
7.0% 70.0%
66.56%
6.5% 65.0%
6.0% 60.0%
58%
5.5% 55.0%
5.0% 50.0%
4.5% 45.0%
% Total Loans
% Total Assets
4.0% 40.0%
3.5% 35.0%
3.0% 30.0%
2.5% 25.0%
2.0% 20.0%
1.5% 15.0%
1.0% 10.0%
0.5% 5.0%
0.0% 0.0%
2007 2008 2009 2010 2011 2012 2013 2014 2015 2016 2017 2018
Yield on Loans (L) Non-Performing Loans (L) Total Loans (R)
Source: SNL
16 www.suntrustrh.comNY/NJ Bank Earning Asset Composition
70.0%
65.0%
60.0%
55.0%
50.0%
45.0%
40.0%
% Total Assets
35.0%
30.0%
25.0%
20.0%
15.0%
10.0%
5.0%
0.0%
2007 2008 2009 2010 2011 2012 2013 2014 2015 2016 2017 2018
Interest Bearing Cash Total Securities Total Loans
Source: SNL
17 www.suntrustrh.comNY/NJ Bank Funding Composition
80.0%
70.0%
69.71%
60.0%
50.0%
% Deposits
40.0%
30.23%
30.0%
20.0%
10.0%
0.0%
2007 2008 2009 2010 2011 2012 2013 2014 2015 2016 2017 2018
Time Deposits Non-Maturity Deposits
Source: SNL
18 www.suntrustrh.comLoan Betas Lagging Deposit Betas
▪ Deposit costs at community banks rose at a quicker pace than loan yields in Q2
▪ According to recent SNL article, community banks have seen their deposits
reprice more quickly than loans – many have also reported higher concentrations
of CDs in their funding bases
▪ Fed rate hikes have increased loan yields, but increases haven’t kept up with
deposit costs. Trend will likely hold as the marketplace for quality loans is
extremely competitive
▪ Combined with a flatter yield curve, this trend does not have good implications
for bank margins in 2019
Source: SNL; https://www.snl.com/web/client?auth=inherit#news/article?id=46969532&KeyProductLinkType=4
19 www.suntrustrh.comKey Takeaways
▪ NIM improvement has been largely attributable to earning asset composition
change
▪ NIM expansion in rising rates dependent on controlling cost of funds
▪ Beta assumptions critical to projected performance
▪ Monitor Liquidity
▪ Tight liquidity could lead to utilization of higher cost funding sources
▪ Use wholesale balance sheet to minimize IRR exposure and manage liquidity AND
improve margins
20 www.suntrustrh.comThe Bond Portfolio in the Current Environment
Section Overview

 ▪     Bond portfolio as a balance sheet lever

 ▪     Practical tips for navigating the current market environment

 ▪     Key takeaways

22   www.suntrustrh.com
Bond portfolio as a balance sheet lever

Remember the portfolio is used for more than just earnings – also for liquidity,
interest rate risk, and capital management
  ▪ It is easy to get wrapped up in the portfolio as solely an earnings driver
  ▪ Bond portfolio is the asset side wholesale balance sheet – it is the key lever in repositioning

Your portfolio mix should complement and balance the rest of the balance sheet

What determines short and long term investment mix?
 ▪ Composition of loan portfolio
 ▪ Loan pipeline/liquidity needs
 ▪ Ability to take on duration
 ▪ Overall risk profile and balance sheet position

23   www.suntrustrh.com
Bond portfolio as a balance sheet lever

 Example 1:

                           Loan portfolio: relatively short, strong pipeline,
                                       large % of total assets
                                           Margin is strong

                          Bond portfolio should serve as a defensive hedge
                                   with an emphasis on liquidity
                             Avoid bonds with significant extension or
                                        contraction risk

                              Reinvest focus: seasoned, well-structured
                                             mortgages

24   www.suntrustrh.com
Bond portfolio as a balance sheet lever
Example 2:
Loan portfolio: weak demand; low % total assets
Bond portfolio is KEY driver of earnings/ margin
performance
Bond portfolio should aim to take advantage of
both rising short term rates and lock in higher long
rates
Reinvest focus: blended exposure – short MBS that
can be reinvested at higher rates or floating rate
bonds combined with relatively longer yield anchor
(think DUS, munis, etc.)
25 www.suntrustrh.comBond portfolio as a balance sheet lever
Example 3:
Funding base: Higher cost/ more volatile
Loan portfolio: fixed rate (at least over near term)
Need earning assets in the bond portfolio to offset
the floating rate exposure of cost funds –
especially as the curve inverts
Reinvest focus: floating rate and short cash flowing
securities
26 www.suntrustrh.comBond portfolio as a balance sheet lever
Why we like the idea of the barbell:
▪ With curve inversion likely – don’t see value in the belly
▪ Barbell doesn’t have to mean long municipals and floaters – it is a balancing act between short duration
cash flow that can take advantage of front-end rates and long-term rates to lock in “high” yields
▪ More so than just adding duration – add positive convexity – or less negative convexity
Exposure to
Long-End The goal is to use the
portfolio to adjust the
Exposure to exposures of the total
Short-End balance sheet to your
optimal position
Total
Balance
Sheet
27 www.suntrustrh.comPractical tips for navigating the current market environment
Avoid market timing:
▪ Follow what we know we know – reinvest using market knowledge combined with institutional
needs/objectives
▪ This is not the time to take on a trader mentality
Take a long term perspective – position your portfolio to perform well in all rate
environments
▪ Aim for the portfolio to always meet key objectives regardless of rate environment…because we don’t have
a crystal ball
▪ Goal is for strategic balance sheet immunization
▪ Neutral doesn’t mean passive – strategically positioned
28 www.suntrustrh.comPractical tips for navigating the current market environment
Seek out call protection and positive convexity where you can find it – especially if it is
cheap
▪ If you wait to position for inversion/falling rates until after it occurs – it will cost more
▪ When preparing for falling rates doesn’t seem 100% necessary – probably the right time to be doing
Stability and predictability of cash flows is KEY.
CASH FLOW =
29 www.suntrustrh.comPractical tips for navigating the current market environment
Importance of Convexity:
▪ Duration assumes a linear relationship between price and yield changes in bonds
▪ However, for larger interest rate moves, the relationship between the change in rates and
the change in bond prices is asymmetric
Source: Vanguard
30 www.suntrustrh.comPractical tips for navigating the current market environment
$130
Positive Convexity:
Prices rise more rapidly as rates fall and
$120 fall more slowly as rates rise
Examples: bullet loans and securities
$110
Price
$100
Negative Convexity:
Prices rise more slowly as rates fall and
$90 fall more rapidly as rates rise
Examples: callable bonds, mortgage
loans and securities
$80
$70
-3.00 -2.00 -1.00 0.00 1.00 2.00 3.00
Rate Change (Percentage Points)
Why do we care?
▪ Lots of depositories have margin/value exposure to falling rates
▪ When rates fall embedded options on negatively convex loans and bonds shorten their
life and diminish value
31 www.suntrustrh.comPractical tips for navigating the current market environment
Need positive convexity and don’t want a portfolio that is 100% bullet agencies?
Consider the following options that have less negative convexity/provide more call protection
and structure:
Agency CMBS – yield maintenance and other forms of call protection can result in positive convexity
Deeply Discounted Callable Agencies – far out of the money coupons can result in positive convexity
Call-Protected Collateral – loan balance, geography, LTV and third-party origination can result in better
convexity
Super-Seasoned Collateral – burnout can result in better convexity
VADMs and PACs – solid structure can result in better convexity
Callable Munis – longer lockouts can result in better convexity
32 www.suntrustrh.comKey Investment Sectors: Risks, Rewards, and Relative Value
Key Investment Sectors: SBA Floaters

SBA Floaters:

 Risks:
 • Existing portfolios generally exposed to faster prepayment speeds and a slower Fed
 • Falling rates

 Rewards:
 • A faster than expected Fed generally good for current and new holders
 • Faster prepayment speeds returns cash flow when other sectors are extending
 • 0% risk weighted/100% government guaranteed
 • Uncapped

 Relative Value:
 • Largely focus on new issue discounted pools
 • Mix in alpha pools when available
 • This sector offers the best relative value on the short-end

34   www.suntrustrh.com
Key Investment Sectors: SBA Floaters

Strategy SBA Floaters
 • Focus on new issue, discounted pools
 • Add alpha pools when available

      Current 3yr Fixed Offering Yields:
      • Treasury: 2.97%
      • Agency: 2.97%
      • 10yr MBS: 3.17%
      • 3yr CMO: 3.48%

Source: STRH Strategies
35   www.suntrustrh.com
Key Investment Sector: Mortgages
Spreads
30-year spreads are at their twelve month
wides due to the end of quantitative easing and
extension in the mortgage space. Spreads
aren’t as wide in shorter-term mortgages given
the preference for short duration.
Source: Bloomberg
36 www.suntrustrh.comKey Investment Sector: Mortgages Risks, Rewards, and Relative Value Risks: • Spread risk in 30yr MBS as the Fed ends mortgage buying • Negative convexity/risk to falling rates Rewards: • Mortgage market remains a robust liquidity option • Monthly cash flows provide liquidity and the ability to reinvest at higher rates • Cheap source of call protection Relative Value: • CMOs – provide spread pick up over traditional MBS • Specifically I like “story bonds”: loan balance, 100% NY, high LTV, etc. Provide call protection, structure, relatively less negative convexity 37 www.suntrustrh.com
Mortgages

Call Protected Stories

                                                    S Curves by Collateral Story
                25

                20

                15
          CPR

                10

                 5

                 0
                          -100          -75   -50           -25                0             25         50   75   100
                                                                        Rate Incentive

                                                      LLB         HLB          NY        Non Loan BAL

Source: CPR/CDR, 30yr FNMA Collateral
38 www.suntrustrh.com
Mortgages Call Protected Stories: MPAY screen Source: Bloomberg 39 www.suntrustrh.com
Key Investment Sectors: CMBS

     • Millennials are now the largest generation in labor force
     • Millennials are more likely to rent multifamily house than older generations

Source: U.S. Census Bureau; BLS; Pew Research Center
40   www.suntrustrh.com
Multi-Family
FNMA DUS Issuance
DUS Issuance
60,000
51,763
50,000
41,955
40,000
28,503
30,000 30,067
23,538
22,504
20,000
21,033
14,569 15,508
10,000
0
2009 2010 2011 2012 2013 2014 2015 2016 2017
Source: FNMA
41 www.suntrustrh.comKey Investment Sectors: CMBS Multi-Family Risks: • Potential overheating in the sector • Delinquencies moving modestly higher Rewards: • Outstanding source of call protection and structure • Positive convexity/potential for price appreciation to falling rates Relative Value: • General value versus bullet agencies • Spreads tight on short-end; can find more value further out the curve • Better spread in wider yield maintenance end dates to maturity DUS Strategy 42 www.suntrustrh.com
Key Investment Sectors: Municipals

Municipal Market

•    Market Size: $3.9 trillion

•    Approximately 1 million outstanding municipal securities

•    $11bn average in par trade daily

•    Default rate of 0.18% for IG munis vs.1.74% for corporate bonds

•    Individuals make up ~42.5% of market, while banks comprise ~15.5%

Source: emma.msrb.org
Key Investment Sectors: Municipals
Pension Funding Ratios

                                                  Table I: State Ranking by Pension Funding Ratio

                First Quartile                      Second Quartile             Third Quartile         Fourth Quartile

                                         Funding                 Funding                    Funding                Funding
      Rank           State                 Ratio Rank   State      Ratio Rank     State       Ratio Rank   State     Ratio
        1             SD                  100.08 13      ME        81.93 26        AL         70.85 39      NM       62.52
        2             WI                   99.98 14      WV        79.23 27        MD         68.56 40      MS       61.08
        3             TN                   96.23 15      GA        79.23 28        KS         67.12 41      MA       59.94
        4             NY                   94.51 16      FL        79.06 29        AK         66.62 42      PA       55.32
        5              ID                  91.27 17      OH        78.47 30        CA         66.53 43       HI      54.80
        6             NC                   90.67 18      OK        77.92 31        LA         65.56 44       RI      54.59
        7             UT                   90.31 19      MO        77.86 32        MI         65.14 45      SC       54.25
        8             NE                   90.18 20      VA        77.22 33         IN        65.04 46      CO       47.13
        9             WA                   89.60 21      AR        76.29 34        VT         64.26 47      CT       43.85
       10             OR                   83.12 22      TX        76.06 35        ND         63.78 48       IL      38.42
       11             DE                   82.80 23      WY        75.91 36        MN         63.34 49      NJ       35.79
       12              IA                  82.13 24      NV        74.45 37        AZ         62.73 50      KY       33.87
                                                  25     MT        72.86 38        NH         62.58
Sources: Bloomberg, CAFRs and S&P as of FY2017
Key Investment Sectors: Municipals
AA TEY vs US TSY
6.0
5.0
4.0
Yield to Maturity (%)
3.0
2.0
1.0
0.0
1Y 5Yr 10Yr 30Yr
Tenor (Yrs)
US Treasury AA GO BQ TEY
US Treasury AA GO BQ TEY
US Treasury Rate Spread GO AA BQ Muni Rate Spread
2 Year 2.90% 2 Year 2.84%
10 Year 3.19% 0.29% 10 Year 3.91% 1.07%
30 Year 3.38% 0.19% 30 Year 4.79% 0.88%
Source: Bloomberg
45 www.suntrustrh.comKey Investment Sectors: Municipals Risks, Rewards, and Relative Value Risks: • Uptick in defaults should a recession occur • Unintended consequences of policy Rewards: • Terrific credit performance versus corporates • Remains a cheap source of call protection • Muni curve is relatively steep to Treasuries Relative Value: • Need to go further out the curve to find value • BQs outperform GM as cost of funds increases due to TEFRA disallowance 46 www.suntrustrh.com
Practical tips for navigating the current market environment

 Focus on having a plan for redeployment of cash flow:
      ▪ What is your market outlook?
      ▪ How do you expect the balance sheet to change?
      ▪ What is a one key goal or objective for your bond portfolio?

47   www.suntrustrh.com
Key Takeaways
▪ No one knows where we are going – but based on history – curve is likely to invert
and lower rates likely to follow
▪ Current balance sheet trends suggest potential for margin contraction as loan betas
lag deposit betas
▪ Bond portfolio is a tool for managing parts of balance sheet out of our control
▪ Have a plan for strategically deploying $$ in the bond portfolio
▪ Avoid market timing – goal is for the portfolio to perform and meet goals regardless
of rate environment
▪ Given uncertainty of market environment, we believe that convexity, stability, and
cash flow – key to a well managed portfolio
48 www.suntrustrh.comYou can also read