2017 Results Presentation - Strategic Hospitality Extendable ...
←
→
Page content transcription
If your browser does not render page correctly, please read the page content below
2017 Results Presentation

       28 February 2018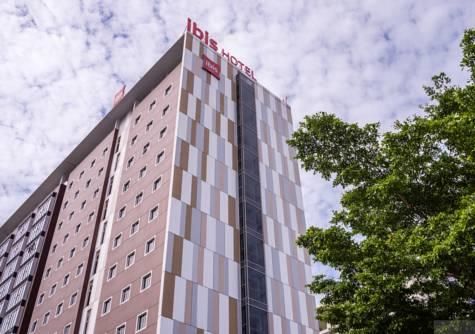
Disclaimer
 •   The information (“Confidential Information”) contained in this presentation is strictly confidential and is provided by Strategic Hospitality Extendable Freehold and Leasehold REIT
     (the “REIT”) to you solely for your reference. Neither this presentation nor any part thereof may be (i) used or relied upon by any other party or for any other purpose; (ii) copied,
     photocopied, duplicated or otherwise reproduced in any form or by any means; or (iii) redistributed, passed on or otherwise disseminated, to any other person either in your
     organization or elsewhere, without the prior written consent of the REIT. By attending this presentation, participants agree not to remove this document, or any materials provided
     in connection herewith, from the conference room where such documents are provided without express consent from the REIT. Although care has been taken to ensure that the
     Confidential Information in this presentation is accurate, and that the opinions expressed are fair and reasonable, the Confidential Information is subject to change without notice,
     its accuracy is not guaranteed, has not been independently verified and it may not contain all material information concerning the REIT. None of the REIT, or any of their
     respective members, directors, officers, employees or affiliates nor any other person accepts any liability (in negligence, or otherwise) whatsoever for any loss howsoever arising
     from any use of this presentation or its contents or otherwise arising in connection therewith.
 •   This presentation is for information purposes only and does not constitute or form part of any offer or invitation for sale or subscription of or solicitation or invitation of any offer to
     or recommendation to buy or subscribe for any securities, nor shall it or any part of it form the basis of or be relied on in connection with any contract, commitment or investment
     decision in relation thereto in Thailand, United States or any other jurisdiction. Any such purchase should be made solely on the basis of the information contained in the
     announcements to the Stock Exchange of Thailand relating to such securities. No reliance may be placed for any purposes whatsoever on the information set forth in this
     presentation or on its completeness.
 •   This presentation contains projections and forward‐looking statements that reflect the REIT's current views with respect to future events and financial performance. These views
     are based on a number of estimates and current assumptions which are subject to business, economic and competitive uncertainties and contingencies as well as various risks
     and these may change over time and in many cases are outside the control of the REIT. You are cautioned not to place undue reliance on these forward looking statements. No
     assurance can be given that future events will occur, that projections will be achieved, or that the REIT's assumptions are correct. Such forward‐looking statements are not
     guarantees of future performance and accordingly, the actual results, financial condition, performance or achievements of the REIT may differ materially from those forecasted and
     projected or in the forward‐looking statements.

                                                                                                                                                                                                    2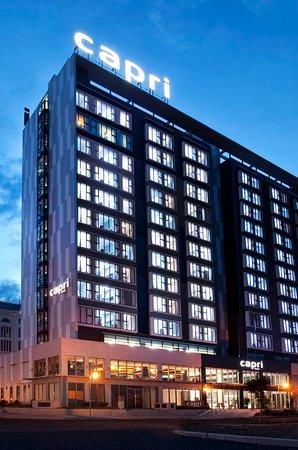
Agenda

  Section 1   Key Highlights

  Section 2   Financial Statements

  Section 3   2018 Outlook and Key Initiatives

  Section 4   Background and Structure of SHREIT

                                                   3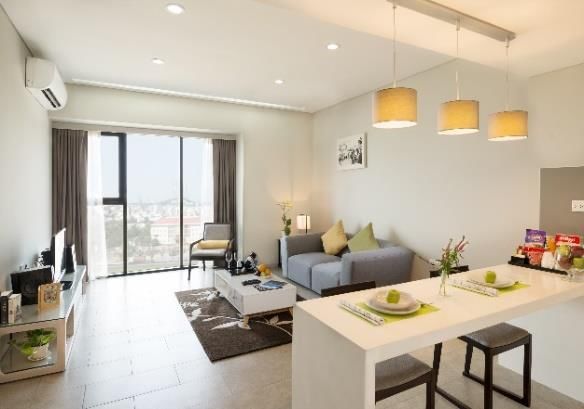
Section 1
Key Highlights

                 4
SHREIT Key Highlights
Strategic Hospitality Extendable Freehold and Leasehold REIT (“SHREIT”) completed a successful and ground-breaking listing on
the Stock Exchange of Thailand (“SET”) on 27 December 2017
SHREIT is the first REIT listed on the SET with a portfolio of international hospitality assets (Ho Chi Minh in Vietnam and
Jakarta in Indonesia)
Since taking ownership of the hotel portfolio on 22 December 2017, SHREIT has rapidly integrated the portfolio
assets with the assistance of Accor SA and Frasers Hospitality (the international hotel operators for SHREIT
hospitality assets)
Strong organic growth for each underlying hotel in FY2017 versus FY2016. Continued strong momentum from 2017 with all
hotels achieving their best January trading month on record during January 2018
Key initiatives put in place to position SHREIT for organic and acquisition growth in the near term and to diversify its funding
sources
5
Portfolio Level Comparisons - FY2017 vs FY2016
                                                       Indonesia                                                                  Vietnam

                                                   Pullman Jakarta                                      Capri by Fraser                              IBIS HCMC
                                                    Central Park                                            HCMC

                                                                                  Hotel Operating Performance

Currency Unit: USD                                                          % Increase /                                  % Increase /                           % Increase /
                                       FY2017              FY2016                           FY2017          FY2016                          FY2017    FY2016
                                                                            (Decrease)                                    (Decrease)                             (Decrease)

Gross Operating Revenue
                                      16,318,074         15,136,973             7.8%        3,004,394      2,779,978         8.1%        1,787,649   1,547,630      15.5%
(GOR)

Gross Operating Profit
                                      7,913,620           7,114,569            11.2%        1,676,046      1,638,307         2.3%        896,617     763,757        17.4%
(GOP)

Net Operating Profit
                                      6,974,594           5,819,317            19.9%        1,736,210      1,699,724         2.1%        802,142     681,508        17.7%
(NOP)

Average Daily Rate
                                         102.6              102.3               0.3%          63.5           59.3            7.2%            45.2      39.5         14.4%
(ADR)

Average Occupancy Rate
                                        79.4%               75.7%               3.7%         74.7%           73.8%           0.9%           64.7%     63.3%         1.4%
(Avg Occ.)

Revenue per Available Room
                                         81.5                77.4               5.2%          47.4           43.7            8.5%            29.3      25.0         16.9%
(RevPar)

Notes :
(1) Financial performance for Pullman is based on exchange rate of 13,650 VND/USD
(2) Financial performance for Capri and IBIS are based on exchange rate of 22,700 VND/USD
                                                                                                                                                                                6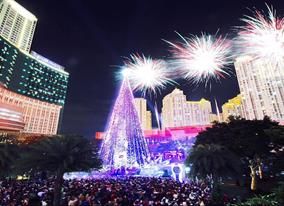
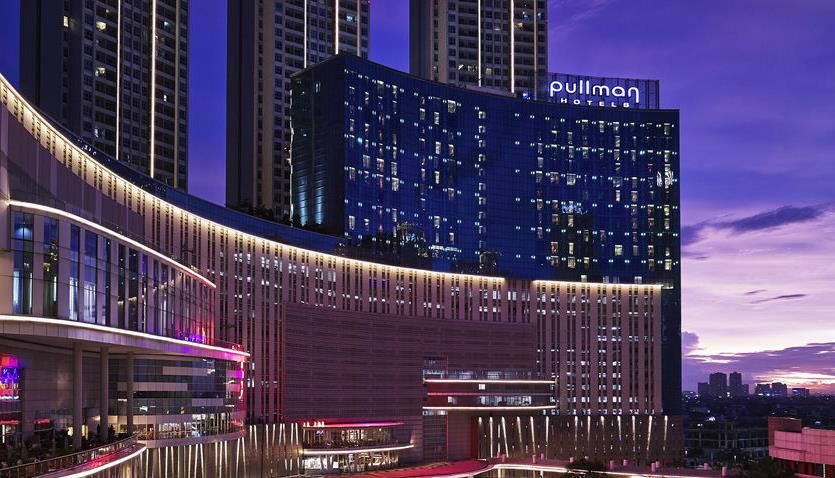
Portfolio Performance Review – Pullman Jakarta Central Park
FY2017 FY2016 Variance
GOR (USD m) 16.3 15.1 7.8%
GOP (USD m) 7.9 7.1 11.2%
USD94.7mn USD100.3mn
Pullman Jakarta Central Park Acquisition Value(1)
(22nd December 2017)
Appraiser Valuations(2)
(31st December 2017)
➢ The strong performance for Pullman in 2017 was mainly driven by impressive growth in domestic weddings, MICE, and F&B activities
Non-room revenue growing by double digits in 2017 compared to 2016
Effectively leveraged ballroom and conference meeting facilities measuring over 8,500 sqm and hosting over 60 weddings in 2017
Awarded the “Best City Hotel” and “Best Wedding Hotel” in Indonesia by International Hotel Awards in 2017
➢ Received additional boost from leading Asian Airlines crew contract in 2017
➢ Key 2018 catalysts –
Asian Games
Domestic Election spending
Continued optimization of RevPar mix
Continued momentum in non-room revenue
➢ January 2018 trading performance best January month on record
ADR (USD) Avg RevPar (USD) Avg Occ.
102.6 102.3
79.4%
81.5 77.4 75.7%
Note:
1.The acquisition price was agreed in Aug 2016. FY2017 FY2016
7
2. Colliers International.Portfolio Performance Review – Capri by Fraser
FY2017 FY2016 Variance
GOR (USD m) 3.0 2.8 8.1%
GOP (USD m) 1.7 1.6 2.3%
USD21.0mn USD23.1mn
Capri by Fraser AcquisitionValue(1)
(22nd December 2017)
Appraiser Valuations(2)
(31st December 2017)
➢ The increase in GOR and GOP in 2017 was driven by robust RevPar management and positioning as the only internationally branded 4-
star hotel in District 7, HCMC
Client mix shifting from 70 / 30% long-stay / short-stay towards a target client mix of 50 / 50% respectively – short-stay rates help drive
higher ADR
Strong and captive ADR pricing power from the nearby Saigon Exhibition Convention Centre (“SECC”) – 84 trade events/conventions in
2017 (up significantly from 56 in 2016)
Benefiting from general positive demand-supply dynamics in Ho Chi Minh City
➢ Key 2018 catalysts –
RevPar management to focus on room rate and occupancy from short-stay and reducing contribution from long-stay to leverage the
hotel’s location advantage to SECC
Corporate demand from strong Vietnam economic activity and growth
F&B moved in-house which should drive incremental performance
➢ January 2018 trading performance best January month on record
ADR (USD) Avg RevPar (USD) Avg Occ.
63.5
59.3
74.7% 73.8%
47.4
43.7
Note:
1.The acquisition price was agreed in Aug 2016. FY2017 FY2016
8
2. Colliers International.Portfolio Performance Review – IBIS Saigon South
FY2017 FY2016 Variance
GOR (USD m) 1.8 1.5 15.5%
GOP (USD m) 0.9 0.8 17.4%
USD15.0mn USD15.2mn
IBIS Saigon South AcquisitionValue(1)
(22nd December 2017)
Appraiser Valuations(2)
(31st December 2017)
➢ The increase in GOR and GOP in 2017 was driven by impressive RevPar management and positioning as the only internationally
branded 3-star hotel in District 7
Strategic positioning as a leisure hotel for Mekong Delta tour groups
Strong and captive ADR pricing power from the nearby Saigon Exhibition Convention Centre – 84 trade events/conventions in 2017 (up
significantly from 56 in 2016)
Benefiting from general positive demand-supply dynamics in Ho Chi Minh City
Strong brand recognition from budget travellers from China and Korea
➢ Key 2018 catalysts –
RevPar management to focus on rate and occupancy
Strong leisure group demand from increased tourist arrivals (Mekong delta tours)
Corporate demand from strong Vietnam economic activity and growth
➢ January 2018 trading performance best January month on record
ADR (USD) Avg RevPar (USD) Avg Occ.
45.2 64.7%
39.5
63.3%
29.3
25.0
Note:
1.The acquisition price was agreed in Aug 2016. FY2017 FY2016
9
2. Colliers International.Section 2
Financial Statements
10Strong and Healthy Financial Position
➢ Strong balance sheet with healthy gearing of 30.6%
Pursuing credit rating from a leading international credit-rating agency.
Long term financing in the form of long-dated term loan (up to 13 years)
➢ The ~USD12mn cash balance also comprises accrued payables and liabilities, and guarantee deposits for rental
income. However, the REIT maintains a healthy level of cash balance
➢ Non-recurring (once-off) expenses(1) contribute to the majority of the REIT level expenses for 22nd - 31st Dec 2017,
however, these are once-off and non-capitalized IPO related expenses
Key Financial Indicators
As at 31st Dec 2017
Total Assets (USD) 165mn
Total Liabilities (USD) 57mn
Equity (USD) 108mn
Net Asset Value per unit (THB) 9.97
Cash or Cash Equivalent (USD) 12mn
For periods between 22nd Dec – 31st Dec 2017
Total Revenue (USD) 0.3mn
Net Profit (deficit) (USD) (0.3)mn
Notes : Due to 10 days of ownership in 2017, the REIT will pay any dividends attributable to this period as part of Q1 2018 dividends.
(1) Non-recurring and non-capitalized IPO related expenses including (aborted Raffles acquisitions, registrar fee).
11Section 3
2018 Outlook and Key Initiatives
122018 Key Initiatives
SHREIT was established with the objective of being an active and independently managed REIT, focused on
driving organic and acquisition growth with responsible capital management.
Our key business development initiatives include:
➢ Obtaining a corporate credit rating to diversify and/or lower debt funding sources, by providing bond market alternatives
to traditional bank debt
➢ Pursuing accretive acquisitions to broaden the portfolio, including acquisitions in a third country (other than Vietnam and
Indonesia)
➢ Active assets management initiative
➢ Best-in-class transparency, disclosure and governance amongst the Thai REIT peer group.
Source: SCB, SHREIT.
13
Existing secured REIT loan priced at 4.35%.Ho Chi Minh City Outlook
➢ Ho Chi Minh City (HCMC) recorded an increasing GDP growth rate of 8.3% in 2017 (versus 8.1% in 2016)(1) and
registered a total Foreign Direct Investment of USD6.3bn
➢ The outlook for the hospitality industry of HCMC is very optimistic resulting from tremendous growth in the number of
international arrivals and government initiatives for boosting the city’s tourism industry
6.3 million international arrivals was registered in 2017 by HCMC, this is an increase of 23% YoY – leading source
markets were Korea, Japan, and China
The government announced a major expansion of Tan Son Nhat International Airport which doubles its current
capacity of 50 million passengers p.a. to cope with the growing number of tourists
HCMC Metro is expected to start operation in 2020 and with a total of 9 lines covering 173km planned. This added
infrastructure should drive volumes and business activity, providing much needed infrastructure to resolve traffic
problems
The city also called for investments in new tourist sites and programs to boost the local tourism industry
➢ Notwithstanding increasing hotel supply in 2017 (up 8.0% YoY to over 16,500 rooms), the majority of the new stock are
homestays / boutique hotels. The demand / supply dynamics in HCMC remain extremely strong
➢ Whilst the CBD is the traditional choice for leisure tourists, District 7 (Phu My Hung) as the new urban centre has
generated significant interest for corporate and MICE customers in recent years. Saigon Exhibition and Convention
Centre, HCMC’s premier convention centre, situated in District 7, has experienced explosive growth in trade shows and
international conventions
Source: Savills, Colliers Industry Report.
1. Vietnam as a whole recorded 2017 GDP of 6.8%.
14Jakarta Outlook
➢ The tourism and hotel industry in Jakarta has traditionally been underpinned by domestic visitors (around 9 times the
volume of international visitors) – 27.9 million domestic visitors is expected in 2019 (versus 23.7 million in 2016). This
provides resilience to domestic factors which may be negatively perceived by foreigners
➢ There has been significant new supply entering the market in the past few years resulting in tighter competition.
However, new hotel supply over the next two years is fairly limited
➢ 2018 is an election year with demand for hotel rooms and F&B expected to increase, as well as large international
events such as the Asian Games 2018, which will be held in Jakarta and Palembang
➢ Broader Jakarta Market performance is expected to improve in 2018
➢ Given its unique location and appeal as a destination with local tourists / consumers (Pullman is connected to a retail
mall and the Jakarta aquarium) and its proximity to the airport, Pullman Jakarta Central Park is one of the top performing
5-star hotels in Jakarta from an occupancy perspective – 2017 occupancy of almost 80% which far outstrips general
occupancy amongst 5-star hotels in central Jakarta
Source: Colliers Industry Report.
15Section 4
Background and Structure of SHREIT
16SHREIT THB5.4bn Real Estate Investment Trust
Transaction Overview
Thailand’s First International Hospitality REIT
Balanced portfolio of geographically diversified, premium and
1 well-positioned hospitality assets 2 Operated and managed by highly reputable specialists
and professionals from asset to REIT level
Robust return and uncorrelated to Thailand tourism
3 Unparalleled platform for organic and inorganic growth 4 industry
On December 27th, SHREIT priced a THB3.5bn (US$107mn) initial public offering, consisting of 352.8mn trust units offered at THB10.0 per share
The transaction was well over subscribed with significant tier 1 international and domestic institutions
Over 500 shareholders at IPO, confirming broad based appeal
SHREIT’s IPO opened up a new chapter to the Thailand REIT Regime
Transaction Details
Issuer Strategic Hospitality Extendable Freehold and Leasehold REIT
REIT Manager Strategic Property Investors REIT Limited
Offering Type Initial Public Offering
Ticker SHREIT
Exchange Stock Exchange of Thailand
Shares Offered 352,836,700 units
Share Type Trust Units
Price 10 Baht per unit
Forecast Offering Yield 7.72%
Market Cap THB3.5bn
17
Private & ConfidentialAsset Portfolio Review
Indonesia Vietnam
Pullman Jakarta Capri by Fraser IBIS HCMC
Central Park HCMC
Award-winning 5-star hotel in West Award-winning 4-star hotel in District The only international-branded 3-star
Jakarta and adjacent to Central Park 7 of HCMC, ideally located for MICE hotel in District 7 of HCMC, ideally
Description
Mall, strong penetration in corporate as well as both short and long-stay located to capture leisure tourists for
travelers and local MICE / Weddings travelers Mekong Delta tours
Leasehold Tenure Freehold 26 Years 26 Years
Operating Since 2012 2013 2012
Operator Accor Frasers Accor
Star Rating 5 4 3
Rooms 317 175 140
Date of SHREIT
22 Dec 2017 22 Dec 2017 22 Dec 2017
Acquisition
Acquisition Value USD94.7mn(1) USD21.0mn USD15.0mn
Appraiser Valuations
USD100.3mn USD23.1mn USD15.2mn
31 December 2017(2)
Note:
1. Excluding transaction costs.
2. Colliers International.
18
Private & ConfidentialIndependent and Experienced Third Party Platform
International M&A and Strong Connectivity with
Capital Markets Expertise Leading Regional and
Global Vendors
Hotel and Real Estate Thai REIT Management
Financing and Operations Experience
Cross Border Acquisition Corporate Governance
and Deal Structuring and Independence
19
Private & ConfidentialUnparalleled Platform for Organic and Acquisition Growth
Independent platform means SHREIT is not restricted on potential acquisition opportunities.
Unique Characteristics Ensure Superior and Immediate Long-term Growth
A B C
Embedded Strong Potential
Active Asset Management
Organic Growth Acquisition Pipeline
Capri and IBIS still experiencing RevPAR optimization to drive Potential increase in portfolio from
significant ramp-up growth with growth from rebalancing ADR vs visible pipeline
upside from SECC phase 2 occupancy (e.g. Pullman)
Scaling existing markets and
ADRs and occupancy with Potential to add rooms at IBIS for adding new ones
significant room to increase
ADRs still tracking below
+ example
Manage seasonality by rotating
+ 3rd party and strategic partners
acquisitions
comparable due to relatively new between customer segments
age of hotels, implying significant (MICE, weddings, leisure groups,
upside etc.)
20
Private & ConfidentialThank you 28 February 2018
You can also read