2020 RBC Capital Markets Mining Investor Day - JIM BEYER - Managing Director & CEO - Regis ...
←
→
Page content transcription
If your browser does not render page correctly, please read the page content below
2020 RBC Capital Markets Mining Investor Day
JIM BEYER – Managing Director & CEO            ASX:RRL
2   CAUTIONARY STATEMENT
    This presentation contains only a brief overview of Regis Resources Limited and its             affects the information included in the Relevant ASX Announcements and in each case the
    associated entities (“Regis or RRL") and their respective activities and operations. The        Production Targets, forecast financial information and estimates of Mineral Resources or
    contents of this presentation, including matters relating to the geology of Regis’ projects,    Ore Reserves, that all material assumptions and technical parameters underpinning that
    may rely on various assumptions and subjective interpretations which it is not possible to      information in the Relevant ASX Announcements, continue to apply and have not
    detail in this presentation and which have not been subject to any independent                  materially changed. The Company confirms that the form and context in which the
    verification.                                                                                   Competent Person’s findings are presented have not been materially modified from the
                                                                                                    original ASX announcement.
    This presentation contains a number of forward-looking statements. Known and unknown
    risks and uncertainties, and factors outside of Regis’ control, may cause the actual results,   Past performance and pro-forma financial information given in this document, including in
    performance and achievements of Regis to differ materially from those expressed or              relation to upgrades to resources and reserves, is given for illustrative purposes only and
    implied in this presentation. To the maximum extent permitted by law, Regis does not            should not be relied upon as (and is not) an indication of future performance, nor of Regis'
    warrant the accuracy, currency or completeness of the information in this presentation,         views on the Company's future financial performance or condition. Investors should note
    nor the future performance of Regis, and will not be responsible for any loss or damage         that past performance of Regis, including the historical trading prices of its shares, cannot
    arising from the use of the information. The information contained in this presentation is      be relied upon as an indicator of (and provides no guidance as to) Regis’ future
    not a substitute for detailed investigation or analysis of any particular issue. Current and    performance, including the future trading price of its shares. The historical information
    potential investors and shareholders should seek independent advice before making any           included in this presentation is, or is based on, information that has previously been
    investment decision in regard to Regis or its activities.                                       released to the market.

    The information in this presentation that relates to Exploration Results is extracted from      As noted above, an investment in Regis shares is subject to known and unknown risks,
    the Australian Securities Exchange (ASX) announcement released 22 January 2020 entitled         some of which are beyond the control of Regis. Regis does not guarantee any particular
    “Quarterly Report to 31 December 2019”. Production Targets and associated forecast              rate of return or the performance of the Company, nor does it guarantee the repayment of
    financial information is extracted from the ASX announcement released 22 January 2020           capital from Regis or any particular tax treatment.
    entitled “Quarterly Report to 31 December 2019” and Mineral Resources and Ore
    Reserves is extracted from the Mineral Resource and Ore Reserve Statement released to           The distribution of this presentation (including an electronic copy) outside of Australia
    the ASX on 19 July 2019 (the Relevant ASX Announcements). In each case, appropriate             (including the United States) may be restricted by law and any such restrictions should be
    Competent Person’s consents were obtained for the release of that information in the            observed. Any non-compliance with these restrictions may contravene applicable
    Relevant ASX Announcements and those consents remain in place for subsequent releases           securities laws.
    by the Company of the same information in the same form and context, until the consent
    is withdrawn or replaced by a subsequent report and accompanying consent.                       ASX   announcements      are        available    on    the     Company’s      website     at
                                                                                                    www.regisresources.com.au
    The Company confirms that it is not aware of any new information or data that materially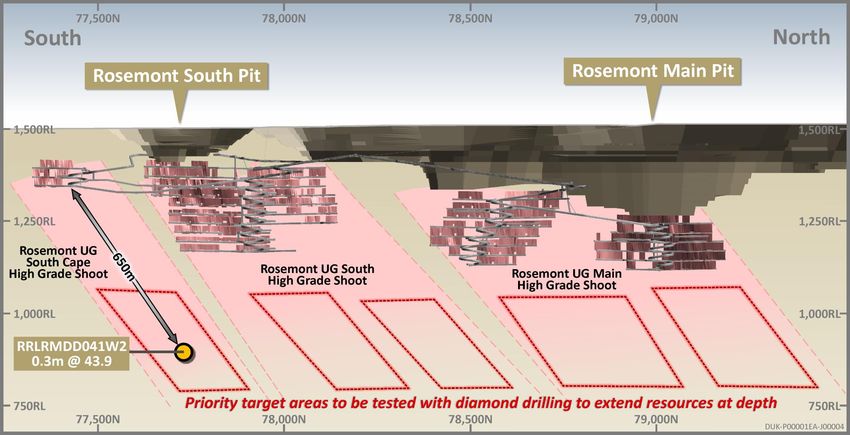
3        CORPORATE OVERVIEW
         CAPITAL STRUCTURE                                                                                                                         12 MONTH SHARE PRICE PERFORMANCE

          ASX Code                                                     RRL
                                                                                                                                        20                                                                7.00
          Issued     capital1                                          508.2M shares                                                                                                                      6.00
          Market capitalisation2                                       A$2.2B                                                           15                                                                5.00

                                                                                                                             Millions
          Cash and gold on hand3                                       A$169M                                                                                                                             4.00

                                                                                                                                                                                                                 $AUD
                                                                                                                                        10
                                                                                                                                                                                                          3.00
          Borrowings3                                                  Nil
                                                                                                                                         5                                                                2.00
          Resources4                                                   8.2Moz
                                                                                                                                                                                                          1.00
          Reserves4                                                    4.0Moz
                                                                                                                                         0                                                                0.00
                                                                                                                                                                   Volume    Share Price
         BOARD & MANAGEMENT
                                                                                                                                        SHAREHOLDER DISTRIBUTION (% ISSUED SHARES)
         James Mactier                        Jim Beyer                       Steve Scudamore
         Independent                          Managing Director               Independent
         Non-Executive Chairman                                               Non- Executive Director
                                                                                                                                                     4% 4%
         Lynda Burnett                        Fiona Morgan                       Jon Latto                                                                                  Australian Institutions
         Independent                          Independent                        CFO &                                                                       31%            USA Institutions
         Non-Executive Director               Non-Executive Director             Company Secretary                                           33%
                                                                                                                                                                            UK Institutions
         Stuart Gula                                                                                                                                                        Rest of Europe Institutions
         Chief Operating Officer
                                                                                                                                                                            Other
                                                                                                                                                      28%
    1.    Appendix 3B 10 Jan 2020                      3.   As at 31 December 2019
    2.    Source: ASX.com.au 1 Feb 2020 at A$4.32/sh   4.   ASX release – Mineral Resource and Ore Reserves Statement – 19 July 2019
4       CORPORATE HIGHLIGHTS

                  A$2.2B company with 8.2Moz in Resources and 4.0Moz in Reserves
                  with consistent Reserve replacement

                   Production Guidance of 340,000 - 370,000oz gold at
                   A$1,125-$1,195/oz AISC 1 and Growth Capital of
                   ~A$62m for FY2020

                    Strong dividend stream with cumulative
                    payments of A$448m since 2013

                    Among the lowest cost gold producers globally
                    with a clear production growth profile

                                                                                                                                                  MOOLART WELL
                    Strong financial position - A$169m cash and                                                                                     2.5Mtpa
                    bullion and no debt2                                                                                                                           MCPHILLAMYS PROJECT
                                                                                                                                                                      Potential open pit ~200kozpa Au
                                                                                                                                                                      Development Application is
                  Significant internal growth projects                                                                                                                progressing – exhibition and
                                                                                                                                                                      submission period closed.
                                                                                                                                                     GARDEN WELL      Regis’ responses to submissions
                                                                                                                           ROSEMONT                     5Mtpa
                                                                                                                                                                      now underway
                  Transparent ESG and Sustainability reporting                                                              2.5Mtpa

1. Assumes   a A$1,750 gold price - excludes royalty cost (~A$18/oz) impact associated with higher prevailing gold price     2.   As at 31 December 2019
5   FY2020 HALF YEAR FINANCIAL HIGHLIGHTS

                          Record Net Profit                                     EBITDA
                           A$93M up 17%                                      A$186m up 27%
                        Net Profit Margin +25%                               EBITDA Margin 50%

             Cash flow from                                 Cash & Bullion
                                                                                   Interim Dividend
           operating activities                               A$169m*
                                                                                      8c per share
            A$147m up 16%                                      No debt

    *Includes bullion on hand valued at $2,220 per ounce.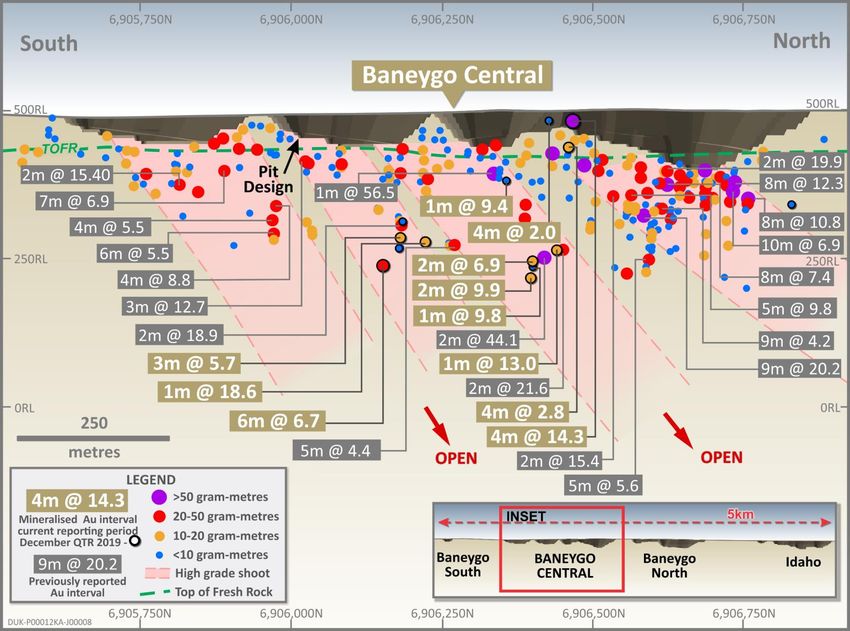
6   EXECUTIVE TEAM

                                         • Mining Engineer with 30 years of operational and development experience
                        Jim Beyer          across multi-commodities including both underground and open pit gold
                     Managing Director   • CEO of an ASX listed iron ore producer for seven years prior to joining Regis
                          & CEO
                                         • Track record of delivering on commitments while improving safety and
                                           responsibly generating value

                                         • Mining Engineer with 30 years of operational and executive experience
                                           working across a range of commodities
                       Stuart Gula
                                         • Managed multiple operations both underground and open pit mines in
                     Chief Operating
                                           diverse global jurisdictions
                         Officer
                                         • Experienced in identifying and actioning strategies and opportunities to
                                           deliver results safely and consistently

                                         • Chartered accountant with over 25 years’ working both locally and offshore
                        Jon Latto
                      Chief Financial    • 13 years as CFO in gold mining businesses
                          Officer        • Extensive experience in corporate and commercial resources related
                                           activities
7    PEOPLE – THE FOUNDATION OF OUR SUCCESS
     Total 950 people – 338 employees & 612 contractors

    35

    30

    25

    20

    15

    10

                                                   12mma TRIFR*

          Renewed focus on safety performance and training
          Pockets of excellence but overall outcomes still inconsistent
          Risk management process upgrade ensuring appropriate hazard identification and controls
          Trending incident hotspots under detailed review
          Re-invigorating towards a strong, behavioural based safety culture

     * Total Reported Injury Frequency Rate – LTI+RWI+MTI – key internal Regis metric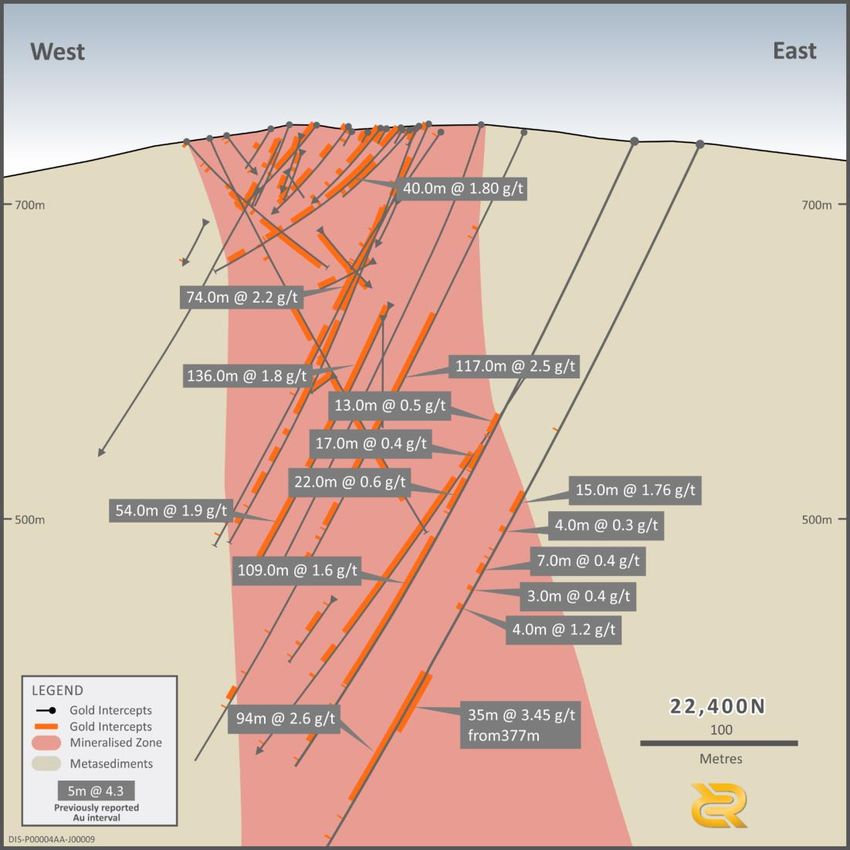
8   TRANSPARENT SUSTAINABILITY AND ESG REPORTING

    Sustainability Metrics

    Health & Safety

    People & Culture

    Mental Health & Wellbeing

    Environment Rehabilitation & Closure

    Social Performance

    Corporate Governance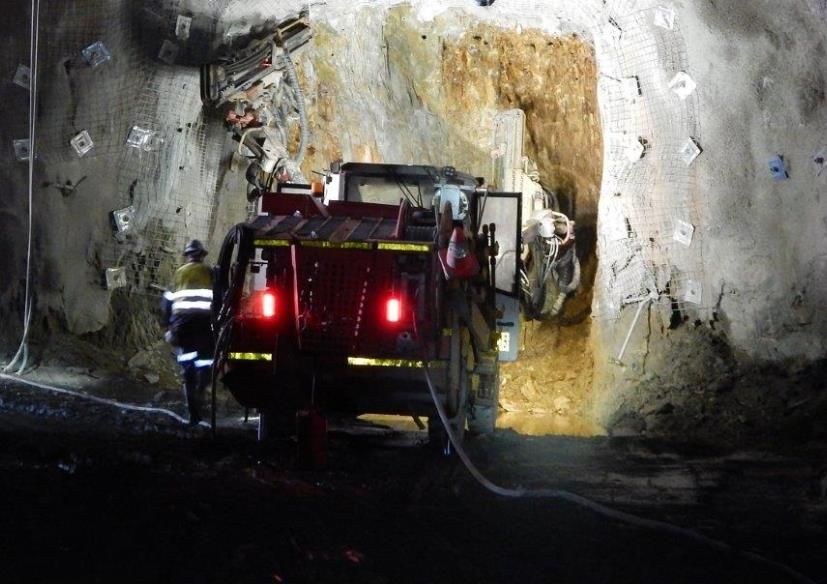
9                   INDUSTRY LEADER IN LOW COST PRODUCTION

                                                                                              International peers (2019A)
                                   ALL-IN SUSTAINING COSTS 2019 & 2020 Forecast (US$/OZ)
                     $1,400                                                                   Australian peers (2020E)

                     $1,200

                     $1,000
    AISC (US$/oz)

                       $800

                       $600

                       $400

                       $200

                         $0

                    Source: Canaccord Genuity – February 2020. FX Assumption – 0.70AUD/1USD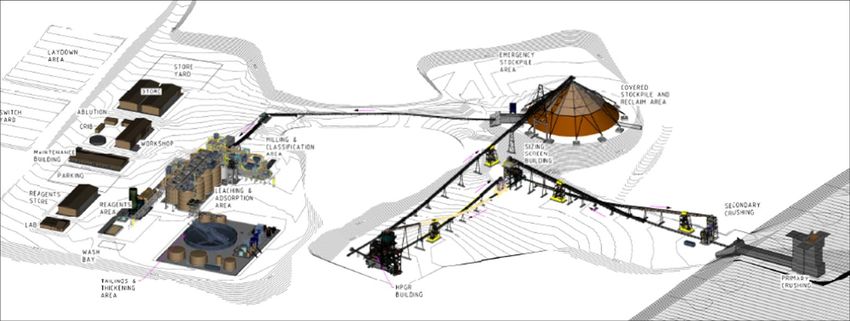
10 STRONG PERFORMANCE ON ALL PROFIT MEASURES
FY20 Half Year continues the trend
Net Profit After Tax
Revenue
100 93
400 371 89
90 85 83
338 80
350 317 80 77
299 307
290
300 70
252 61
60
$ millions
250
$ millions
50
200
40
150
30
100 20
50 10
0 0
2017 H1 2017 H2 2018 H1 2018 H2 2019 H1 2019 H2 FY20
2020 H1 2017 H1 2017 H2 2018 H1 2018 H2 2019 H1 2019 H2 FY20
Half Year Half Year
EBITDA Earnings & Dividend per Share
186 20 18.4
200 100% 17.3 17.3
18 15.8 16.4
160 161 15.4
153 146 16
80%
ebitda/revenue (%)
150 140
cents per share
14 12.2
113 12
$ millions
60%
100 10 8.0 8.0 8.0 8.0 8.0 8.0
48% 51% 8 7.0
45% 52% 50% 40%
46% 48% 6
50
20% 4
2
0 0% 0
2017 H1 2017 H2 2018 H1 2018 H2 2019 H1 2019 H2 2020 H1
FY20 2017 H1 2017 H2 2018 H1 2018 H2 2019 H1 2019 H2 FY20
2020 H1
EBITDA EBITDA Margin (%) Half Year Half Year
EPS Dividend per share11 GROWTH STRATEGY CONTINUES
Underground Rosemont Garden Well Baneygo Tooheys Well Gloster
Moolart Well Garden Well Tooheys Well Gloster
Open Pits Extension Expansion Expansion Expansion
Discovery
New Projects McPhillamys
Ridge
Active projects
New sustaining projects
Duketon Duketon NSW Regional
Exploration Regional Expanded Satellites –
Satellites Greenfields Bald Hill Mid-Long term projects
Exploration, Development, Operating
Corporate Australian International
Growth12 FY20 GUIDANCE AND MEDIUM TERM OUTLOOK
Steady production growth with increasing underground contribution
Production Guidance 340,000 – 370,000oz gold production at A$1,125-$1,195/oz AISC1
Future Potential Production Step Change
400,000 McPhillamys Gold Project
Discovery Ridge
300,000
Production (ounces)
Potential Incremental Production at Duketon
Beyond Garden Well Underground
FY22
200,000 Baneygo Underground
Pleco Open Pit
100,000
Early Stage Testing
Gloster Underground
0 Regional Exploration across the belt
2014/15 2015/16 2016/17 2017/18 2018/19 2019/20 2020/21 2021/22
Open Pit Ounces Underground Ounces
1. Assumes a A$1,750 gold price - excludes royalty cost (~A$18/oz) impact associated with higher prevailing gold price13 ROSEMONT UNDERGROUND MINE
First Development
Progressing on plan Ore Delivered In July
PRE-FEASIBILITY STUDY METRICS1
Commencement Capital A$36 million
Maximum Cash Outflow A$41 million
Average Mining Rate 480 - 600ktpa
AISC A$1,120/oz
Mine Life ~5 years
First Ore Sept Q 2019
UG Resource – 1.7Mt @ 5.6 g/t
Au for 314koz
Excellent intercepts supporting
resource extensions
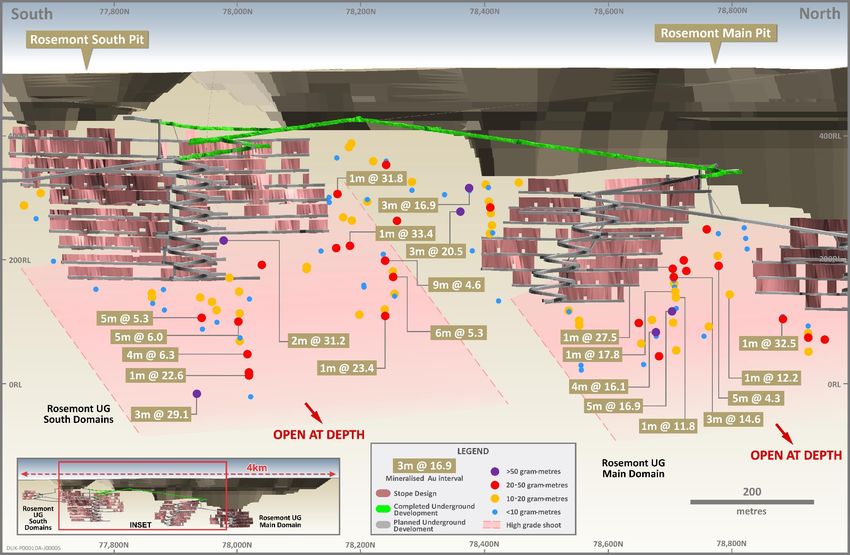
1. Refer to Regis ASX announcement released on 15 April 2019 for further details on the Pre-feasibility Study (PFS)14 ROSEMONT UNDERGROUND MINE
Progressing on plan
Key Milestones achieved to date:
1 year LTI free
Total development of over 3.7km
U/G Diamond Drilling underway
Southern escapeway and return airway established
Development of first ore levels complete
First ore to mill
U/G Development Face
Cutting the ventilation breakthrough portal First U/G ore to mill15 ROSEMONT UNDERGROUND MINE
Considerable mine life extension potential - drill testing commenced Delivered In July16 GARDEN WELL UNDERGROUND – TAKING SHAPE
High-grade southern plunge highlights UG potential In July
Zone of continuous mineralisation
up to 10m true widths, 80 – 100m
height and 300m N-S strike and
extends mineralisation >300m
below surface
Recent Highlights :
3m @ 2.8 g/t Au
2m @ 5.1 g/t Au
8m @ 4.7 g/t Au
7m @ 2.6 g/t Au
4m @ 2.8 g/t Au
2.7m @ 6.5 g/t Au
Design work on an underground
concept mine is underway.17 BANEYGO UNDERGROUND POTENTIAL
Multiple high grade intercepts under Central Pit demonstrate potential
Quartz dolerite host, same geology
and mineralisation style as Rosemont
High-grade vein systems expected to
grow
Highlights:
2m @ 15.4 g/t Au
4m @ 8.8 g/t Au
3m @ 12.7 g/t Au
2m @ 18.9 g/t Au
2m @ 19.5 g/t Au
2m @ 44.1 g/t Au
2m @ 21.6 g/t Au
2m @ 19.9 g/t Au
5m @ 9.8 g/t Au
9m @ 20.2 g/t Au18 FY20 GUIDANCE AND MEDIUM TERM OUTLOOK
Steady production growth with increasing underground contribution
Production Guidance 340,000 – 370,000oz gold production at A$1,125-$1,195/oz AISC1
Future Potential Production Step Change
400,000 McPhillamys Gold Project
Discovery Ridge
300,000
Production (ounces)
Potential Incremental Production at Duketon
Beyond Garden Well Underground
FY22
200,000 Baneygo Underground
Pleco Open Pit
100,000
Early Stage Testing
Gloster Underground
0 Regional Exploration across the belt
2014/15 2015/16 2016/17 2017/18 2018/19 2019/20 2020/21 2021/22
Open Pit Ounces Underground Ounces
1. Assumes a A$1,750 gold price - excludes royalty cost (~A$18/oz) impact associated with higher prevailing gold price19 MCPHILLAMYS GOLD PROJECT
A Significant Organic Growth Opportunity
Development Application (DA) is progressing – Exhibition and
Submission period has closed with no objections from any regulators
Regis’ Response to Submissions now underway
DA outcomes feed into the Definitive Feasibility Study (DFS)
DFS will update PFS and provide estimates of operating parameters,
capex and opex and a development timetable
Significant and ongoing community consultation continues20 MCPHILLAMYS GOLD PROJECT
100% owned and one of Australia’s largest undeveloped open pittable gold resources
MINERAL RESOURCE
2.29 Moz of gold
ORE RESERVE
2.02 Moz of gold
ANNUAL PRODUCTION AND MILLED GRADE
250 1.6
PRE-FEASIBILITY STUDY PHYSICALS1
1.4
200 Ore milled (Million tonnes) 60.1
1.2
Ounces (000’s)
(g/t) Au
1
150 Grade (g/t) 1.05
0.8
100 0.6 Recovery (%) 85
0.4 LOM gold produced (oz) 1,728,000
50
0.2
0 0 Avg annual production (oz) 192,000
Yr1 Yr2 Yr3 Yr4 Yr5 Yr6 Yr7 Yr8 Yr9
Strip ratio (volume w:o) 4.29
Ounces Recovered Milled Grade (g/t)
1. Refer to Regis ASX announcement released on 8 September 2017 for further details. Results to be updated as part of the DFS.21
DISCOVERY RIDGE PROJECT
A Potential Satellite Open Pit
Located 32km southwest of McPhillamys
Mineral Resource – 10.4Mt @ 1.2 g/t Au for 391koz
Near surface higher-grade mineralisation to add
Indicative significant value to McPhillamys Gold Project
pit outline
Extra works required at McPhillamys to be included in
DFS to ensure seamless incorporation of Discovery
Ridge in future mine plan
Historical Near Surface Highlights
86m @ 2.3 g/t Au from 14m
94m @ 2.1 g/t Au from 0m
60m @ 2.9 g/t Au from 9m
Drill hole 74m @ 2.2 g/t Au from 54m
59m @ 2.5 g/t Au from 1m
28m @ 3.3 g/t Au from 30m22 FY20 GUIDANCE AND MEDIUM TERM OUTLOOK
Steady production growth with increasing underground contribution
Production Guidance 340,000 – 370,000oz gold production at A$1,125-$1,195/oz AISC1
Future Potential Production Step Change
400,000 McPhillamys Gold Project
Discovery Ridge
300,000
Production (ounces)
Potential Incremental Production at Duketon
Beyond Garden Well Underground
FY22
200,000 Baneygo Underground
Pleco Open Pit
100,000
Early Stage Testing
Gloster Underground
0 Regional Exploration across the belt
2014/15 2015/16 2016/17 2017/18 2018/19 2019/20 2020/21 2021/22
Open Pit Ounces Underground Ounces
1. Assumes a A$1,750 gold price - excludes royalty cost (~A$18/oz) impact associated with higher prevailing gold price23 CONTINUED LIFE EXTENSION - RESERVE GROWTH
The major contributors to the near replacement in
CONSISTENTLY
REPLACING RESERVES FY2019 of Ore Reserves were:
4.5
Maiden Underground Ore Reserve at
4.06 4.03
4.0 Rosemont of 123,000 ounces; and
3.5 89,000 ounces at Moolart Well – Extra
McPhillamys Deposit
year of mine life. End of mining now FY22
3.0
57,000 ounces at Garden Well and
Ounces (million)
2.5
2.13 2.18
2.00 2.03 2.01 66,000 ounces at Dogbolter
2.0
1.75Moz
Increases are result of extensional drilling and
1.5
revised open-pit optimisation strategies.
1.0
An aggressive exploration programme at the
0.5 Duketon Project focussed on high potential areas for
Mineral Resource expansions is underway.
-
2015 2016 2017 2018 2019
Reserves Production Cumulative Production
Exciting new opportunities for life extension with
tripling of exploration ground in the Duketon Belt1
1. Refer to Regis ASX announcement released on 26 August 2019. Duketon Strategic Acquisition24 8Moz GOLD DISCOVERED TO DATE
Landholding triples to 3,000 km2 giving Regis control of 90% of the belt
Central
Zone
Accelerating Exploration in H2 2020
MOOLART WELL
Exploration budget increased by $7m to $31m for
FY2020
Risden Accelerated exploration on high-grade UG
120km
Well Campervan
extensions including Rosemont, Garden Well and
ROSEMONT
GARDEN WELL
Baneygo
Expanded Greenfields exploration activities on
newly acquired tenure will generate new large gold
Western targets (+1Moz) and significantly increase the
Sediments
Swincers
chances of new discoveries
1. Refer to Regis ASX announcement released on 26 August 2019. Duketon Strategic Acquisition.25 GROWTH STRATEGY CONTINUES
Underground Rosemont Garden Well Baneygo Tooheys Well Gloster
Moolart Well Garden Well Tooheys Well Gloster
Open Pits Extension Expansion Expansion Expansion
Discovery
New Projects McPhillamys
Ridge
Active projects
New sustaining projects
Duketon Duketon NSW Regional
Exploration Regional Expanded Satellites –
Satellites Greenfields Bald Hill Mid-Long term projects
Exploration, Development, Operating
Corporate Australian International
Growth26 INVESTMENT HIGHLIGHTS
Reliable production performance continues in H1 FY2020 with gold production of 178,482
ounces with AISC of A$1,226 per ounce
Cumulative dividend payments at A$448m since 2013
FY2020 Production Guidance of 340,000 - 370,000oz gold production at A$1,125-$1,195/oz AISC
and ~A$62m growth Capital
Consistent resource (8Moz) and reserves (4Moz) replacement and tripling of the prospective
ground holdings surrounding Duketon Operation
Underground production to become a significant contributor to the growth profile with the
Rosemont UG project development underway and Garden Well UG taking shape
Enviable pipeline of growth projects with McPhillamys one of Australia’s largest undeveloped
open pit gold resources and other potential underground production opportunities
Transparent ESG and Sustainability reportingAPPENDIX 1
JORC COMPLIANT
ORE RESERVE ESTIMATES 31 MARCH 2018
APPENDICES
i) FY20 Half Year Financial Results
ii) Hedging Strategy Details
iii) Project Pipeline
iv) Reserves and Resources - 31 March 2019
2728 Appendix i) FINANCIAL HIGHLIGHTS
Record Net Profit EBITDA
A$93M up 17% A$186m up 27%
Net Profit Margin +25% EBITDA Margin 50%
Cash flow from Cash & Bullion
Interim Dividend
operating activities A$169m*
8c per share
A$147m up 16% No debt
*Includes bullion on hand valued at $2,220 per ounce.29 Appendix i) FY2020 HALF YEAR PHYSICALS
FY 2020 Half Year FY19 H1
Physicals DNO DSO TOTAL TOTAL Variance
Ore mined (Mbcm) 0.67 1.39 2.06 2.52 -18% Production on track to meet full
year guidance 340,000 –
Waste mined (Mbcm) 3.19 10.19 13.38 13.15 +2% 370,000oz
Stripping ratio (w:o) 4.8 7.3 6.5 5.2 +25%
Ore mined (Mtonnes) 1.48 3.46 4.94 5.81 -15%
Good progress in underground
Ore milled (Mtonnes) 1.45 3.17 4.62 4.87 -5% mine development at Rosemont
Head grade (g/t) 1.11 1.35 1.28 1.24 +3% decline with first trial stoping
on track for later this quarter.
Recovery (%) 91.4% 94.9% 94.0% 93.7% 0%
Gold production (ounces) 47,620 130,861 178,482 181,366 -2%30
Appendix i) FY2020 HALF YEAR FINANCIAL RESULTS
Net Profit
H1 FY2020 H1 FY2019
Unit 31 Dec 2019 31 Dec 2018 A$93M up 17%
Ounces Produced oz 178,482 181,366
Ounces Sold oz 182,807 186,276
Average Realised Price $/oz 2,063 1,696
Sales Revenue $m 371.4 317.2
Royalties $m (17.5) (13.3)
Cost of Sales $m (210.0) (180.1)
EBITDA
Gross Profit $m 143.9 123.8 A$186m up 27%
Other Income $m 0.4 (0.2)
Administration and Other Costs $m (8.8) (8.5)
Finance Costs $m (1.1) (0.7)
Exploration expenditure written off $m (1.1) (0.0)
Profit Before Tax $m 133.3 114.4
Strong EBITDA
Income Tax Expense $m (39.9) (34.5) Margin
Net Profit After Tax $m 93.4 79.9 50%
All-in-Sustaining-Costs $/oz 1,226 95431 Appendix i) STRONG PERFORMANCE ON ALL PROFIT MEASURES
FY20 continues the trend
Net Profit After Tax
Revenue
100 93
400 371 89
90 85 83
338 80
350 317 80 77
299 307
290
300 70
252 61
60
$ millions
250
$ millions
50
200
40
150
30
100 20
50 10
0 0
2017 H1 2017 H2 2018 H1 2018 H2 2019 H1 2019 H2 FY20
2020 H1 2017 H1 2017 H2 2018 H1 2018 H2 2019 H1 2019 H2 FY20
Half Year Half Year
EBITDA Earnings & Dividend per Share
186 20 18.4
200 100% 17.3 17.3
18 15.8 16.4
160 161 15.4
153 146 16
80%
ebitda/revenue (%)
150 140
cents per share
14 12.2
113 12
$ millions
60%
100 10 8.0 8.0 8.0 8.0 8.0 8.0
48% 51% 8 7.0
45% 52% 50% 40%
46% 48% 6
50
20% 4
2
0 0% 0
2017 H1 2017 H2 2018 H1 2018 H2 2019 H1 2019 H2 2020 H1
FY20 2017 H1 2017 H2 2018 H1 2018 H2 2019 H1 2019 H2 FY20
2020 H1
EBITDA EBITDA Margin (%) Half Year Half Year
EPS Dividend per share32 Appendix i) CASHFLOW WATERFALL
Strong cashflow from operations of $179.1 million supported the current phase of increased capital investment
and also the payment of $40.7 million in dividends during the first half of FY2020
Cash & Bullion* on Hand - 31 December 2019
$450m
$400m $179.1m
$350m
($55.1m)
$300m ($19.9m)
($35.9m)
$250m $229.5m
$205.2m ($33.0m)
($10.9m)
$200m ($20.0m)
$168.8m
$150m ($40.7m)
$100m
*Includes bullion on hand valued at $2,220 per ounce.33 Appendix i) DIVIDEND
Regis continues to be an Australian gold industry leader on dividend payment metrics
Interim dividend of 8 cps ($40.7m) fully franked payout:
11% of H1 FY20 revenue and 22% of EBITDA
Regis has paid and/or declared 89cps - $448 million in dividends since 2013
Level of future dividends will continuously be assessed in the context of gold price, operational
performance and planned capital expenditure
Dividends Declared Cumulative Dividends Paid
18 500
16 450
14 400
cents per share
12 8 8 350
8
10 300
$ millions
8 9 250
448
6 200 407
4 8 8 8 150 326
6 7 245
2 4 100
170
0 50
75 75 105
2015 2016 2017 2018 2019 2020 0
interim final 2013 2014 2015 2016 2017 2018 2019 202034 Appendix ii) “SPOT DEFERRED” – FLEXIBLE GOLD HEDGE BOOK (31 Dec 2019)
Regis’ hedge position reduced to ~429koz at an average of A$1,617/oz.
2,500
2,360
Regis is currently actively managing the process of selling into the
2,000 lowest price hedges. Currently at a rate of approximately 10koz per
quarter – assuming a spot of A$2,360/oz this results in an overall 4%
drop in average price realised compared with the spot, as illustrated in
1,500
graph
2,257
1,000
Table 1: Hedging Volumes & Price Ranges Table 2: Current Hedging Volume Limits
500 Hedging Price Range Quantity (oz’s) Period Volume (oz’s)
A$1,400 - $1,500 187,000 Today – Dec 2020 600,000
0 A$1,500 - $1,600 15,000 Jan 2021 – Dec 2021 400,000
Gold Price A$1,600 - $1,700 36,000 Jan 2022 – Dec 2022 200,000
Ave spot price A$1,700 - $1,800 131,000 Jan 2023 – June 2023 100,000
Realised Price A$1,800 - $1,900 60,000 July 2023 Nil35
Appendix iii) PROJECT PIPELINE
▪ Moolart Well Ext.
▪ Baneygo – Idaho
▪ Gloster UG ▪ McPhillamys ▪ Gloster
▪ Moolart Well
▪ Garden Well UG ▪ Discovery Ridge
▪ Garden Well
▪ Beamish
▪ Duketon Greenstone Belt ▪ Garden Well OP Expansion ▪ Baneygo
▪ Russells ▪ Tooheys Well
▪ Tooheys UG ▪ Garden Well UG
▪ Erlistoun
▪ Petra
▪ Discovery Ridge UG ▪ Tooheys OP Expansion ▪ Rosemont OP and UG
▪ Dogbolter - Anchor
▪ Rosemont UG Ext.APPENDIX 1
JORC COMPLIANT
36 ORE RESERVE
Appendix ESTIMATES
iv) GROUP 31 MARCH
ORE RESERVES (312018
March 2019)37 Appendix iv) GROUP MINERAL RESOURCES (31 March 2019)
Further information:
Jim Beyer | Managing Director & CEO
+ 61 8 9442 2200
You can also read