Quantifying postharvest losses in Sub-Saharan Africa
←
→
Page content transcription
If your browser does not render page correctly, please read the page content below
Quantifying postharvest losses
   in Sub-Saharan Africa
       with a focus on cereals and pulses

Presentation at the Bellagio Workshop on Postharvest Management, 12-14 Sept 2017
                                         by
           Tanya Stathers, Natural Resources Institute (NRI),
                                University of Greenwich, UK,
                                     T.E.Stathers@gre.ac.uk
Quantifying PHL: Why?
• To understand how much food is being lost postharvest, where and why
• To help governments, development agencies, private companies and
  individuals better understand, target and prioritise their loss reduction
  interventions and policies
• Because we want to reduce the amount of loss and it is challenging to
  manage what is not measured
• To track progress on the major PHL reduction goals in SSA
   – Malabo Declaration to halve PHLs by 2025
   – SDG 12.3: By 2030, halve per capita global food waste at the retail and
     consumer levels and reduce food losses along production and supply
     chains, including post-harvest losses
   – Rockefeller YieldWise initiative which aims to demonstrate how the world can
     halve food loss by 2030 – with an initial focus on staple crops, fruits, and
     vegetables in Kenya, Nigeria and Tanzania
                                                                               2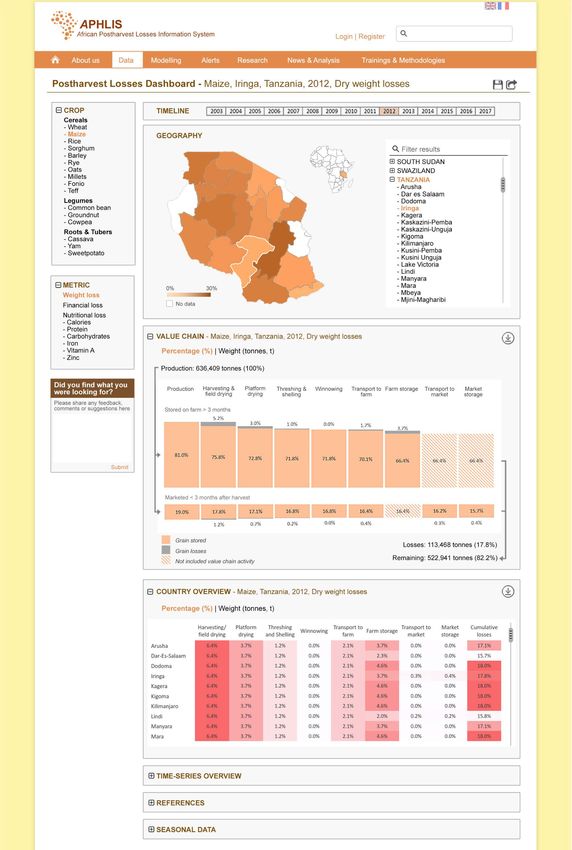
3
Postharvest Loss Quantification Systems
•   APHLIS – African Postharvest Losses Information System www.aphlis.net
•   Food Balance Sheets - http://www.fao.org/faostat/en/#data/FBS
•   Global Food Loss Index – Indicator 12.3.1 (SDG target 12.3)
     –   Model linked to change in food losses for country X over time, refined through case studies (FLAs,
         CLPS) and review, validated using Food Balance Sheets accounting framework
     –   Lowest hierarchical level = country commodity-specific

Other opportunities:
• LSMS - Living Standards Measurement Study -
     –   nationally representative survey with HH demographics, agro-ecology, market, consumption,
         assets and income information, able to compare across countries (Burkina Faso, Ethiopia, Malawi,
         Mali, Niger, Nigeria, Tanzania, Uganda)
     –   but v. low response rate to question on perceived % PHL[> 88% missing responses in Malawi
         (2010/11); Tanzania (2008/09 & 10/11 & 2012/13)] – and many HHs reporting 0% PHL.
     –   no breakdown of % loss by PH stage, although some PH system details & loss causes captured
•   Case studies with comparable methodology – using the elusive standardised loss
    assessment method
•   Scalable remote survey techniques e.g. Interactive Voice Response (IVR)

                                                                                                   4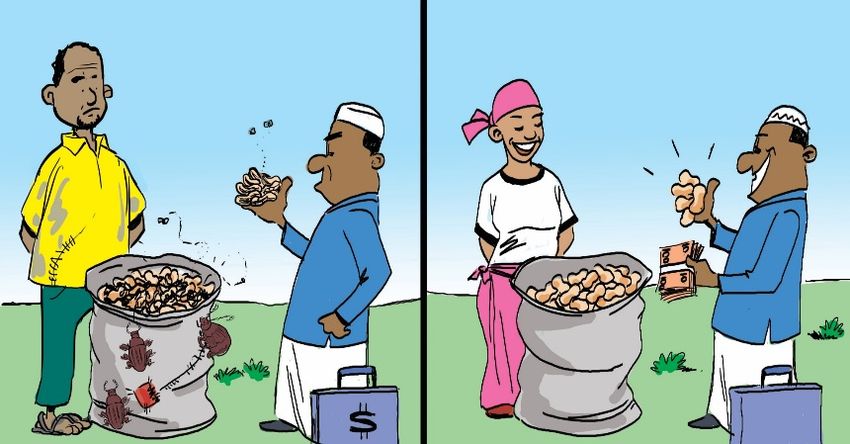
APHLIS
      The African Postharvest Losses Information System
What is APHLIS?
APHLIS estimates the annual % postharvest weight loss of cereal grains in sub-Saharan African countries.

How APHLIS works
APHLIS bases its estimates on postharvest loss data from the literature which is further contextualised using seasonal factors submitted
by a network of local experts.

APHLIS+ - expanding our scope
Funded by the Bill and Melinda Gates foundation from 2016 – 2020, the APHLIS+ project will add
new crops and financial & nutritional loss estimates to the data provided by APHLIS.                                            5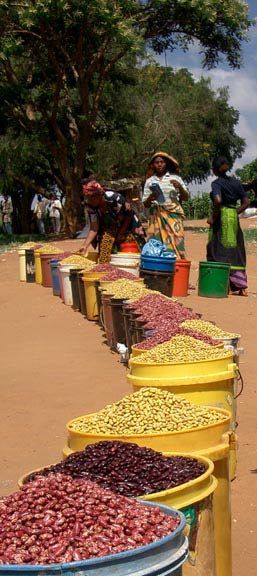
Iringa
17.8%
Dry weight losses
of maize, 2012

                    6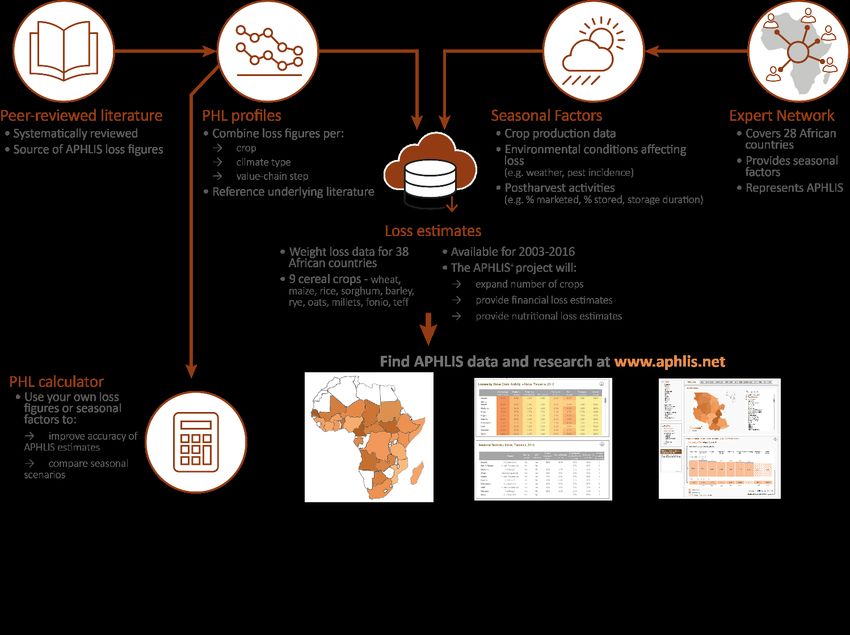
Type of Postharvest Loss?

                                 Qualitative loss
Quantitative (physical) loss     when the value/quality
when the quantity of commodity   of commodity is reduced
                                            lowered grade
available is reduced
                                      financial loss, nutritional loss,
         % weight loss               health hazard, seed viability loss

Broken    Insect      Rodent     Foreign        Mould        Discoloured
grains    damage      damage     matter         damage       grain

                                                                     7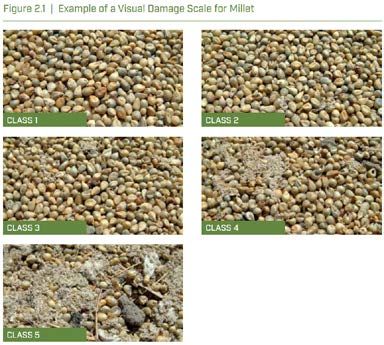
Nutritional loss
Research findings on
insect infestation of stored grain chemical changes during un-infested
storage of grain
Carbohydra reducing-sugar content (wheat). Storage length no effect on starch
tes starch (rice). content,
Reducing sugars increase , non-
reducing
High mc > carb fermentation
Nitrogen, Severe insect damage may reduce protein quality (maize, cowpeas). Rodents gained Protein solubility and in vitro
Amino less weight from infested grain, as it is unpalatable so they ate less. digestibility decrease
Acids, Total Nitrogen content increased in wheat, finger millet, maize, grams, bean, Amino-N increases during storage
Protein cowpea; no change in rice. In sorghum & g/nuts no change or increase due to attack on ~ Studies on nutritional value of
endosperm not pericarp (which contains more N). proteins in cereal and legume grains
Some loss of essential amino acids reported. For example, are variable and inconclusive
lysine & threonine, sorghum & green gram 3-4 mo, cowpea 6mo
tryptophan (24%) in Bengal gram; methionine (50%) in field bean
Nutritionally significant as lysine & threonine are limiting in cereal grains, and
methionine & tryptophan in legumes.
Lipids/ Fats Increase in free fatty acids (maize, wheat, rice, sorghum, legumes, groundnuts, Total lipids (oil)
and Fatty grams, beans, groundnut). Free fatty acids
Acids Increase in fat content of heavily weevil infested maize. Physical loss + Nutritional change
Vitamins B-vitamins: Losses in thiamine content (wheat, rice, maize, sorghum, millet, cowpea,
grams, field bean)
due to deterioration
Carotenes & tocopherols
~ Losses of thiamine (vit B1),
Losses in riboflavin content (sorghum, rice) riboflavin (vit B2) Vitamin E
Minerals Little change
Other Fibre due to hollow kernels, so less absorption of nutrients
Insect by-products > bad odours, flavours, some carcinogens, allergens
Reduced palatability, leading to reduced weight gains in rats
moisture can activate enzyme systems resulting in deterioration
Contaminants (e.g. excreta, fragments), and broken grain
Energy & ~ Varies with nutritional composition of food & insects’ feeding habits
Nutritional 8
Change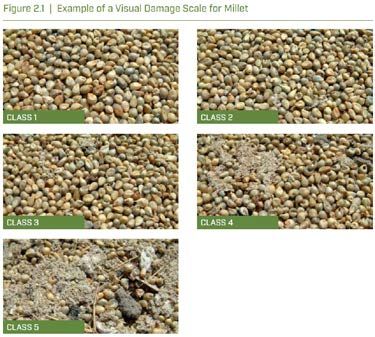
Financial loss
                                                               • Quality typically judged using visual characteristics
                                                               • Insect damage a key factor
                                                               • How does % damage relate to price discounting, for
                                                                 different crops, uses, places, & times in the season
                                                               • Seasonality; subjectivity
                                                               • % damage to % weight loss relationship in crops
Commodity         Chain level   Research                                Key findings                                                Study
(location)
Maize (Zambia)    Storage       Insect damage/ grade – price            Change in farmer’s subjective assessment; accepted and      Adams & Harman, 1977
                                relationship                            sold damaged maize more easily near end of season.
                                                                        Different standards used depending on intended use.
Maize (Ghana)     Storage       Insect damage-price relationship        0.6-1% price discounting for every 1% increase in damage;   Compton et al., 1998
                                                                        25-30% overall value loss
Maize (Malawi)    Marketing     Insect, mould damage and variety –                                                                  Jones et al., 2012
                                price relationship
Maize (Rwanda)    Marketing     Insect damage – farm-gate level         Moderate discount for 5-10% grain damage, while 20-30%      Jones et al., 2014
                                price relationship                      damage largely unmarketable. More tolerance to damage
                                                                        after several months storage 0.76% price discount per 1%
                                                                        damage, vs 1.28% at harvest
Maize (Benin)     Marketing     Insect damage – price relationship      10% increase in damage results in a 3-9% price discount.    Kadjo et al., 2016
                                                                        Discounts larger just after harvest than in lean period
Common beans      Storage       Insect damage-price relationship        2.3% price discount for every one bruchid hole per 100      Mishili et al., 2011
(Tanzania)                                                              grains
                  Storage       Insect damage-price relationship        12-18% price discounting for insect damage ranging 2.6-     Golob et al., 1999
                                                                        70%
Cowpeas (Ghana)   Storage       Insect damage-price relationship        1.2% price discount for every bruchid hole in 100 grains    Langyintuo et al., 2003
                  Marketing     Insect damage-price relationship        0.2-0.5% price discount for every bruchid hole per 100      Langyintuo et al., 2004
                                                                        grains
                  Storage       Consumer preference for quality         0.5% price discount for every bruchid hole in 100 grains;   Mishili et al., 2007
                                                                        consumers willing to pay a premium for quality
                                                                                                                                                     9
                                                                   Source: extracted from Affognon et al., 2014; and Jones & Alexander 2016
Sub-Saharan Africa PHL Figures & Trends

           [Global Food Losses and Food
           Waste report – FAO, 2011]      10
SSA PHL Figures and Trends continued
Cereal postharvest losses in sub-Saharan Africa % postharvest loss of cereals and pulses, East Africa
(Source: APHLIS www.aphlis.net ) (Source: Food Balance Sheet data)
20
18
% postharvest loss
16
14
12
10
8
6
4
2
0
2003 2004 2005 2006 2007 2008 2009
2010 2011 2012 2013 2014 2015 2016
Losses at different postharvest stages, sub-Saharan Africa, 2011 MAIZE PHLs by province (Source: APHLIS
(Source: APHLIS www.aphlis.net ) www.archive.aphlis.net )
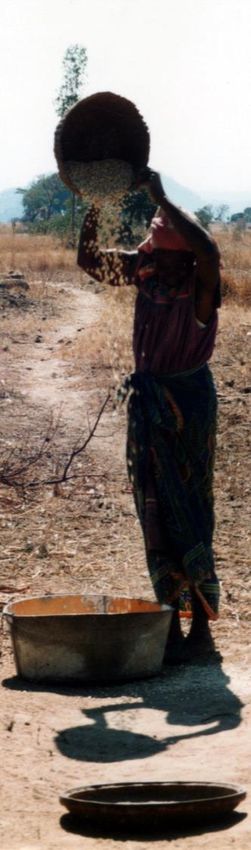
Harvesting/ Platform Threshing Transport Farm Transport Market
Winnowing
field drying drying and Shelling to farm storage to market storage
Barley 4 - 3.5 0 2.5 0.6 1 2.4
Fonio 3.9 - 3.5 2.5 2.5 0.2 1 2.7
Maize 6 3.8 1.7 - 2.2 4.4 1.4 2.7
Millets 3.6 - 2 1.4 2.5 0.9 1 2.6
Oats 2 - - - - - - 1.3
Rice 5.5 - 3.1 2.5 1.3 0.8 1 2.6
Sorghum 4.9 - 3.6 0 2.2 2.4 1 2.6
2011
Teff 3.5 - 3.5 2.5 2.5 0.3 1 2.7 2010
Wheat 5.4 - 3.5 0 2.5 4 1 2.4
11At which PH stages do most PHLs occur and why?
12Postharvest Loss Quantification and/or
Measurement Methods
Include: Few method comparisons
30 25.8
• Direct weighing and load-tracking 18.6
Mean % loss (± SD)
20 12.5 14.5
9.4 9.3 9.910.112.4 8.6 5.6 6.6 6 6.3 7 5.3 7.3 5.6 5.9
10 2.2 2.3
• Counting 0
Barley Wheat A Wheat B
• Surveys Visual appraisal of insect damage
Uncorrected weight loss
Modified standard volume/dry-weight ratio
• Records Grain count and weight
% damaged grains converetd to weight loss
• Price discounting study 1000 grain mass (TGM)
TGM + dust
Alonso-Amelot & Avila-Nunez, 2014
• Food proximate analysis Possible issues
• Mycotoxin analysis • Double counting losses at different PH stages
Grain withdrawals / consumption not factored in
• Carbon footprint/ Life Cycle Assessment
•
• Not defining loss clearly
• Confusing % damage and % loss
Count and weigh Rapid loss assessment, visual • Quality loss and quantity loss, past focus on weight loss,
scales how to combine quality & quantity loss in a single figure
• Subjectivity, agendas
• Spatial, temporal spread of PH activities
• Limited measuring, methods often unclear
• Storage & Micro-level PHL studies and reporting
30 Bassey et al., 2017
maize focus 25
Frequency of usage
• Extremes 20
used as 15
opposed to 10
averages 5
• Treating 0
partial Subjective Rapid Direct (or Simulation Trials
assessment assessment actual)
damage as assessment
Hodges et al., 2014 total loss VM not reported 13
VM not clear
VM clearly reported can calculate VM
VM = variabilityComparing findings on level of PHL by PH stage
Comparing perceived critical loss points (CLPs) and measured loss from recent national food
loss assessment (FLA) and other case studies, with APHLIS % dry weight loss estimates
SSA Zimbabwe Burkina Faso Uganda DRC Malawi
Maize Maize Maize Sorghum Cowpea Maize Maize Rice Maize
PH stage
APHLIS FP FP APHLIS SHP Meas. APHLIS SHP Meas. APHLIS SHP Meas. SHP Meas. APHLIS SHP APHLIS SHP APHLIS FP APHLIS
% DWL CLPs % PHL % DWL CLPs % loss % DWL CLPs % loss % DWL CLPs % loss CLPs % PHL % DWL CLPs % DWL CLPs % DWL % PHL % DWL
Harvesting **** **** 3.5 **** 5.4 **** 8.7 **** 3.3 ****
5.7 13.9 6.4 3.8 4.6 3.8 3.8 4.4
Field drying **** **** **** **** 3.8
3
Transport
2.3 ** 4.6 2.4 1.9 **** 0.3 2.2 1.9 1.9 1.3
(field to home) 1.9
Homestead
3.9 *** 7.2 4 3.5 3.5 3.5 ****
drying 3.5
Threshing/
1.6 **** 3 1.3 **** 5.6 2.3 **** 0.47 3.6 **** 1.1 2.3 2.3 3.1
Shelling 2.3
4.5 4.6 2.3 4.2
Storage (home) 4.5 *** 9.4 **** 2.7 (5m) 0.02 (5m) 2.7 (7m) **** 35 (5m) **** 17 (?m) 4.6 (6m) **** **** 1.2 1 (?m)
(8m) (7m) (12m) (10m)
Storage (coop/
/ * / / / / **** / /
a ggrega ted) /
Sorting &
/ * / / / / / /
grading /
Transport
1.5 * 1.7 **** 0.3 1 **** 1 1 **** 1 1
(farm> market) 1
Milling / * / **** 20 a / / **** 5 / / / 1 /
Marketing / * / / / / / / /
Storage
2.7 2.7 2.7 **** 2.7 2.7 **** 2.7 2.7
(market) 2.7
Total 17.8 17.2 20.9 12.7 18.2 17.2 13.9 19.3
F-
A - 2015 - E- E-
A - 2015 A - 2015 D - 2015/16 A - 2008 A - 2011 2014/2016
C - 2015/16 Ha uts - C - 2015/16 Boucl e Boucl e 2015/16 A - 2011 2015/16 A - 2012
Source: A - 2015 B - 2015/6 Ma s h Ha uts - C - 2015/2016 Nord Northern Uga nda Northern Ba s - C. Ma l a wi
Ba s s i ns du Mouhoun du Kwi l u, Ba ndunu Ba s - Centra l
Ea s t Ba s s i ns (Apa c & Li ra ) Uga nda Congo (Dowa &
Mouhoun Ba ndunu Congo
Ntchi s i )
Key: FP = Farmer perceived; SHP = Stakeholder perceived; Meas. = Measured; PHL=postharvest loss; DWL = dry weight loss
Sources: A = APHLIS; B = Mvumi et al., 2017; C = Tagnan et al., 2017; D = Muyinza et al., 2017; E = Sumbu et al., 2017; F = Ambler et al., 2017
Maize – CLPs: Harvesting, Threshing, Storage, [Milling – transformation, eqpt?]. Sorghum – H, Th, St plus transport
Rice – H, Dry, St – [usually threshing also a CLP]. Cowpea – H, Dry, Thr, St
Magnitude of loss differs by method, but mainly agree on which stages have most losses. APHLIS is an estimation tool where direct
measurements not available.
14
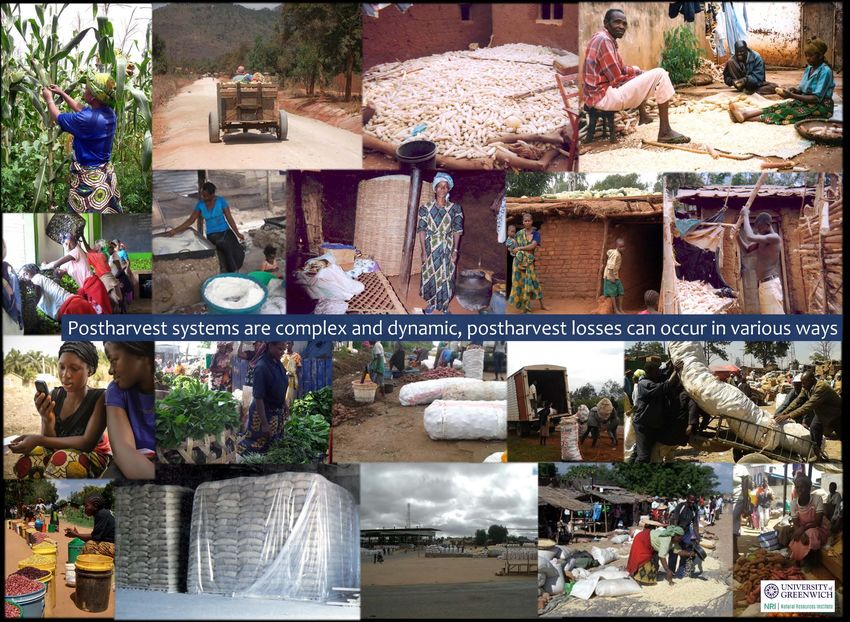
There is a lot of other PHL data much from surveys or storage trials, this table compares a few with figures across different PH stagesRecent research on most effective
PHL reduction methods
Capacity building
Need to invest in building PH skills & understanding throughout the agricultural innovation system & schools
Postharvest Agricultural Innovation System (AIS) strengthening
Loss reduction needs national recognition and commitment
Awareness raising - as many PH activities are private and invisible, with highly gendered roles
Consider PH issues when promoting new varieties, fertilisers etc.
Build capacity of AIS actors to compare practices and technologies and adapt to uncertain future scenarios
Better collaboration between those working on addressing and quantifying PHL at scale
AgResults incentivising private sector involvement in grain storage in Kenya:
– 636,090 hermetic devices sold, creating 189,419 extra MT of improved storage since 2016.Impact comparison vs subsidised approaches
Quality sensitive markets to pull improved quality, farmer aggregation & financial access
Food Reserves (national or regional) offering large-scale, ‘potentially’ better controlled storage conditions
Technologies
No silver bullets, a technology-focus alone will not bring change
Hermetic bags effective & affordable, need promoting with PHM grain drying, hygiene, rodent management,
market linkage, and financial access etc.
Diatomaceous earth grain protectants highly effective, minimal private sector involvement to date in SSA
Mobile drying, threshing services operating as private businesses
Outstanding challenges
• Drying of crops given increasingly variable climates, more high MC related PHLs e.g. aflatoxins
• Reducing harvesting losses
• Poor efficacy of many existing chemical grain protectants
• High risk of phosphine resistance (poor fumigations, v. limited other options in medium to large scale storage)
• Imbalance in support for tangible options vs skill knowledge building & linkages
• Better understanding of non-farm PH stage challenges and opportunities (transport, trader & large-scale
storage, consumer food waste in SSA)
• Going from pilot to scale, unrealistic time -frames, oscillating interest in PHL reduction
15You can also read