TREASURY AND FEDERAL RESERVE FOREIGN EXCHANGE OPERATIONS
←
→
Page content transcription
If your browser does not render page correctly, please read the page content below
TREASURY AND FEDERAL RESERVE
                FOREIGN EXCHANGE OPERATIONS

                                              January – March 2018

The U.S. dollar, as measured by the Federal Reserve Board’s trade-weighted major currencies index,
depreciated 1.4 percent in the first quarter of 2018. The dollar was viewed as driven by a variety of
factors, including the greater scope for monetary tightening abroad, improving global growth, and an
anticipated rise of U.S. fiscal and current account deficits. Among major currencies, the dollar
depreciated 2.6 percent against the euro and 5.7 percent against the Japanese yen, and appreciated 2.6
percent against the Canadian dollar. The dollar depreciated against most emerging market currencies,
including 7.5 percent against the Mexican peso and 3.6 percent against the Chinese renminbi. The
Federal Reserve and U.S. Treasury did not intervene in foreign exchange markets during the quarter.

This report, presented by Simon Potter, Executive Vice President, Federal Reserve Bank of New York, and Manager of
the System Open Market Account, describes the foreign exchange operations of the U.S. Department of the Treasury
and the Federal Reserve System for the period from January through March 2018. Patrick Douglass was primarily
responsible for preparation of the report.

                                                                                                                 1
Chart 1
MAJOR CURRENCY TRADE-WEIGHTED U.S. DOLLAR
Index Index
91 91
90 90
89 89
88 88
87 87
86 86
85 85
84 84
September 30 October 31 November 30 December 31 January 31 February 28 March 31
Sources: Board of Governors of the Federal Reserve System; Bloomberg L.P.
Chart 2
EURO–U.S. DOLLAR EXCHANGE RATE
Dollars per euro Dollars per euro
1.26 1.26
1.24 1.24
1.22 1.22
1.20 1.20
1.18 1.18
1.16 1.16
1.14 1.14
1.12 1.12
September 30 October 31 November 30 December 31 January 31 February 28 March 31
Source: Bloomberg L.P.
2Chart 3
U.S. DOLLAR–YEN EXCHANGE RATE
Yen per dollar Yen per dollar
114 114
112 112
110 110
108 108
106 106
104 104
September 30 October 31 November 30 December 31 January 31 February 28 March 31
Source: Bloomberg L.P.
Chart 4
MARKET-IMPLIED RATES ON FEDERAL FUNDS FUTURES
Yield Yield
2.6 2.6
2.4 2.4
2.2 2.2
2.0 2.0
1.8 1.8
December 29, 2017
1.6 January 26, 2018 1.6
1.4 March 29, 2018 1.4
1.2 1.2
Dec Mar Jun Sep Dec Mar Jun Sep Dec Mar Jun Sep Dec
2017 2018 2018 2018 2018 2019 2019 2019 2019 2020 2020 2020 2020
Source: Bloomberg L.P.
3U.S. DOLLAR DEPRECIATION CONTINUES ON STRUCTURAL AND IDIOSYNCRATIC
FACTORS
The trade-weighted U.S. dollar depreciated an additional 1.4 percent in the first quarter of 2018,
reflecting a combination of structural and idiosyncratic factors. As was the case in late 2017, U.S.
dollar depreciation occurred despite a further increase in U.S. interest rate differentials vis-à-vis
advanced economy peers. Investors broadly attributed this decoupling to relative policy expectations,
noting that U.S. policy rates are close to their estimated terminal rate, while other advanced
economies––including the euro area, the United Kingdom, Japan, and Canada––are viewed as still in
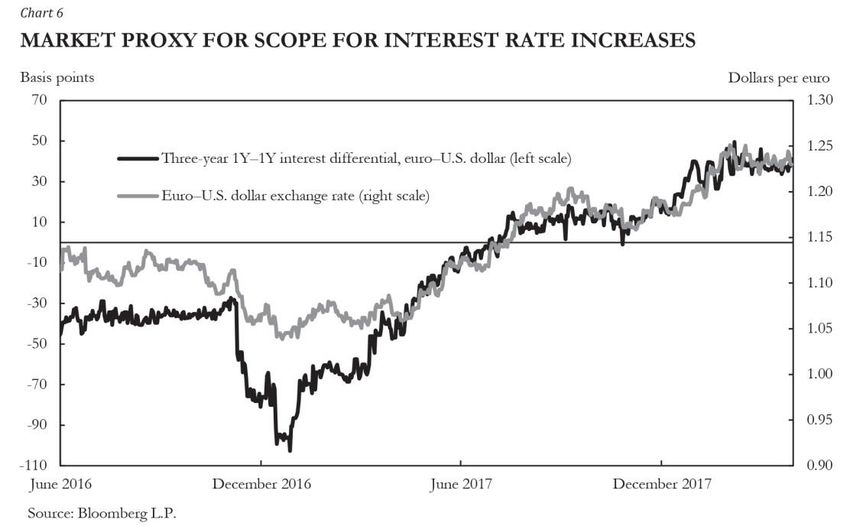
the early stages of policy normalization. In support of this view, market contacts noted that the euro–
dollar exchange rate now has a fairly close correlation with the policy rate slope differential between
the United States and the euro area. U.S. growth differentials with the rest of the world were also
seen as contributing to U.S. dollar depreciation. While U.S. growth is expected to remain robust,
higher forecasted growth elsewhere could increase the attractiveness of other G10 currencies. These
expectations were partly shaped by the fact that growth in the euro area has outpaced growth in the
United States for the past two years while Chinese growth saw a modest acceleration for the first
time since 2010.
Following the passage of U.S. tax reform legislation last year, the possibility of a rise in the U.S.
fiscal and current account deficits (often referred to as “twin deficits”) was viewed as a potential new
factor weighing on the U.S. dollar. In particular, some market participants expect that the fiscal
stimulus amid limited economic slack could stimulate import growth and widen the current account
deficit while resulting in only a modest acceleration in short-term GDP growth. Market contacts have
highlighted a number of current factors in conjunction with the twin deficits that could potentially
drive U.S. dollar depreciation going forward: fiscal expansion amid limited spare capacity, high
current U.S. public debt levels, global competition for capital, and a perceived shift in U.S. economic
policy.
Idiosyncratic factors were also seen as driving the dollar in the first quarter. In January, concerns
over U.S. official comments regarding the U.S. dollar were viewed by some as contributing to dollar
depreciation. The dollar was also seen as facing pressure from heightened trade tensions following
U.S. announcements of new tariffs on various imported goods. Indeed, on days of heightened trade
concerns, the U.S. dollar typically weakened against other major currencies, such as the euro, yen,
and Swiss franc, while strengthening against emerging market currencies.
U.S. monetary policy developments were seen as playing a modest role in driving the dollar in the
first quarter. At its March 21 meeting, the Federal Open Market Committee (FOMC) raised the
federal funds rate 25 basis points, as expected, and reiterated its expectations for a total of three rate
hikes over the year. In addition, the median of FOMC participants’ target rate projections in the
Summary of Economic Projections (SEP) was revised slightly higher for 2019, 2020, and the longer
4term. While market contacts interpreted the FOMC statement and SEP materials as indicating a
strengthening of the economic outlook by the Committee, and as consistent with a slightly more
rapid removal of policy accommodation beyond 2018 than had been expected, the U.S. dollar
depreciated modestly on the day. The nominal Treasury yield curve shifted up over the quarter, with
the most pronounced move coming in January amid an improved outlook for domestic and foreign
economic growth.
Chart 5
TRADE-WEIGHTED U.S. DOLLAR AND INTEREST RATE
DIFFERENTIALS
Index Percent
2.0
97
Trade-weighted U.S. dollar (left scale)
95 Two-year Treasury yield differential (right scale) 1.8
Ten-year Treasury yield differential (right scale)
93
1.6
91
1.4
89
1.2
87
1.0
85
83 0.8
June 2017 August 2017 October 2017 December 2017 February 2018
Sources: Bloomberg L.P.; Board of Governors of the Federal Reserve System; New York Fed staff calculations.
5EURO SUPPORTED BY STRONG ECONOMIC DATA, ECB COMMUNICATIONS, AND
PERCEIVED REDUCTION IN POLITICAL RISK
The U.S. dollar depreciated 2.6 percent against the euro in the first quarter amid strong euro area
economic activity, less accommodative signals from the European Central Bank (ECB), and a
perceived reduction of political risk in the euro area.
As was the case during much of last year, euro area economic data, such as the purchasing
managers index, remained strong relative to the United States, contributing to broad euro strength
against the U.S. dollar. Market participants also linked euro strength to evolving communication
from the ECB. The ECB’s December meeting minutes, released on January 11, were viewed by
market participants as signaling less monetary policy accommodation, resulting in a notable
appreciation of the euro against the U.S. dollar. In particular, the minutes noted that the ECB
Governing Council’s communication would need to evolve in the case of positive economic
developments, and stated that forward guidance could be revisited. Several weeks later, at a press
conference following the ECB’s January 25 meeting, President Draghi’s use of positive language to
describe the euro area’s economic outlook was seen by market participants as signaling a shift toward
less monetary accommodation, driving euro appreciation and increases in euro area sovereign yields.
In March, German Chancellor Merkel’s preliminary agreement to form a coalition government and
the passing of the Italian election were viewed as supportive of the euro on the margin insofar as
they reduced political risk in the region.
6Chart 7
U.S. DOLLAR PERFORMANCE AGAINST G-10 CURRENCIES
DURING THE FIRST QUARTER
Japanese yen
Norwegian krone
British pound
Euro
Danish krone
Swiss franc U.S. dollar
depreciation
New Zealand dollar
Australian dollar
Swedish krona
Canadian dollar
-7.0 -6.0 -5.0 -4.0 -3.0 -2.0 -1.0 0.0 1.0 2.0 3.0 4.0
Percent
Source: Bloomberg L.P.
JAPANESE YEN APPRECIATES NOTABLY AMID BOJ POLICY ADJUSTMENT, SAFE
HAVEN INFLOWS, AND POSITIONING DYNAMICS
The U.S. dollar depreciated 5.7 percent against the Japanese yen in the first quarter, driven by
monetary policy developments, safe haven inflows in response to rising financial market volatility,
and technical factors. On January 9, the Bank of Japan (BoJ) announced that it had reduced its bond
purchases in the ten- to twenty-five-year part of the curve, which was viewed as driving a 1.5 percent
appreciation of the yen against the dollar and a 2 basis point increase in ten-year Japanese
government bond yields over the following two days. Later in the quarter, the yen experienced bouts
of appreciation as financial market volatility drove investors to increase their allocations of yen-
denominated assets, which are widely regarded as safe by investors. Indeed, the yen appreciated
notably against the dollar following the global equity market selloff in February and heightened trade
tensions in March.
Positioning dynamics and repatriation flows were seen as an additional factor contributing to yen
appreciation in the first quarter. At the start of the year, the yen was one of the few currencies in
which noncommercial market participants held a net short position against the dollar, according to
data from the Commodity Futures Trading Commission. Contacts noted that the unwinding of these
short positions may have exacerbated yen strength over subsequent months as positioning moved to
a more neutral level. At the margin, some market participants noted that the repatriation of earnings
by Japanese corporations ahead of fiscal year-end and a slowdown in the accumulation of U.S. assets
by Japanese investors may also have contributed to yen strength.
7EMERGING MARKET CURRENCIES BROADLY STRENGTHEN AGAINST THE
DOLLAR, LED BY THE MEXICAN PESO AND CHINESE RENMINBI
The U.S. dollar broadly depreciated against emerging market currencies in the first quarter, with the
JP Morgan Emerging Markets Currency Index rising 1.8 percent. Within the Federal Reserve Board’s
trade-weighted dollar index, U.S. dollar weakness was most pronounced against the Mexican peso
and the Chinese renminbi.
In contrast to the perceived increase in trade concerns in some regions, trade concerns among the
North American Free Trade Agreement (NAFTA) countries were viewed by market contacts as
easing. Indeed, investors broadly attributed the U.S. dollar’s 7.5 percent depreciation against the
Mexican peso to increased optimism that Mexico’s negotiations with the United States regarding
NAFTA would culminate in a new agreement rather than a NAFTA termination. Market contacts
were particularly attentive to signs of continued progress on key areas of contention, including rules
of origin, the NAFTA dispute resolution mechanism, and the renegotiation timeline. The decision by
Banco de México (BdM) to raise its policy rate an additional 25 basis points in February was also
viewed as supportive of the currency. Separately, the U.S. dollar appreciated 2.6 percent against the
Canadian dollar in the first quarter. However, market participants primarily attributed this to more-
8accommodative-than-expected communications from the Bank of Canada (BoC), rather than
NAFTA-related developments.
The U.S. dollar’s 3.6 percent depreciation against the Chinese onshore renminbi in the first quarter
was attributed to a number of factors, including China’s stable growth backdrop, relatively balanced
capital flows amid continued capital controls, and a perceived increase in policymaker tolerance for
renminbi strength at a time of rising trade tensions with the United States. Some market participants
noted that the currency was also supported by Chinese corporates, which have reportedly begun to
unwind some of their long-dollar, short-renminbi positions that had been accumulating since 2015.
In late March, reports that renminbi-denominated bonds would be included in the Bloomberg-
Barclays Global Aggregate Index were viewed as boosting sentiment on the currency and
contributing to a modest appreciation against the U.S. dollar. After their annual work conference, the
People’s Bank of China and China’s State Administration of Foreign Exchange released a statement
expressing their commitment to continuing recent reforms toward a more market-oriented exchange
rate as well as two-way capital account liberalization—comments that were viewed by some as
signaling policymaker preference for greater two-way volatility in the U.S. dollar–Chinese renminbi
exchange rate.
Chart 9
U.S. DOLLAR PERFORMANCE AGAINST EMERGING MARKET
CURRENCIES DURING THE FIRST QUARTER
Turkish lira
Indian rupee
Indonesian rupiah
Brazilian real
Korean won
Russian ruble
U.S. dollar
Singapore dollar depreciation
Chilean peso
Polish zloty
Taiwanese dollar
Chinese renmimbi
South African rand
Malaysian ringgit
Colombian peso
Mexican peso
-10 -8 -6 -4 -2 0 2 4 6
Percent
Source: Bloomberg L.P.
9FOREIGN EXCHANGE SWAP BASIS SPREADS NARROW AMID REPORTED
REDUCTION IN FOREIGN EXCHANGE HEDGING DEMAND
During the first quarter, the three-month foreign exchange swap basis spreads of key U.S. dollar
currency pairs initially widened as demand for prefunding increased ahead of the March 31 quarter-
end period.1 According to market participants, these swap basis spreads then narrowed notably
toward the end of the quarter, suggesting that prefunding activity had slowed. Reduced foreign
exchange hedging demand by foreign investors further contributed to this narrowing; contacts said
the decrease in demand stemmed in part from a reduction in these investors’ holdings of dollar
assets.
Chart 10
FOREIGN EXCHANGE SWAP-IMPLIED BASIS SPREADS
Basis points Basis points
-10 -10
-30 -30
-50 -50
-70 -70
-90 -90
Euro–U.S. dollar three-month
U.S. dollar–yen three-month
-110 -110
June 2015 December 2015 June 2016 December 2016 June 2017 December 2017
Source: Bloomberg L.P.
1The foreign exchange swap basis represents the premium to borrow dollars in the foreign exchange swap
market relative to the London Interbank Offered Rate.
10TREASURY AND FEDERAL RESERVE FOREIGN EXCHANGE HOLDINGS
The Federal Reserve and U.S. Treasury did not undertake any intervention operations during the
quarter. As of March 31, the value of the U.S. Treasury’s Exchange Stabilization Fund (ESF) foreign-
currency-denominated assets totaled $22.2 billion, comprised of euro and yen holdings. The Federal
Reserve System Open Market Account (SOMA) holdings of foreign-currency-denominated assets
also totaled $22.2 billion, comprised of euro and yen holdings.
Foreign Exchange Reserve Holdings
The Federal Reserve and U.S. Treasury invest their foreign currency reserves, which are held in the
SOMA and the ESF, in a variety of instruments that yield market rates of return in their respective
currencies and have a high degree of liquidity and credit quality. The Authorization for Foreign
Currency Operations defines the permitted investments for the SOMA foreign currency portfolio.
The Open Market Trading Desk of the Federal Reserve Bank of New York (the Desk) utilizes an
investment framework for the management of the foreign currency assets. The framework involves a
routine affirmation of objectives and constraints from policymakers. The Desk then utilizes an
investment approach designed to meet those objectives to maximize return subject to maintaining
sufficient liquidity and a high degree of safety.
In terms of the composition of foreign currency reserves, a significant portion of the Federal
Reserve and U.S. Treasury’s foreign exchange reserves remained invested on an outright basis in
German, French, Dutch, and Japanese government securities. Foreign currency reserves may also be
invested at the Bank for International Settlements and in instruments at other official institutions,
such as the Deutsche Bundesbank, the Banque de France, and the Bank of Japan. To the greatest
extent practicable, the investments are split evenly between the SOMA and the ESF.
As of March 31, the euro reserves held by both the SOMA and the ESF totaled $26.8 billion, an
increase from $26.2 billion, owing to foreign exchange translation effects as the dollar depreciated
against the euro. Cash held in euro-denominated deposits at official institutions increased to $12.9
billion from $12.1 billion, while direct holdings of euro-denominated government securities
decreased to $14.0 billion from $14.1 billion. The amount of yen-denominated deposits and
government securities held by the SOMA and the ESF rose to $17.6 billion from $16.6 billion at
quarter-end, which was mostly attributable to the appreciation of the yen against the dollar.
Consistent with the current Authorization for Foreign Currency Operations, the Desk conducts
small-value exercises for the foreign currency reserves as a matter of prudent advance planning. No
inference about policy should be drawn from these exercises. In the first quarter, the Desk entered
11into a small-value euro-denominated repurchase agreement and conducted small-value euro-
denominated deposit tests.
Liquidity Swap Arrangements with Foreign Central Banks
As of March 31, the ECB had $5.0 billion of swaps outstanding. The BoJ, BoC, Bank of England,
and Swiss National Bank did not have any dollar swaps outstanding at the end of the quarter.
12Table 1
FOREIGN CURRENCY HOLDINGS OF U.S. MONETARY AUTHORITIES
BASED ON CURRENT EXCHANGE RATES
Millions of U.S. Dollars
Changes in Balances by Source
Unrealized
Carrying Value, Net Realized Gains/Losses on
December 31, Purchases Investment Gains/Losses Foreign Currency Carrying Value,
2017a and Salesb Earningsc on Salesd Revaluatione March 31, 2018a
Federal Reserve System
Open Market Account
(SOMA)
Euro 13,105 0 (7) 0 325 13,423
Japanese yen 8,293 0 0 0 507 8,800
Total 21,398 0 (6) 0 832 22,223
Changes in Balances by Source
Unrealized
Carrying Value, Net Realized Gains/Losses on
December 31, Purchases Investment Gains/Losses Foreign Currency Carrying Value,
2017a and Salesb Earningsc on Salesd Revaluatione March 31, 2018a
U.S. Treasury Exchange
Stabilization Fund (ESF)
Euro 13,085 0 (7) 0 324 13,402
Japanese yen 8,293 0 0 0 507 8,800
Total 21,377 0 (6) 0 831 22,202
Note: Figures may not sum to totals because of rounding.
a Carrying value of the reserve asset position includes interest accrued on foreign currency, which is based on the “day of” accrual method.
b Net purchases and sales include foreign currency purchases related to official activity, as well as repayments and warehousing.
c Investment earnings include accrued interest and amortization on outright holdings.
d Gains and losses on sales are calculated using average cost.
e Reserve asset balances are revalued daily at the noon buying rates.
13Table 2
BREAKDOWN OF FOREIGN RESERVE ASSETS HELD
Carrying Value in Millions of U.S. Dollars, as of March 31, 2018
U.S. Treasury Exchange Federal Reserve System
Stabilization Fund (ESF)a Open Market Account (SOMA)a
Euro-denominated assets 13,402.2 13,423.0
Cash held on deposit at official institutions 6,420.5 6,441.3
Marketable securities held under
repurchase agreementsb 0.0 0.0
Marketable securities held outright 6,981.7 6,981.7
German government securities 2,099.7 2,099.7
French government securities 3,204.0 3,204.0
Dutch government securities 1,678.0 1,678.0
Japanese yen-denominated assets 8,800.1 8,800.1
Cash held on deposit at official institutions 7,244.9 7,244.9
Marketable securities held outright 1,555.2 1,555.2
Reciprocal currency arrangements
European Central Bankc 5,011
Bank of Japanc 0
Swiss National Bankc 0
Bank of Canadac 0
Bank of Englandc 0
Banco de Méxicoc 0
Note: Figures may not sum to totals because of rounding.
a As of March 31, the SOMA and the ESF euro portfolios had Macaulay durations of 23.22 and 23.26 months, respectively;
both the SOMA and ESF yen portfolios had Macaulay durations of 3.88 months.
b Sovereign debt obligations of Belgium, France, Germany, Italy, the Netherlands, and Spain are currently eligible collateral
for reverse repo transactions.
c Carryingvalue of outstanding reciprocal currency swaps with the European Central Bank, the Swiss National Bank, the
Bank of Japan, the Bank of Canada, the Bank of England, and Banco de México.
14Table 3
RECIPROCAL CURRENCY ARRANGEMENTS
Millions of U.S. Dollars
Outstanding as of
Institution Amount of Facility March 31, 2018
Federal Reserve System Open Market Account (SOMA)
Reciprocal currency arrangement
Bank of Canada 2,000 0
Banco de México 3,000 0
Standing dollar liquidity swap arrangement
European Central Bank No preset limit 5,011
Swiss National Bank No preset limit 0
Bank of Japan No preset limit 0
Bank of Canada No preset limit 0
Bank of England No preset limit 0
No preset limit 5,011
Standing foreign currency liquidity swap arrangements
European Central Bank No preset limit 0
Swiss National Bank No preset limit 0
Bank of Japan No preset limit 0
Bank of Canada No preset limit 0
Bank of England No preset limit 0
No preset limit 0
U.S. Treasury Exchange Stabilization Fund (ESF)
Banco de México 3,000 0
3,000 0
15You can also read