2020 Interim Results Presentation - Xtep International Holdings Limited (Incorporated in the Cayman Islands with Limited Liability) Stock Code: ...

Page created by Heather Bates
 
CONTINUE READING
2020 Interim Results Presentation - Xtep International Holdings Limited (Incorporated in the Cayman Islands with Limited Liability) Stock Code: ...
Xtep International Holdings Limited
(Incorporated in the Cayman Islands with Limited Liability)
Stock Code: 1368.HK

2020 Interim Results Presentation
28 August 2020
2020 Interim Results Presentation - Xtep International Holdings Limited (Incorporated in the Cayman Islands with Limited Liability) Stock Code: ...
1H2020 Highlights

              Revenue
              RMB 3,679 m              10%
              Operating profit
              RMB 501 m                30%               6,124
                                                    Xtep branded stores
              Profit attributable to ordinary     in Mainland China and
              equity holders                    overseas as at 30 June 2020
              RMB 248 m                47%

 Net cash and cash equivalents
 RMB 2,163 m          31 Dec 2019:
                      RMB 2,132 m

 Interim dividend per Share
                       Payout ratio:
 HK 6.5 cents
                       60.0%

                                                                              2
2020 Interim Results Presentation - Xtep International Holdings Limited (Incorporated in the Cayman Islands with Limited Liability) Stock Code: ...
Financial Review
2020 Interim Results Presentation - Xtep International Holdings Limited (Incorporated in the Cayman Islands with Limited Liability) Stock Code: ...
Consolidated Income Statement

RMB m                                               1H2020           1H2019        YoY change

Revenue                                              3,679            3,357          +9.6%

Gross profit                                         1,489            1,497          -0.5%

Selling & distribution and general &
                                                     1,198             918          +30.5%
administration expenses (“SG&A”)

Operating profit                                      501              717          -30.2%

Profit attributable to ordinary equity holders        248              463          -46.5%

Basic earnings per Share                         RMB 10.1 cents   RMB 20.2 cents    -50.0%

Gross profit margin                                  40.5%            44.6%        -4.1% pts

SG&A to revenue ratio                                32.6%            27.3%        +5.3% pts

Operating profit margin                              13.6%            21.4%        -7.8% pts

Net profit margin                                    6.7%             13.8%        -7.1% pts

                                                                                                4
2020 Interim Results Presentation - Xtep International Holdings Limited (Incorporated in the Cayman Islands with Limited Liability) Stock Code: ...
Revenue by Brand Nature (RMB m)
                                                                                                YoY change
                                                                                  3,679           +9.6%
                                                             3,357

      2,535                            2,729
                       2,311
                                                                                  87.0%              -4.6%

                                                                               40.4%
                                                          33.0%
                                                              35.3%                                  N/A
                                                                                   12.5%    0.5%     N/A
     1H2016            1H2017          1H2018               1H2019               1H2020

                         Mass market   Athleisure        Professional sports

 RMB m                                          1H2020                1H2019               YoY change
 Mass market                                    3,201                  3,357                 -4.6%

 Athleisure                                      459                     -                    N/A

 Professional sports                                19                   -                    N/A

 Overall                                        3,679                  3,357                 +9.6%

                                                                                                             5
2020 Interim Results Presentation - Xtep International Holdings Limited (Incorporated in the Cayman Islands with Limited Liability) Stock Code: ...
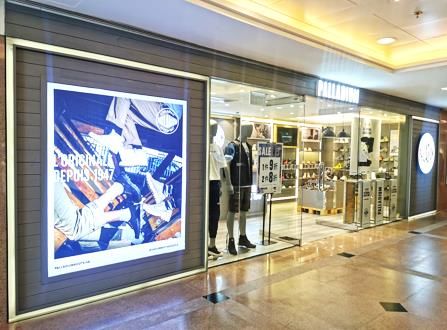
Income Statement – Core Xtep Brand

   RMB m                                            1H2020   1H2019   YoY change

   Revenue                                          3,201    3,357      -4.6%

   Gross profit                                     1,296    1,497     -13.4%

   Selling & distribution and general &
                                                     937      918       +2.0%
   administration expenses (“SG&A”)1

   Operating profit                                  552      717      -23.0%

   Profit attributable to ordinary equity holders    311      463      -32.9%

   Gross profit margin                              40.5%    44.6%    -4.1% pts

   SG&A to revenue ratio                            29.3%    27.3%    +2.0% pts

   Operating profit margin                          17.3%    21.4%    -4.1% pts

   Net profit margin                                 9.7%    13.8%    -4.1% pts

1 SG&A   included corporate expenses                                               6
2020 Interim Results Presentation - Xtep International Holdings Limited (Incorporated in the Cayman Islands with Limited Liability) Stock Code: ...
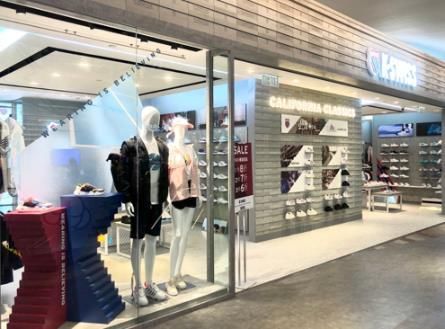
Revenue by Product – Core Xtep Brand (RMB m)
                                                                                           YoY change
                                                           3,357
                                                                              3,201          -4.6%
                                      2,729
      2,535
                      2,311                                57.0%              56.1%           -6.2%

                                      64.9%
      68.6%           66.4%

                                                          40.4%               41.3%          -2.5%
      29.0%           31.4%           33.0%
               2.4%            2.2%            2.1%                   2.6%              2.6% -5.3%
     1H2016           1H2017          1H2018              1H2019              1H2020

                           Footwear    Apparel          Accessories

 RMB m                                         1H2020              1H2019              YoY change
 Footwear                                      1,794                  1,912              -6.2%
 Apparel                                       1,323                  1,356              -2.5%
 Accessories                                     84                    89                -5.3%
 Overall                                       3,201                  3,357              -4.6%

                                                                                                        7
2020 Interim Results Presentation - Xtep International Holdings Limited (Incorporated in the Cayman Islands with Limited Liability) Stock Code: ...
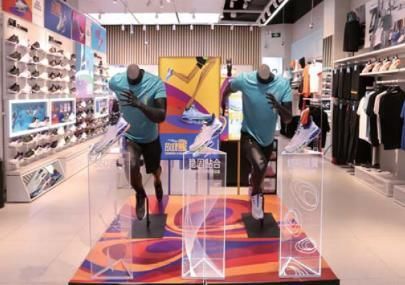
Gross Profit Analysis – Core Xtep Brand

           Gross profit (RMB m)                        Gross profit margin by product (%)

  43.3%   43.9%   43.7%   44.6%
                                  40.5%                                                  YoY
                                                                1H2020     1H2019
                                                                                       change

                                          YoY    Footwear        40.1%      44.8%     -4.7% pts
                          1,497         change
                                  1,296 -13.4%
                  1,193
  1,099                                          Apparel         41.5%      44.7%     -3.2% pts
          1,016

                                                 Accessories     33.5%      37.9%     -4.4% pts

                                                 Overall         40.5%      44.6%     -4.1% pts

 1H2016 1H2017 1H2018 1H2019 1H2020

             Gross profit
             As a % to revenue
                                                                                                  8
2020 Interim Results Presentation - Xtep International Holdings Limited (Incorporated in the Cayman Islands with Limited Liability) Stock Code: ...
SG&A Analysis – Core Xtep Brand1 (RMB m)

                                                                              29.3%
                        27.3%             27.3%                 27.3%
    22.2%
                                                                                      % to        YoY
                                                                                      revenue   change
                                                                        % to    937             +2.0%
                                                                 918
                                                                        revenue

                                                % to
                                            744 revenue                        342 10.7%        -23.8%
                              % to                                                                       Advertising and promotions
                                                                 449 13.4%
          % to            632 revenue
      563 revenue                                                                                        Research and development
                                             336 12.3%                         100 3.1%         +22.0%
                                                                                                         Staff costs 2
                          282 12.2%
      235 9.3%                                                    82 2.4%      159 5.0%         -1.2%    Others
                                              70 2.6%
       58 2.3%             64 2.8%                               161 4.8%                                  As a % to revenue
                                              95 3.5%
       70 2.8%             75 3.2%
                                                                               336 10.5%        +48.7%
                          211 9.1%           243 8.9%            226 6.7%
      200 7.9%

    1H2016              1H2017            1H2018                1H2019        1H2020

1 SG&A   included corporate expenses
2 Excluding  the staff costs related to manufacturing and R&D                                                                         9
2020 Interim Results Presentation - Xtep International Holdings Limited (Incorporated in the Cayman Islands with Limited Liability) Stock Code: ...
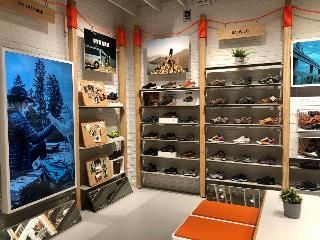
Operating Profit – Core Xtep Brand (RMB m)

     23.0%                 21.7%
                20.7%                         21.4%
                                                       17.3%

                                               717

      583                                                       YoY change
                            592
                                                        552      -23.0%
                 479

     1H2016     1H2017     1H2018             1H2019   1H2020

                          Operating profit
                          As a % to revenue

                                                                             10
Income Tax and Net Profit
                                                                                       Profit attributable to ordinary
            Income tax breakdown (RMB m)
                                                                                          equity holders (RMB m)

                                                                              15.0%       13.4%       13.7%     13.8%
    RMB m                         1H2020             1H2019
                                                                                                                          6.7%
    Tax provision
                                     166               165
    for the year                                                                                                 463
    (Over) / under
                                                                               380                        375
    provision in                     (4)                 5                                                                       YoY
    prior years                                                                            310                                 change
                                                                                                                           248 -46.5%
    Deferred tax                      4                 48

    Total income tax (A)             166               218

    Profit before tax (B)            418               681
                                                                             1H2016      1H2017      1H2018     1H2019   1H2020
    Effective tax rate
                                   39.6%              32.0%                          Profit attributable to ordinary equity holders
    = (A) / (B)
                                                                                     As a % to revenue

Remark: Tax-related government subsidies in 1H2019 and 1H2020 were RMB 88 m and RMB 139 m, respectively                                 11
Dividend Payout Ratio

                                                60.0%
                                       59.3%

                        54.5%
  52.4%   52.4%                                          2020 interim dividend
                                                         per Share

                                                         HK 6.5 cents

                                                         (1H2019: HK 12.5 cents)

 1H2016   1H2017        1H2018         1H2019   1H2020

                   Interim dividend payout

                                                                                   12
Working Capital Analysis

          Working capital turnover (Day)           Working capital balance breakdown (RMB m)

    134                                     142                   30 Jun    31 Dec
                                            137   RMB m                                Change
                                                                   2020      2019
    113                 107
               105                 96
                         90                       Inventories     1,208      1,046     +15.5%
    104        98                    88     94

               80       81         77             Trade
                                                                  2,903      2,596     +11.8%
                                                  receivables

                                                  Trade
                                                                  1,974      1,420     +39.0%
                                                  payables

  1H2018 FY2018 1H2019 FY2019 1H2020
  (30 Jun) (31 Dec) (30 Jun) (31 Dec) (30 Jun)
                                                    Retail channel inventory turnover in
               Inventory turnover                   1H2020
               Trade receivables turnover
               Trade payables turnover              5.0 – 5.5 months

                                                                                                13
Trade Receivables Analysis

                                                            Write-back of provision /
         Trade receivables turnover (Day)
                                                    (Provision) of trade receivables (RMB m)

                                                                        60.9
                                                             56.4
                                             137

   113
               105      107                        22.8
                                   96                                              18.5

                                                                                             (43.9)

  1H2018     2018   1H2019     2019   1H2020       1H2018 2H2018 1H2019 2H2019 1H2020
  (30 Jun) (31 Dec) (30 Jun) (31 Dec) (30 Jun)     (30 Jun) (31 Dec) (30 Jun) (31 Dec) (30 Jun)

                Trade receivables turnover             Write-back of provision of trade receivables
                                                       (Provision) of trade receivables

                                                                                                      14
Balance Sheet
     RMB m                                                                     30 Jun 2020   31 Dec 2019   Change

     Current assets                                                              9,311         9,266        +0.5%

     Current liabilities                                                         3,811         3,671        +3.8%

     Cash and cash equivalents (A)                                               3,051         2,970        +2.8%

     Structured bank deposits, pledged bank
                                                                                 1,454         1,517        -4.2%
     deposits and term deposits (B)

     Bank borrowings (C)                                                         2,342         2,355        -0.5%

     Net cash and cash equivalents = (A)+(B)-(C)                                 2,163         2,132        +1.5%

     Net current assets                                                          5,500         5,595        -1.7%

     Current asset ratio (times)                                                  2.4x          2.5x        -0.1x

     Gearing ratio1 (%)                                                          18.1%         19.1%       -1.0% pt

     Shareholders’ equity                                                        6,998         6,891        +1.6%

     Net assets value per Share                                                 RMB 2.81      RMB 2.77      +1.4%

1 Defined as   the total bank borrowings divided by the Group’s total assets                                          15
Cash Flow Analysis (RMB m)

  Cash and        Net         Bank      Dividends     Structured       Other      Cash and
    cash       operating   borrowings      paid     bank deposits,   movements      cash
 equivalents     cash                               pledged bank                 equivalents
 (31 Dec 19)    inflow                               deposits and                (30 Jun 20)
                                                    term deposits

                                                                                               16
Financial Highlights – Athleisure
   Business operations of K-Swiss and Palladium were hit by the suspension of business in the America
   and Europe due to the coronavirus pandemic since mid-March

For the period 1 Jan 2020 - 30 Jun 2020               Revenue contribution to the Group:

                                                      12.5% in 1H2020
RMB m                           30 Jun 2020               Revenue by                Revenue by
                                                         business model              product
Revenue                             459                                                    4%
                                                                     16%

Gross profit                        186

Gross profit margin                40.5%                84%

                                                                                            96%

Operating loss                      (48)                      Retail                       Footwear
                                                              Wholesale and                Apparel and
                                                              others                       accessories

                                                                                                         17
Business Review
Core Xtep Brand – Retail Network as at 30 June 2020

                                                                   Xtep Run Club
                     6,124         255
                    Xtep branded stores                     9 Run Clubs in Mainland China
                     in Mainland China
                        and overseas                        750,000+ runners’ club members

                               Lanzhou,
                               Gansu Province,
                               Mainland
                               China
                               (166 m2)

  Shenyang, Liaoning Province, Mainland China
  (170 m2)
                                                 Quanzhou Straits Sports Center, Mainland China (620 m2)

                                                                                                           19
Core Xtep Brand – Performance Sports Products

      Award-winning professional
                                              New signature running collection -Ultra Fast
       running shoes – RC160X
                                                        launched in June 2020
                                                              Ultra Fast160X
            First carbon fiber professional                   Professional running
            running shoes launched in                         • Full-length arc-shaped
            December 2019                                       carbon fiber plate
                                                              • Dynamic Foam PB midsole
            2020 Editors’ Choice & Best Buy                   • Flyknit upper
            Awards in Mainland China from                     Ultra FastX
            Runner’s World magazine                           Running and cross training
                                                              • Full-length arc-shaped
                                                                TPU plate
                                                              • A double-layer midsole of
                                                                X-Dynamic Foam and
                                                                Dynamic Foam Lite

                                                              Ultra Fast
                                                              Running and cross training
                                                              • Full-length TPU plate
                                                              • Dynamic Foam Lite midsole

                                                                                             20
Core Xtep Brand – Lifestyle Products

                                               Biodegradable Xtep-eco windbreaker
     Collaboration with Shaolin Temple at            launched in June 2020
          Mount Song in June 2020
    First sportswear brand to cooperate with
    Shaolin Temple to preserve and promote
        China’s intangible cultural heritage

                                                Polylactic acid woven fabric extracted
                                                from corn and straw
                                                The polylactic acid in the cloth is
                                                completely biodegradable when
                                                buried in soil within one year

                                                                                         21
Core Xtep Brand – Advertising & Promotion
Marathons and Sponsorships

              6
 physical and virtual marathons
    and races sponsored in        Xiamen Marathon (January 2020)
   Mainland China in 1H2020
                                                         Electronic
                                                         certificate of
                                                         Jiangsu Virtual
                                                         Cloud Run
                                                         (June 2020)

        ~700,000                                                           Live streaming at Chengdu
                                                                                     Virtual Marathon
  participants joined marathon
                                                                                           (June 2020)
          or virtual races

                                                                                                         22
Core Xtep Brand – Advertising & Promotion
Spokespersons and Entertainment

                           Our Spokespersons                Entertainment sponsorship

                                                              Official designated
                                                              footwear and apparel
                                                              sponsor of “Me to Us”,
                                                              featuring Nicholas Tse as
                                                              mentor in the program
                                   NEXT (Contract expired
               Jing Tian           in June 2020)

Jeremy Lin     Jiro Wang           Nicholas Tse

                                                                                          23
Saucony – Business Update
Retail network update

    12 stores in tier I and II                                  Product innovation
    cities in Mainland China as
    at 30 June 2020

                                   Dalian, Liaoning province,
                                    Mainland China (80 m2)                   Saucony’s fastest
                                                                             shoe - Endorphin
                                                                             Pro, launched in
                                                                             May 2020

 Grand opening at Super Brand Mall, Shanghai,
 Mainland China (115 m2)
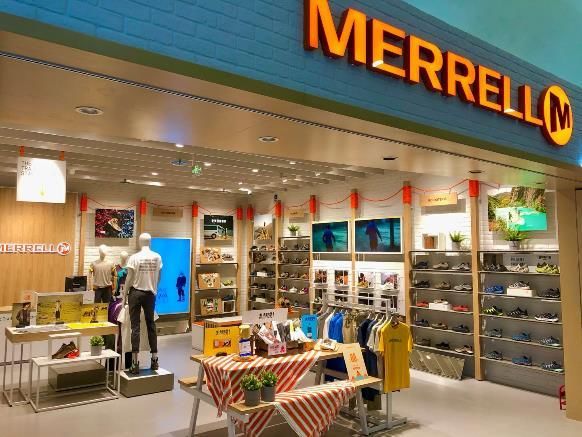
                                                                                                 24
Merrell – Business Update
Retail network update

    Store openings in April and July 2020 in Beijing,
                                                                Product innovation
    Mainland China

                                                        Signature hiking boot
New Yansha Mall, Beijing,
                                                        MOAB (“Mother of all boots”)
Mainland China (77 m2)
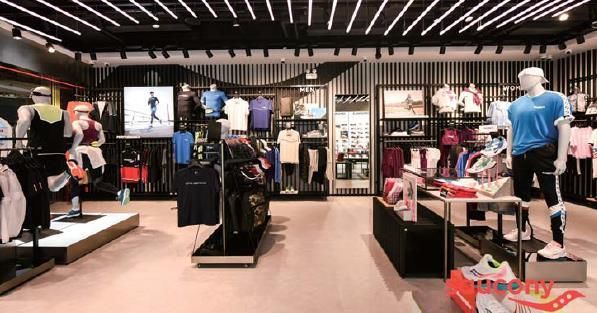
                                                                                       25
K-Swiss – Business Update
Retail network update

    42 self-operated stores in Asia-Pacific as at 30 June 2020
    Wholesale distribution network covered North America, Europe and Asia-Pacific

                                                                          Product collections

                                    K11 Art Mall, Hong Kong
                                    opened in July 2020
                                    (99 m2)

                                                                 K-Swiss x
 Rebranding process in the pipeline                              Breaking Bad
                                                                 Crossover
     Target to debut its brand new
     standalone store in tier I cities
     in Mainland China upon                                                 Boyz N
     completion of the rebranding                                        the Hood
                                                                         Crossover
     process
                                                                                                26
Palladium – Business Update
Retail network update

    34 self-operated stores in Asia-Pacific and Europe as at 30 June 2020
    Wholesale distribution network covered Mainland China, Asia-Pacific, Europe, Middle East, Africa
    and North America

               Product collections                                      Store opening

                                           Recycled
Organic collection
                                           collection

                                                        Harbour City, Hong Kong
                                                        opened in June 2020
                                                        (50 m2)
                                     Pampa X Tech
                                     Crossover
                                                                                                       27
Business Outlook and Development
Market outlook

    Gradual improvement of the Group’s business in second half of 2020 and in 2021

    Optimistic in long term development of sportswear industry in Mainland China, supported by
    favourable government policies and increasing health awareness of Chinese people especially in
    the aftermath of the COVID-19 pandemic

    Expect intensified consolidation in sportswear market in Mainland China

   o Continue to be the stable growth driver of the Group

   o Invest in R&D to develop more innovative and sustainable
     products
   o Uplift store image and optimise retail network to increase store productivity

   o Increasingly promote omnichannel retailing following the shifting of consumer behaviour

                                                                                                     29
Business Outlook and Development

  o Enticing prospect for professional and premium sportswear products
  o Target to open 30 to 50 stores in higher tier cities in Mainland China in
    2020
  o Increase the proportion of apparel and localised products to tap into the
    growing number of elite athletes and affluent upper-middle class
    consumers

                      o Business recovery of the Americas and Europe will take time
                      o Shift business focus to the Asia-Pacific region particularly Mainland China
                      o Store openings in both self-operated and distribution models
                      o Enhance product innovations and increase apparel product offerings
                      o K-Swiss’ rebranding process is on track

                                                                                                      30
Appendix
Production Capacity Allocation

            Footwear                   Apparel

                                             10%

                         37%
   63%

                                 90%

            In-house                   In-house
            Outsourced                 Outsourced

                                                    32
Shareholding Structure as at 30 June 2020

                                 Employee Share
                                 Award Scheme

                                        2%

        Public                                                 Mr. Ding Shui Po and
                       44%                                 54% his family members’
        Shareholders
                                                               family trusts

                Total no. of issued shares as at 30 June 2020: 2,519,440,501

                                                                                      33
Disclaimer

This presentation is prepared by Xtep International Holdings Limited (the “Company”) and is solely for the purpose of corporate
communication and general reference only. The presentation is not intended as an offer to sell, or to solicit an offer to buy or form
any basis of investment decision for any class of securities of the Company in any jurisdiction. All such information should not be
used or relied on without professional advice. The presentation is a brief summary in nature and do not purport to be a complete
description of Company, its business, its current or historical operating results or its future prospects.
This presentation is provided without any warranty or representation of any kind, either expressed or implied.
The Company specifically disclaims all responsibilities in respect of any use or reliance of any information, whether financial or
otherwise, contained in this presentation.
This presentation contains certain forward-looking statements with respect to the financial condition, results of operations and
business of the Company. These forward-looking statements represent the Company’s expectations or beliefs concerning future
events and involve known and unknown risks and uncertainty that could cause actual results, performance or events to differ
materially from those expressed or implied in such statements. Certain statements, such as those that include the words “potential”,
“estimated”, “expect”, “anticipates”, “objective”, “intends”, “plans”, “believes”, “estimates”, and similar expressions or variations
on such expressions may be considered “forward-looking statements”.
Forward-looking statements involve inherent risks and uncertainties. Readers should be cautioned that a number of factors could
cause actual results to differ in some instances materially, from those anticipated or implied in any forward-looking statement.
Forward-looking statements speak only as of the date they are made, and it should not be assumed that they have been reviewed
or updated in the light of new information or future events. Trends and factors that are expected to affect the Company’s results of
operations are described in the “Financial Analysis”, “Business Review” and “Future Plans”.

                                                                                                                                        34
You can also read