DISCUSSION PAPER SERIES - Young and Hungry? Employment Levels for Young People During Spring 2021
←
→
Page content transcription
If your browser does not render page correctly, please read the page content below
DISCUSSION PAPER SERIES

IZA DP No. 14508

Young and Hungry? Employment Levels
for Young People During Spring 2021

John V. Winters

JUNE 2021
DISCUSSION PAPER SERIES

IZA DP No. 14508

Young and Hungry? Employment Levels
for Young People During Spring 2021

John V. Winters
Iowa State University, CARD, PSMME and IZA

JUNE 2021

Any opinions expressed in this paper are those of the author(s) and not those of IZA. Research published in this series may
include views on policy, but IZA takes no institutional policy positions. The IZA research network is committed to the IZA
Guiding Principles of Research Integrity.
The IZA Institute of Labor Economics is an independent economic research institute that conducts research in labor economics
and offers evidence-based policy advice on labor market issues. Supported by the Deutsche Post Foundation, IZA runs the
world’s largest network of economists, whose research aims to provide answers to the global labor market challenges of our
time. Our key objective is to build bridges between academic research, policymakers and society.
IZA Discussion Papers often represent preliminary work and are circulated to encourage discussion. Citation of such a paper
should account for its provisional character. A revised version may be available directly from the author.

                                           IZA – Institute of Labor Economics
Schaumburg-Lippe-Straße 5–9                      Phone: +49-228-3894-0
53113 Bonn, Germany                             Email: publications@iza.org                                    www.iza.org
IZA DP No. 14508 JUNE 2021
ABSTRACT
Young and Hungry? Employment Levels
for Young People During Spring 2021*
This article examines employment rates for persons in their teens and early 20s during
April and May 2021 compared to April and May 2019. Employment rates for teens are
significantly higher in Spring 2021 than in Spring 2019. However, individuals ages 20-24
experienced significantly lower employment rates in Spring 2021 than in Spring 2019.
Differing employment patterns for these two age groups are unlikely to reflect childcare
issues or lingering COVID-19 concerns. Restaurant employment rates suggest that weak
labor demand is likely not the predominant factor. One plausible explanation is that
teenagers are less influenced by generous unemployment insurance benefits.
JEL Classification: J2
Keywords: employment, labor supply, COVID-19, pandemic, young
people, unemployment insurance
Corresponding author:
John V. Winters
Iowa State University
Department of Economics
460B Heady Hall
518 Farm House Lane
Ames, Iowa 50011-1054
USA
E-mail: winters1@iastate.edu
* The author received no funding related to this work and has no conflict of interest to declare. The primary
data analyzed in this study are publicly available. The author will share code and processed data with interested
researchers.1. Introduction COVID-19 dramatically disrupted labor markets, and employment levels had yet to fully recover by May 2021 (BLS 2021). The incomplete employment recovery in the United States through May 2021 has been attributed to a combination of factors related to labor demand, labor supply, and labor market frictions. Labor demand stories posit that some employers are still reluctant to hire workers because of weak or uncertain demand for their products. Labor supply stories suggest that some workers are reluctant or unable to return to the labor force because of lingering concerns about the virus, poor access to childcare, and generous unemployment benefits that reduce incentives for paid employment. Expanded federal pandemic unemployment insurance benefits made it such that many individuals could receive higher incomes from not working than from working (Ganong et al. 2020; Petrosky-Nadeau and Valletta 2021). Fueled by concerns about discouraging work, 25 states announced that they were ending expanded federal pandemic unemployment insurance benefits beginning in June 2021 (Picchi 2021). Discussions about labor market frictions suggest that employment recoveries after recessions are typically slow and gradual because it takes time for workers and firms to find good matches (Hall and Kudlyak 2021). One group that has experienced recent success in the labor market is teenagers. In May 2021, the seasonally adjusted employment-population ratio for ages 16-19 reached a 13-year high (Thomas 2021). This may partially reflect strong labor demand in the restaurant industry and other sectors that traditionally employ teens. It may also reflect increased opportunities for teenagers due to reduced labor supply among older adults. Finally, teenagers are likely less influenced by lingering concerns about the virus, poor access to childcare, and generous unemployment insurance benefits. This article examines employment rates for persons in their teens and early 20s during April and May 2021 compared to April and May 2019. Employment rates for teens are significantly higher in April-May 2021 than in 2019. However, individuals ages 20-24 experienced significantly lower employment rates in April-May 2021 than in 2019. This pattern also holds for restaurant employment. I document and examine these important facts. 2. Empirical Analysis Table 1 presents employment rates by age for April-May 2019 and April-May 2021.1 An individual is defined as employed if they worked at all for pay or profit during the survey week or worked at least 15 hours unpaid for a family business. Panel A reports estimates for age ranges 15-19 and 20-24. Panel B reports separate estimates by single age. The first two columns report rates for 2019 and 2021, while the third reports the simple difference between the two years. The fourth column reports regression adjusted differences for the two years using multivariate linear regression to control for individual characteristics, and the fifth column reports regression standard errors. 1 Active-duty military personnel are excluded from the sample. The data are extracted from IPUMS (Flood et al. 2021). I pool April and May to increase sample sizes and estimate precision. I compare 2021 to 2019 because 2019 is the most recent year before the pandemic.
Table 1: April-May Employment Rates by Year and Age
                                           2019-2021                                  Regression        Regression
                        2019   2021          Simple                                    Adjusted         Adj. Diff.
                                           Difference                                 Difference         St. Error
    A. Five-Year Age Groups
    Ages 15-19          23.27  25.43          2.16                                        2.03            (0.53)**
    Ages 20-24          65.57  59.63          -5.94                                       -6.17           (0.68)**
    B. Single-Year Age Groups
    Age 15               4.45   5.69          1.24                                        0.91              (0.59)
    Age 16              13.33  16.68          3.35                                        3.33            (1.03)**
    Age 17              21.62  26.36          4.74                                        3.11             (1.27)*
    Age 18              33.17  34.98          1.81                                        4.23            (1.44)**
    Age 19              46.23  45.82          -0.41                                       -1.86             (1.61)
    Age 20              55.50  50.62          -4.88                                       -5.25           (1.67)**
    Age 21              59.52  53.04          -6.48                                       -6.89           (1.63)**
    Age 22              66.67  59.52          -7.15                                       -7.48           (1.65)**
    Age 23              70.80  65.95          -4.85                                       -6.42           (1.55)**
    Age 24              74.45  69.75          -4.70                                       -6.23           (1.47)**
    Notes: Employment rates are computed via the combined April and May Current Population Survey. Estimates
    in the two far right columns use multivariate linear regression analysis to control for individual characteristics
    via indicator variables for sex, race, ethnicity, citizenship status, education level, marital status, number of
    children in the household, survey month, and local area; Panel A regressions also include indicator variable
    controls for age. The regression dependent variable is coded as zero or 100 to facilitate comparison with
    employment rates. Standard errors are heteroskedasticity robust.
    * Statistically significant at five percent level; ** Significant at one percent level.

Panel A of Table 1 indicates that the employment rate for ages 15-19 increased from 23.27% in
April-May 2019 to 25.43% in April-May 2021. However, the employment rate for ages 20-24
decreased from 65.57% to 59.63% during the same time period. Thus, these two groups of
young people had very different labor market experiences with a 2.2 percentage point increase
for teens and a 5.9 percentage point decrease for the early 20s. The fourth column indicates that
employment change estimates are only slightly affected by regression controls, and the fifth
column indicates that the employment increase for teens and the employment decrease for ages
20-24 are both statistically significant.2 Panel B indicates that the positive employment effect for
teens is concentrated among ages 16-18. The negative effect is widespread among ages 20-24.

Table 2 provides a simple test of whether Table 1 results are driven by parental childcare issues.
Specifically, the analysis is the same as Table 1 except the Table 2 sample excludes parents with
one or more own children in their household. Table 2 results are very similar to Table 1.
Childcare is likely an important issue for many potential workers in both 2019 and 2021.
However, childcare does not explain differing employment changes for persons in their teens vs.
early 20s in Table 1.

2
  Appendix Table A1 reports additional results for regression-adjusted employment changes for April-May 2021
relative to April-May 2016-2019. Estimates are similar indicating that the results are not driven by 2019 anomalies.
Table 2: April-May Employment Rates by Year and Age for Non-Parents
2019-2021 Regression Regression
2019 2021 Simple Adjusted Adj. Diff.
Difference Difference St. Error
A. Five-Year Age Groups
Ages 15-19 23.13 25.40 2.27 2.15 (0.54)**
Ages 20-24 65.87 59.82 -6.05 -6.11 (0.71)**
B. Single-Year Age Groups
Age 15 4.35 5.68 1.33 0.97 (0.59)
Age 16 13.29 16.65 3.36 3.25 (1.03)**
Age 17 21.59 26.33 4.74 3.19 (1.27)*
Age 18 33.31 34.99 1.68 4.17 (1.45)**
Age 19 46.19 46.24 0.05 -1.37 (1.63)
Age 20 55.72 50.31 -5.41 -5.68 (1.71)**
Age 21 59.24 53.49 -5.75 -6.12 (1.70)**
Age 22 66.12 59.92 -6.20 -6.08 (1.74)**
Age 23 72.79 66.25 -6.54 -7.95 (1.65)**
Age 24 76.38 71.41 -4.97 -6.33 (1.58)**
Notes: The analysis is the same as Table 1 except the sample excludes parents with one or more own
children in their household.
* Statistically significant at five percent level; ** Significant at one percent level.
Table 3 looks at employment in the restaurant industry, which is a major employer of young
people and an industry reported to be experiencing labor shortages during Spring 2021.
Specifically, the outcome is now the percentage of individuals employed in the restaurant
industry among the age-specific civilian population; thus, the sample is the same as Table 1 and
not restricted to just workers. Panel A indicates that the restaurant employment rate for ages 15-
19 increased from 8.45% to 9.28%, while the restaurant employment rate for ages 20-24
decreased from 9.87% to 7.64%.
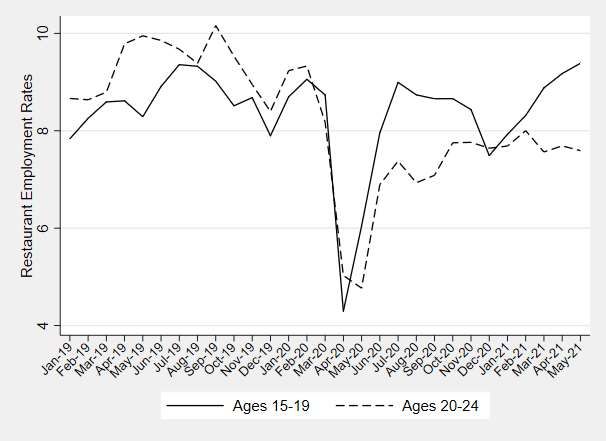
Figure 1 illustrates monthly restaurant employment rates from January 2019 to May 2021 for
ages 15-19 and 20-24 (not adjusted for seasonality nor individual characteristics). Single-month
estimates are somewhat noisy. Restaurant employment rates before the pandemic were typically
higher for ages 20-24. Both groups saw large decreases in April 2020 and some subsequent
recovery. Teen restaurant employment more than fully recovered by May 2021. For ages 20-24,
restaurant employment did not fully recover and instead largely plateaued after October 2020.
From May 2020 to May 2021, teen restaurant employment rates exceeded ages 20-24 rates in
every month but December 2020.
While one cannot be certain, the results for restaurant employment appear to suggest that labor
demand issues are not the predominant factor keeping ages 20-24 out of employment.Table 3: April-May Restaurant Employment Rates by Year and Age
2019-2021 Regression Regression
2019 2021 Simple Adjusted Adj. Diff.
Difference Difference St. Error
A. Five-Year Age Groups
Ages 15-19 8.45 9.28 0.83 0.83 (0.38)*
Ages 20-24 9.87 7.64 -2.23 -2.15 (0.41)**
B. Single-Year Age Groups
Age 15 1.41 1.88 0.47 0.47 (0.36)
Age 16 6.55 7.92 1.37 1.56 (0.79)*
Age 17 10.41 13.07 2.66 2.05 (0.98)*
Age 18 11.82 12.85 1.03 2.13 (1.03)*
Age 19 12.43 10.94 -1.49 -1.78 (1.05)
Age 20 11.87 8.93 -2.94 -2.38 (1.04)*
Age 21 10.65 7.81 -2.84 -3.26 (0.99)**
Age 22 9.76 7.94 -1.82 -1.61 (0.94)
Age 23 7.92 6.79 -1.13 -1.59 (0.89)
Age 24 9.27 6.67 -2.60 -2.03 (0.90)*
Notes: The analysis is the same as Table 1 except the outcome is restaurant employment; the restaurant
employment rates is computed as the percentage of the age-specific civilian population employed in
restaurants.
* Statistically significant at five percent level; ** Significant at one percent level.
Figure 1: Restaurant Employment Rates by Month and Age Group3. Discussion Teen employment rates in April-May 2021 were significantly higher than in April-May 2019, but employment rates for ages 20-24 were significantly lower in Spring 2021 than Spring 2019. The difference is not due to childcare issues. Restaurant employment rates suggest that weak labor demand is likely not the predominant factor. It also seems unlikely that virus concerns would be sufficiently different among the two age groups to explain the large differences in employment trends. Thus, one wonders why employment rates for ages 20-24 are so much lower in Spring 2021 than in Spring 2019, while teen employment rates increased. One plausible explanation is that ages 20-24 are more influenced by generous unemployment insurance benefits. Teenagers are less likely to have sufficient work history to qualify for unemployment benefits. However, ages 20-24 are more likely to qualify for unemployment benefits including expanded federal pandemic unemployment insurance benefits. The potential benefits are especially lucrative for previous low-wage workers who could receive more pay from not working than from working. Reduced benefits in many states beginning in June 2021 are expected to increase the employment rate for ages 20-24. However, employment rates are unlikely to immediately recover even after expanded unemployment insurance benefits expire. It takes time for workers and firms to find good matches. Some individuals have been out of work for more than a year and may have trouble transitioning back to the labor market. Their skills may be rusty and expectations may have to adjust. It will also be interesting for future research to track the employment recovery across states with and without expanded unemployment benefits.
References

Bureau of Labor Statistics, 2021. The Employment Situation – May 2021. US Department of
Labor News Release, https://www.bls.gov/news.release/archives/empsit_06042021.pdf
Accessed June , 2021.

Flood, S., King, M., Rodgers, R., Ruggles, S., and Warren, J.R., 2021. Integrated Public Use
Microdata Series, Current Population Survey: Version 8.0 [dataset]. Minneapolis, MN: IPUMS.
https://doi.org/10.18128/D030.V8.0

Ganong, P., Noel, P. and Vavra, J., 2020. US unemployment insurance replacement rates during
the pandemic. Journal of Public Economics, 191, Article No. 104273.

Hall, R.E. and Kudlyak, M., 2021. Why Has the US Economy Recovered So Consistently from
Every Recession in the Past 70 Years? Federal Reserve Bank of San Francisco Working Paper
2020-20. https://doi.org/10.24148/wp2020-20

Petrosky-Nadeau, N. and Valletta, R.G., 2021. UI Generosity and Job Acceptance: Effects of the
2020 CARES Act. Federal Reserve Bank of San Francisco Working Paper 2021-13. Available at
https://doi.org/10.24148/wp2021-13

Picchi, A. 2021. Workers in 25 states brace for early unemployment shutoff.
https://www.cbsnews.com/news/unemployment-benefits-republican-states/
Accessed June 16, 2021.

Thomas, P. 2021. Summer Job Market for Teens Is Sweet. Wall Street Journal,
https://www.wsj.com/articles/summer-job-market-for-teens-is-sweet-11622971800
Accessed June 6, 2021.
Table A1: April-May 2021 Employment Changes Relative to 2016-2019
Outcome:                   Employment                     Restaurant Employment
                    Regression                       Regression                Regression        Regression
                     Adjusted                       Adjusted Diff.              Adjusted        Adjusted Diff.
                    Difference                        St. Error                Difference         St. Error
A. Five-Year Age Groups
Ages 15-19             1.82                             (0.43)**                   1.14             (0.31)**
Ages 20-24             -5.06                            (0.54)**                   -2.24            (0.31)**
B. Single-Year Age Groups
Age 15                  0.96                             (0.50)                    0.25              (0.32)
Age 16                  3.41                            (0.82)**                   2.30             (0.63)**
Age 17                  3.92                            (1.00)**                   2.94             (0.78)**
Age 18                  2.19                             (1.14)                    1.00              (0.81)
Age 19                 -1.38                             (1.23)                    -1.04             (0.79)

Age 20                           -3.93                  (1.26)**                   -2.62            (0.74)**
Age 21                           -6.79                  (1.25)**                   -3.57            (0.73)**
Age 22                           -4.97                  (1.26)**                   -1.86            (0.71)**
Age 23                           -5.19                  (1.21)**                   -2.09            (0.67)**
Age 24                           -4.01                  (1.17)**                   -1.64             (0.66)*
Notes: The analysis is identical to the two far right columns of Tables 1 and 3 except that the sample includes
years 2016-2019 and 2021.
* Statistically significant at five percent level; ** Significant at one percent level.
You can also read