Overview of RES and Infrastructure sectors in Greece

Page created by Stacy Pope
 
CONTINUE READING
Overview of RES and Infrastructure sectors in Greece
Overview of RES and
Infrastructure sectors in
Greece

Reliance Restricted
January 2019
Overview of RES and Infrastructure sectors in Greece
January 2019

1
Macroeconomic Overview

                         Overview of RES and Infrastructure sectors in Greece: | Page 2 of 13
Overview of RES and Infrastructure sectors in Greece
January 2019

   1 Macroeconomic Overview

                                                                         Key indicators suggest that the Greek economy is on the verge of recovery

                                                Current account deficit                                                                                            Nominal GDP Growth & Inflation

           2006      2007     2008    2009    2010      2011    2012      2013    2014    2015     2016   2017     2018                             4%                                                                                   4%
                                                                                                                                                          3.1%
   0                                                                                                                      0%
                                                                                                                                                    3%
                                                                                          -0.2%                           -2%                                                                                                            2%
 -10                                                                              -1.6%           -1.1% -0.8% -0.8%                                 3%
                                                                          -2.0%                                           -4%                                                                                                 2.0%
                                                                                                                                                    2%                                                                                   0%
 -20                                                            -3.8%
                                                                                                                          -6%                       2%                                                                        1.1%
                                                                                                                                                                 1.0%

                                                                                                                                     yoy % change
 -30                                                                                                                      -8%                       1%                                 -1.1%                                             -2%
                                                                                                                                                                                                    -1.3%        -1.2%
                                                                                                                          -10%                      1%                                                            0%                     -4%
 -40
                                                       -10.0%                                                             -12%                      0%
 -50       -11.5%                             -11.4%                                                                                                -1%                                                                                  -6%
                                     -12.3%                                                                               -14%                                           -5.5%
                                                                                                                                                    -1%
 -60                                                                                                                      -16%                                           -0.9%                                                           -8%
                    -15.2% -15.1%                                                                                                                   -2%          -7.6%                              -1.1%
                                                                                                                                                          -8.4                         -1.4%
                               Current account balance                  Current account balance (Percent of GDP)                                    -2%                                                                                  -10%
                                                                                                                                                          2011   2012     2013         2014         2015         2016         2017

                                                     Government Debt                                                                                                     Inflation         Nominal GDP Growth

           370                                                                                                            190%
                                                                                                  183%
           360        181%                                        180%                                        182%        185%   ►          The current account deficit of c.15% in 2008 was reduced significantly mainly
                                                     178%                         179%
           350                                                                                                            180%              due to lower consumer spending as a result of the austerity program.
           340                                                                                                            175%   ►          The austerity program is evident from the significant contraction of the
           330
                                                                                                                          170%              economy, expressed both as a decline of GDP and through deflationary
                      374
   € bn.

           320
                                     160%                                                                                 165%              pressures.
           310
           300                                                                                                            160%
                                                       321         322                                           323             ►          The government debt (expressed as a % of GDP) remains at high levels,
                                                                                   315            320                     155%
           290                        305                                                                                                   however has stabilized in the last 4 years.
           280                                                                                                            150%
           270                                                                                                            145%   ►          All indicators suggest Greece is at a turning point, improving its
                      2011           2012            2013          2014            2015           2016           2017                       macroeconomic indicators (positive government balance, GDP growth, etc.),
                                                                                                                                            despite any hiccups in the short-term, such as elections in 2019.
                            General government gross debt                  General government gross debt, % of GDP

  Source: International Monetary Fund, World Economic Outlook Database, October 2018
                                                                                                                                                                             Overview of RES and Infrastructure sectors in Greece: | Page 3 of 13
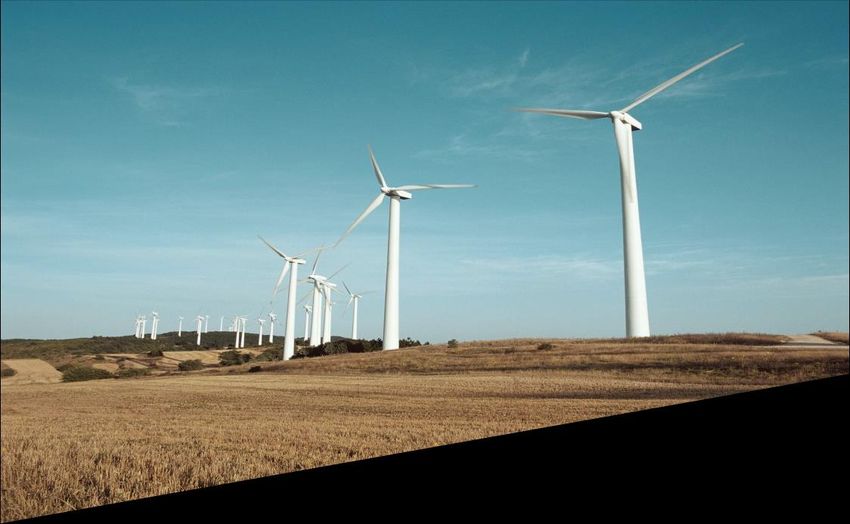
Overview of RES and Infrastructure sectors in Greece
January 2019

        1 Macroeconomic Overview

                                                    FDI vs Unemployment rate                                                                                                                       Economic Sentiment vs. Real GDP growth
Source: BoG, International Monetary Fund, World Economic Outlook Database, October 2018                                                                                   Source: Eurostat, International Monetary Fund, World Economic Outlook Database, October 2018
        40,000                                                                                                           Peak                                30%                   115                                                                                      8%
                                                                     35,378                                                   27.5%
        35,000                                                                                                                                                                     110                                                                                      6%
                                                                                                30,141                                                       25%
                                                            29,119                     28,130
        30,000                                                                27,140                                                                                               105                                                                                      4%
                                                   24,788                                                                                                    20%
        25,000                                                                                           22,486
                                                                                                                                                    23,884                         100                                                                                      2%
                                                                                                                                           22,119
                                   19,605 19,712                                                                  18,951 18,743                                                     95                                                                                      0%
€ bn.

                                                                                                                                                                           index
        20,000 17,286                                                                                                             17,750                     15%

                                                                                                                                                                                                                                                                                   yoy
                          16,287                                                                                                                                                    90                                                                                      -2%
        15,000
                                                                                                                                                             10%                    85                                                                                      -4%
        10,000                                                                                                                                                                      80                                                                                      -6%
                                                                                                                                                             5%
         5,000                                                                                                                                                                      75                                                                                      -8%
               0                                                                                                                                             0%                     70                                                                                      -10%
                   2001 2002 2003 2004 2005 2006 2007 2008 2009 2010 2011 2012 2013 2014 2015 2016                                                                                       2006 2007 2008 2009 2010 2011 2012 2013 2014 2015 2016 2017 2018
                                  Foreign direct investment in Greece   Unemployment rate                                                                                                      Economic Sentiment Indicator (index) Real GDP Growth (yoy% change)

                                               Economic Sentiment Indicator                                                                                               ►        Greece’s economic sentiment index, after maintaining a net pessimistic
                                                                                                                                                                                   position throughout most of 2008-16, returned to a net optimistic position in
                                                                                                                                         Source: Eurostat
        109        108     >100 optimistic                                                                                                                                         December 2017.
Overview of RES and Infrastructure sectors in Greece
January 2019

   1 Macroeconomic Overview

                                                                GDP Growth                                                                                               General Government Debt
                 4.0%                                                                           3.4% 3.7% 3.3%                     Source: International Monetary Fund, World Economic Outlook Database, October 2018
           260                                                                             3.0%                2.9% 2.9%    4%
                                                                                    2.0%                                                       350                                                                                          200%
           240                              -28.0%                                                                                                   188%
                                                                                                                            2%                                                                                                              190%
                                                                                                                                               345                177%
                                                                                              23.3%
           220                                                                                                                                                                    169%                                                      180%
                                                                -1.1% -1.3% -1.2%                                           0%                 340
                        -1.8%                                                                                                                                                                   163%                                        170%
           200                                                                                                                                                                                                  155%
                                                                                                                            -2%                335                                                                             151%         160%
   € bn.

           180

                                                                                                                                       € bn.
                                -4.8%                                                                                                          330                                                                                          150%
                                                        -5.5%                                                               -4%                      344
           160                                                                                                                                 325                                                                                          140%
                                                                                                                            -6%                                    335                                                                      130%
           140                                  -7.6%                                                                                          320                                    332
                                        -8.4%                                                                                                                                                    330                            324         120%
                                                                                                                            -8%                                                                                  324
           120                                                                                                                                 315                                                                                          110%
           100                                                                                                              -10%               310                                                                                          100%
                 2008 2009 2010 2011 2012 2013 2014 2015 2016 2017 2018 2019 2020 2021 2022 2023                                                     2018          2019           2020           2021           2022            2023

                        Gross domestic product, current prices                      Nominal GDP growth rate, yoy % change                             General government gross debt            General government gross debt, % of GDP
Source: International Monetary Fund, World Economic Outlook Database, October 2018
                                                                                                                                   ►    The country’s recovery is projected to strengthen in the near-term, with real
                                                                  Inflation                                                             GDP growth expected to reach 2,4% in 2019. In the medium term, real GDP is
Source: International Monetary Fund, World Economic Outlook Database, October 2018
                                                                                                                                        expected to grow by 1.5% on average.
 2.0%                                                                                                                              ►    Until 2018, Greek GDP is expected to recoup c. 13% of the loss inflicted during
 1.8%                                                                                                                                   the crisis. Nominal GDP is expected to reach €214.8 bn in 2023, recouping a
 1.6%                                                                                                                                   significant portion of the loss inflicted during the crisis (60%).
 1.4%                                                                                                                              ►    Taking into account IMF projections until 2023 and a stable growth in nominal
 1.2%                                                                                                                                   GDP after 2023 equivalent to the 2023 levels, GDP is expected to reach 2008
 1.0%            Oct 2018:                                                                                                              levels in 2027.
                  1.1%
 0.8%                                                                                                                              ►    Inflation in the medium term is expected to be in the region of 1.8%, which is
 0.6%                                                                                                                                   close to the 2% target inflation for the Eurozone.
 0.4%
                                                                                                                                   ►    Unemployment is expected to ease in the medium term, with unemployment
 0.2%                                                                                                                                   rate expected to decline from 19.8% in 2018 to 14.1% in 2023.
 0.0%
                  2018                   2019                   2020                2021              2022           2023          ►    General Government debt as % of GDP is expected to be on a downward trend
                                                                                                                                        until 2023, reaching 151.1%.
                                                                                                                                                                               Overview of RES and Infrastructure sectors in Greece: | Page 5 of 13
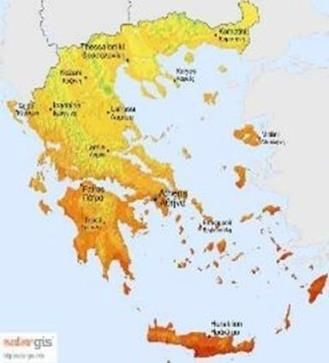
Overview of RES and Infrastructure sectors in Greece
January 2019

2
The Greek RES sector

                       Overview of RES and Infrastructure sectors in Greece: | Page 6 of 13
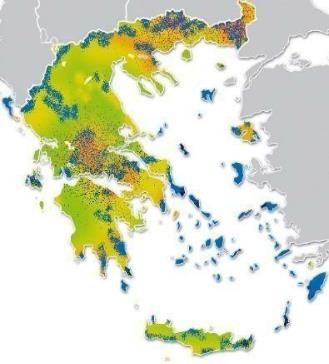
Overview of RES and Infrastructure sectors in Greece
January 2019

    2 The Greek RES sector
    An attractive sector with significant room for growth and excellent resources

►    In terms of RES, Greece offers an excellent wind and solar potential.                                              RES installed capacity (MW)
►    Ambitious and regularly reaffirmed targets for RES development: the Greek
                                                                                      Source: LAGIE, Aug 2018                       Aug-18   2020 target             7500
     electricity TSO forecasts c. 4.7GW of new RES until 2027.
►    The RES sector recently switched from a FiT scheme to a FiP scheme via
     auctions that fosters rationalization of tariffs and market stability.            Includes                  4650
►    2.6GW of new wind and solar tenders to come in the next 3 years (have already     small Hydro
                                                                                       of 234MW           3405
     started in July 2018).                                                            installed                                                              2770
                                                                                       capacity with                       2250 2200
►    RES transactions have resumed in the recent years, following a period of
                                                                                       a 2020 target
     subdued activity.                                                                 of 350MW
                                                                                                                                                   250                                350
►    Financing for RES projects mainly provided by Greek systemic banks and                                                                                                      67
     multilaterals; foreign commercial banks still absent from market.
                                                                                                             Hydro            PV*              CSP               Wind        Biomass / Biogas

                                                                                       * EU targets for solar do not take into account roof solar, thus roof solar capacity is not included in
                                        Natural resources                              PV category

     Large surface                                Solar PVs with
                                                                                      Installed capacity Jun-18: 2017 continued the trend of 2016, which proved to be
      areas with                                    irradiation                       second best year for wind power installations after 2011, with deployment of new
      wind speed                                  between 3.8 –                       121MW capacity unitl Sep 2017.
    between 4m/s -                                5.5KWh/m2/da
        10m/s                                            y                            ►   In 2018, the Greek wind power sector comprised of ten major market players
                                                                                          operating wind parks of c. 2,7GW of installed capacity and a considerable
                                                                                          pipeline of projects.
                                                                                      ►   Greece’s top five wind energy groups are: Τerna Εnergy (536MW), Eltech
                                                                                          Anemos (286 MW), Iberdrola Rokas (251MW), EDF EN (238MW) and Enel
                                                                                          Green Power (201MW).
                                                                                      ►   The solar power sector covered nearly 7% of the country's electricity needs with
                                                                                          a total installed capacity of 2,229MW (2,094MW interconnected system,
                                                                                          135.89MW NIIs), bringing Greece to one of the first places worldwide in terms
    Source: Global Energy Network Institute
                                                                                          of the contribution of PV to total electricity demand.

                                                                    Excellent wind and solar potential

                                                                                                                                 Overview of RES and Infrastructure sectors in Greece: | Page 7 of 13
January 2019

    2 The Greek RES sector
    Recent significant developments in the Greek RES sector

                               Recent policy developments                                                                      Recent market developments
►    Law 4414/2016 introduced Feed-in Premiums (FIPs), which in most cases, replaced the          Financing
     Feed-in-Tariff (FiT).
►    All wind farms (with the exception of wind farms with capacity
January 2019

3
Infrastructure investment
opportunities in Greece

                            Overview of RES and Infrastructure sectors in Greece: | Page 9 of 13
January 2019

   3 Infrastructure investment opportunities in Greece

  1                                   The project consists of the two sections which will run along the northern cost of the island, linking
                                                                                                                                                           Investment
                                       the cities of Chania, Rethymno, Heraklion and Agios Nikolaos.
                                      The two projects are being procured as:                                                                             PPP portion: €1.1bn.
                                              a 30-year availability-based design, construct, finance, operate and maintain PPP contract
                                                                                                                                                           Concession portion:
          Northern Road Axis of                 for the 26km Hersonissos to Neapolis section, which also includes an option for the
                                                                                                                                                           €290mn.
          Crete                                 maintenance and operation of the adjacent 14km Neapolis to Agios Nikolaos section
                                                whose construction is expected to be delivered under a public procurement contract.
                                                a 25-year concession contract for the 140km Chania–Heraklion section.
                                      EoIs have been received from international and local contractors and infra funds, inc. Shikun & Binui
                                       from Israel.

  2                                                                                                                                                        Key figures (2017)
                                      The Greek State’s privatization fund, Hellenic Republic Asset Development Fund (HRADF), is
                                                                                                                                                           Pax: €21.74mn.
                                       contemplating the sale of its 30% stake in Athens International Airport (AIA).
                                      Process is expected to be initiated in Q1 2019.                                                                     Revenues: €454.9mn.
          Athens International
                                      The HRADF accepted in September 2018 a €1.115bn. offer, including VAT, from AIA in exchange for                     EBITDA: €284.5mn.
          Airport
                                       a 20-year extension to the concession agreement until 2046.
                                      AIA's other shareholders include PSP Investments (40% - Canada), Greek state (25%) and
                                       Copelouzos Group (5% - Greece).

  3                                                                                                                                                        Investment
                                      30 year license for the design, construction, operation and financing of an integrated resort casino,
                                                                                                                                                           >€500mn.
                                       consisting of a casino development and accompanied by hospitality, retail, leisure, and MICE
                                       facilities.
          Hellinikon Integrated
                                      A greenfield project forming part of the Hellinikon project, one of the largest RE developments to be
          Resort Casino (IRC)
                                       constructed in Greece.
                                     Interest has been expressed by 5 international strategic investors and 2 funds
                                      RfP expected to be launched in January 2019.

                                                                                                                                Overview of RES and Infrastructure sectors in Greece: | Page 10 of 13
January 2019

   3 Infrastructure investment opportunities in Greece

  4

                                    HRADF’s portfolio of ports includes the ports of Volos, Rafina, Igoumenitsa, Patras, Alexandroupolis, Heraklion, Elefsina, Lavrion, Corfu and
                                     Kavala.
          10 ports
                                    HRADF holds 100% of the shares in the aforementioned port companies, which have the right to operate the respective ports until 2042.
                                    Privatization of the above ports is expected to start in 2019.

  5                                                                                                                                                   Investment
                                    The municipality of Chania in Crete has launched the tender for a school PPP project, comprising the
                                                                                                                                                      Chania Schools PPP project:
                                     design, build, finance, maintenance and operation of eight schools, as well as the redevelopment and
                                                                                                                                                      €41mn.
                                     upgrade of the Peace and Friendship park in Chania, for 27 years.
          Schools PPP project
                                   Interested parties are invited to submit expressions of interest by 20 February 2019.                            Rhodes Schools PPP
          (Chania and Rhodes)
                                    The Rhodes schools PPP project entails the design, build, finance, maintenance and operation of 13               project: €42mn.
                                     schools in Rhodes island, for 27 years.
                                    The pre-qualification tender is expected in early 2019.

  6                                                                                                                                                   Investment
                                                                                                                                                      €44mn.
          Integrated Waste
          Management System         The project entails the design, build, financing, maintenance and operation of the Integrated Waste
                                     Management System of Rhodes Island through a PPP scheme with a duration of 27 years.
          of Rhodes Island
                                    Currently, the awarding authority seeks to appoint advisors.
          through PPP

                                                                                                                           Overview of RES and Infrastructure sectors in Greece: | Page 11 of 13
January 2019

4
Appendix

               Overview of RES and Infrastructure sectors in Greece: | Page 12 of 13
January 2019

   4 Appendix

  ►   In preparing this presentation (“Presentation”), we have used information from public sources or proprietary databases. No responsibility is assumed for
      information furnished by others, and such information is believed to be reliable. EY has relied on such information pursuant to a limited survey and does
      not in any case represent or warrant that such data is adequate, accurate or complete.
  ►   Our work does not intend to provide assurance on the achievability of the projections or on the assumptions underlying such statements. There are
      usually differences between projected and actual results because events and circumstances frequently do not occur as expected and those differences, if
      any, may be material.
  ►   This Presentation should be viewed as a whole document.

                                                                                                                   Overview of RES and Infrastructure sectors in Greece: | Page 13 of 13
You can also read