Using Massive Online Choice Experiments to Measure Changes in Well-being - Erik Brynjolfsson Avi Gannamaneni Felix Eggers
←
→
Page content transcription
If your browser does not render page correctly, please read the page content below
Using Massive Online
Choice Experiments to
Measure Changes in Well-
being
                           Erik Brynjolfsson
                           Avi Gannamaneni
                           Felix Eggers
How Are We Doing?

                    “...a measure for standard of living: average
                    real gross domestic product (GDP) per capita”
                    – Boston Fed

                    “Productivity is the most important determinant
                    of the standard of living” – Forbes

                                                                      2
“The welfare of a nation can scarcely be inferred
from a measurement of national income as defined
[by the GDP.]”
                       - Simon Kuznets, 1934

 GDP is a measure of production, not well-being

                                                    3
IT & GDP

 Explosion of free digital goods   Information goods as a share of GDP
                                                             5.2
                                                             5.1

                                   % OF INFORMATION SECTOR
                                                             5.0

                                     CONTRIBUTION TO GDP
                                                             4.9
                                                             4.8
                                                             4.7
                                                             4.6
                                                             4.5
                                                             4.4
                                                             4.3
                                                             4.2

                                                                   YEAR

                                                                          4
Our Approach
• Estimate Consumer Welfare Directly

• Key techniques: Online Choice Experiments and Lotteries
    1. Single Binary Discrete Choice Experiments
    2. Becker-DeGroot-Marschak Lotteries
    3. Best-Worst Scaling

• Both with and without incentive compatibility

• At Massive scale
                                                   5
Key Findings
1.   Choice experiments generate plausible demand curves
     • Valuations are consistent across BDM lotteries, best-worst scaling and
         SBDC experiments
     • But incentive compatible experiments often imply higher valuations
2.   Median valuations
     Search > email > maps > video > e-commerce > social media > messaging > music
3.   Consumer surplus from Facebook in USA:
     $450/year for median consumer
4.   This approach could be scaled up to numerous goods and services

                                                                6
GDP vs. Consumer Welfare

                     7
ΔProduction vs. ΔConsumer Surplus
Case 1: Classic Goods

E.g. Automobiles, haircuts, food

GDP ↑, Consumer Surplus ↑

                                   8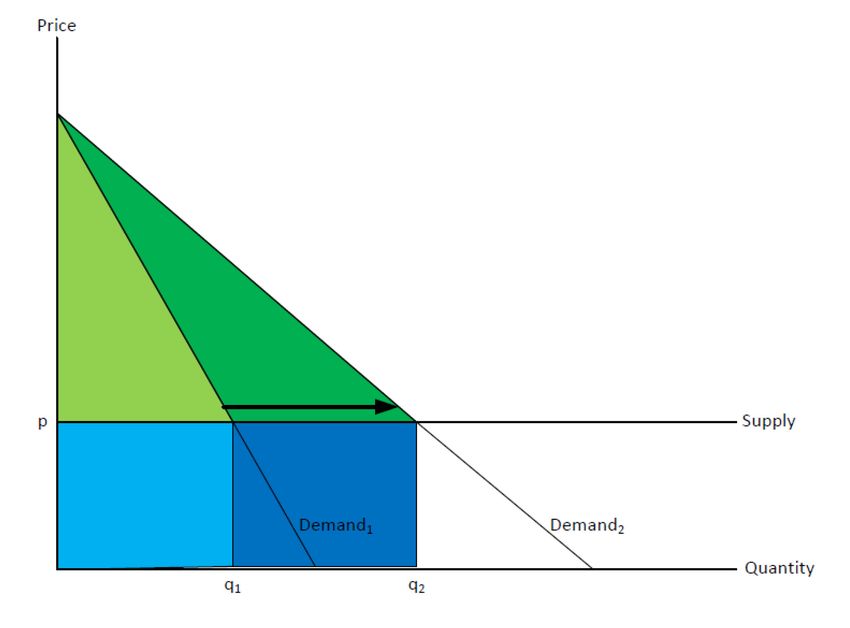
ΔProduction vs. ΔConsumer Surplus

Case 2: Digital Goods

E.g. Increased use of free maps on
smart phones or more digital
photos;
Special case: Free digital apps that
never existed before

GDP no change,
Consumer Surplus ↑

                                       9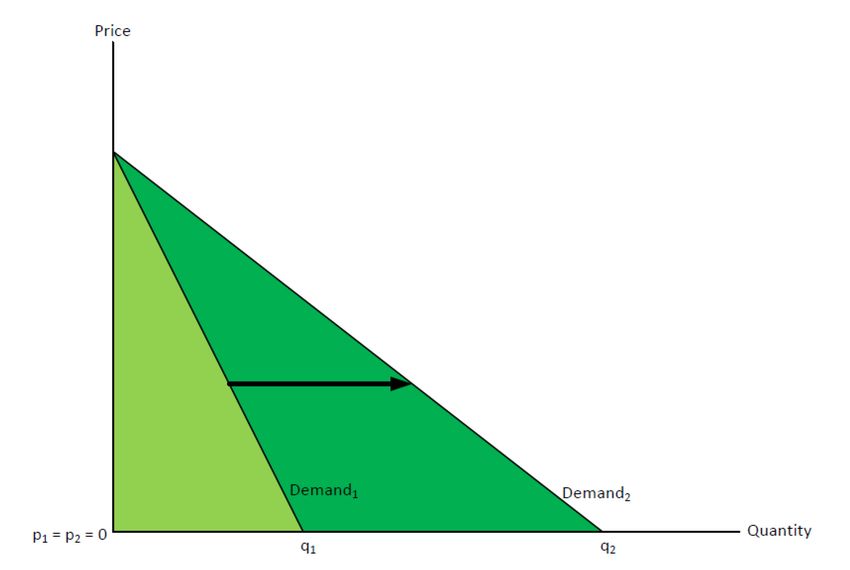
ΔProduction vs. ΔConsumer Surplus

Case 3: Transition Goods

E.g. Encyclopedia
(Wikipedia vs. Britannica)
Chemical photography to digital
photography

GDP ↓, Consumer Surplus ↑

                                    10
Example: Smartphones Smartphones substituted • Camera • Alarm Clock • Music Player • Calculator • Computer • Land Line • Game Machine • Movie Player • Recording Device • Video Camera Plus: • Data plan • GPS Map and directions • Web Browser • E-book reader • Fitness monitor • Instant messaging 11
What about producer surplus?

 • Nordhaus (2005): Innovators able to capture only 3.7% of
   social returns to innovation between 1948-2001
   • If the share of producer surplus contribution to the total social
     surplus remains relatively stable, then consumer surplus would
     have to be scaled up by a small fraction
   • However, measuring simply the consumer surplus might be a
     concern if the producer surplus changes rapidly relative to the
     consumer surplus
      • Higher profit share recently?

                                                                         12
What about advertising revenue?
1. Advertising is an intermediate good, not included in
GDP.
• Nakamura, Samuels and Soloveichik (2017) show how to account for
advertising within GDP framework, find 0.07% increase in GDP/year
2. Advertising revenues are generally not proportional to
consumer surplus and may reflect only a small share of
it. (Spence and Owen 1977)
13Approach & Results
14Discrete Choice Experiments
• Common in marketing, transportation, price-setting,
damages calculations, etc.
• Widely used in industry for new product introductions and pricings
• Accepted as evidence in legal cases
• BP oil spill (Carson, List et al, Science 2017)
• Samsung vs. Apple (Hauser vs McFadden), etc.
• Three variants
1. Single Binary Discrete Choice Experiments
2. Best-worst scaling
3. Becker-DeGroot-Marschak (BDM) lotteries
• Each can be done with or without incentive compatibility
15Our Platforms for Choice Experiments
1. Lab in a University
• Includes incentive compatible studies (where we enforce choices)
• N = 500
2. Professional Survey Panel (Peanut Labs)
• 3 million active verified panelists, user quotas selected to represent
internet users in US, good for longer surveys (BWS)
• N = 5000
3. Google Consumer Surveys
• Market research platform, good for short surveys (SBDC)
• N = 200,000
16Single Binary Discrete Choice (SBDC) Experiments
• Ask consumers to make a single choice among two
options:
Keeping the good
Give up the good and receive $W in return
• Prices $W systematically varied between consumers
• Seek to reduce error by increasing quantity of responses
• Aggregation of data leads to demand curves
• Can be done with or without incentive compatible design
17Incentive Compatible SBDC Experiments
• Randomly pick some respondents and fulfill their selection
• E.g. for Facebook
• If user chose to keep Facebook, do nothing
• If user chose to give up Facebook, then
1. Ask them to give it up for 1 month
2. After 1 month, verify whether they have used Facebook in the past
month and reward them with $W
• This can be done remotely: Facebook reports when user was
last online
• Random application to 1 in 200 users suffices for Incentive
compatibility
18Facebook study with Incentive Compatibility
n = 1497, n = 1388
2016 2017
Median WTA: 2017 $37.76 / month
[$27.19, $51.97]
Heterogeneity in valuation
Higher valuations for people with
• More time spent on Facebook
• More friends they have
• More frequent posting
• More videos watched
• Female
• Older
• Less use of Instagram or Youtube
19Relaxing Incentive Compatibility
Values are lower for NIC condition => NIC is an underestimate
20BDM Lottery
Use Approach of Becker, DeGroot, and Marschak 1964
1. We ask minimum amount of money they would accept to give up
Facebook for 1 month
2. After the survey, a random price is drawn from a uniform distribution of
values.
• If the random price is lower than the bid, the respondent will receive
no money but can keep the access to Facebook.
• If the random price is higher than the bid, the respondent will be paid
the random price when giving up Facebook for 1 month.
• We can remotely monitor whether they access Facebook for that month
21SBDC vs. BDM
Observed shares between SBDC and
BDM correlate strongly (Correl. = 0.891)
N = 139 (BDM) and 356 (SBDC)
22Scale up using Google Consumer Surveys (NIC)
23Some Implied Demand Curves and WTA
Wikipedia: WTAmedian = $150/year
24Most widely used categories of digital goods
Email Search
Maps Video
25Most widely used categories of digital goods
E-Commerce Social Media
Messaging Music
26Most widely used categories of digital goods
95% CI 95% CI
Median Median
2016 2017
Category WTA/year WTA/year n
2016 2017
lower upper lower upper
All Search Engines $14,760 $17,530 $11,211 $19,332 $13,947 $22,080 8,074
All Email $6,139 $8,414 $4,844 $7,898 $6,886 $10,218 9,102
All Maps $2,693 $3,648 $1,897 $3,930 $2,687 $5,051 7,515
All Video $991 $1,173 $813 $1,203 $940 $1,490 11,092
All E-Commerce $634 $842 $540 $751 $700 $1,020 11,051
All Social Media $205 $322 $156 $272 $240 $432 6,023
All Messaging $135 $155 $98 $186 $114 $210 6,076
All Music $140 $168 $112 $173 $129 $217 6,007Non-digital goods: Breakfast Cereal
WTAmedian = $48.46/year
[$42.01, $55.60]
Implied Consumer Surplus = $15 billion
Compare: US Cereal Revenue = $10 billionAnother approach: Best-Worst Scaling
vs.
Maps No Maps
+ vs. +
Earn $100 less/ year Earn same as nowAnother approach: Best-Worst Scaling • All Internet • Facebook • Toilets at home • Earn $10 less /yr • Smartphone • Twitter • TV • Earn $100 less /yr • Email • Instagram • Meeting friends in person • Earn $500 less /yr • Search Engines • LinkedIn • Breakfast cereal • Earn $1000 less /yr • E-Commerce • Skype • Airline Travel • Earn $5000 less /yr • Music • Snapchat • Public Transport • Earn $10,000 less /yr • Video • Uber • Social Media • WhatsApp • Maps • Wikipedia
BWS Results: Disutility from losing access to goods for 1 year
                                                                                              No toilets in my home
                                                                                              No access to all Internet
                                                                                              Earning $10,000 less
                                                                                              Earning $5,000 less
                                                                                              Earning $1000 less
                                                                                              No access to all search engines
                                                                                              No access to all email services
                                                                                              No TVs in my home
                                                                                              Not meeting friends in person
                                                                                              Earning $500 less
                                                                                              No access to a smartphone
                                                                                              No access to online maps
                                                                                              No access to online shopping
                                                                                              No access to video streaming
                                                                                              Earning $100 less
                                                                                              No access to music streaming
                                                                                              No access to Facebook
                                                                                              No breakfast cereal
 •      Strong correlation (0.87) between SBDC WTA and BWS utilities                          Earning $10 less
 •      Almost identical ordering between both approaches                                     No access to airline travel
                                                                                              No access to Wikipedia
                                                                                              No access to Twitter
                                                                                              No access to public transportation
                                                                                              No access to Instagram
                                                                                              No access to LinkedIn
                                                                                              No access to all ride sharing services
                                                                                              No access to Skype
                                                                                              No access to Uber
                                                                                              No access to Snapchat
                                                                                              No access to WhatsApp

     -4.5        -4        -3.5        -3        -2.5        -2        -1.5   -1   -0.5   0                                            31
Integrating GDP growth accounting for free goods
Brynjolfsson, Diewert, Eggers, Fox & Gannamaneni (2017):
• Derive an explicit term to measure the value of a free good on welfare change
• Provide adjustments to national accounts to infer welfare from GDP
• Combine this framework with our choice experiments to empirically estimate
adjustments to national accounts to include free digital goods
32GDP growth accounting for new and free goods
QFullA = QF
+ (p00* − p01)q01/[p0⋅q0 (1+PF)] adjustment for new goods
+ (w00* − w01)z01/[p0⋅q0 (1+PF)] adjustment for new free goods
+ [2w0⋅(z1 − z0) + (w1 − w0)⋅(z1 − z0) + 2w01z01] /[p0⋅q0 (1+PF)] adjustment for continuing free goods
Where
w0 = WTA of continuing free goods in period 0
w1 = WTA of continuing free goods in period 1
z0 = Quantity of continuing free goods in period 0
z1 = Quantity of continuing free goods in period 1
w00* = Shadow WTA of new free good in period 0
w01 = WTA of new free good in period 1
z01 = Quantity of new free good in period 1
p0 = Prices of non-free continuing goods in period 0
q0 = Quantities of non-free continuing goods in period 0
PF = Fisher price index = [(p1⋅q0/p0⋅q0)(p1⋅q1/p0⋅q1)]1/2
wt, zt = WTA and quantity of free goods in period t Estimated through choice experiments
33Conclusion
1. GDP, developed in 1930s, remains the de facto metric of economic
growth.
2. Conceptually, consumer surplus is a better metric of well-being.
3. Massive online surveys have the potential to reinvent and
significantly supplement the measurement of economic welfare.
• Can be used for goods whether they have zero price or positive price
• Highly scalable
• Can be run in near real time to track changes in well-being
4. This approach can be incorporated into the national accounts
34References
1. Brynjolfsson, Eggers & Gannamaneni (2017). Using Massive Online Choice
Experiments to measure changes in Well-being. Working Paper.
2. Brynjolfsson, Diewert, Eggers, Fox & Gannamaneni (2017). The digital economy,
GDP and Consumer Welfare. Working paper (available in Dec 2017).
3. Brynjolfsson, Eggers & Gannamaneni (2017). Hypothetical bias in choice
experiments. Working paper (available in Jan 2018).
Please Join us at 2:30pm on Jan 5 2018 at the AEA annual meetings (Philadelphia)
for our session on “New Measures of the Economy”
1. Erik Brynjolfsson, Felix Eggers and Avi Gannamaneni
2. Michael Porter and Scott Stern
3. Austan Goolsbee and Peter Klenow
4. Alberto Cavallo, Erwin Diewert, Robert Feenstra, Robert Inklaar, Marcel Timmer
35Can We Incorporate This Into the National
Accounts?
• For goods which have a price:
• We can often infer welfare from national accounts
• Consider effects of changes in prices and quantities on welfare
• E.g. Hulten 1978, Diewert 1983, Jorgenson and Slesnick 2014, and others.
• For new goods:
• Try to estimate virtual price (aka shadow or reference price) in pre-launch period which would imply 0 units of
consumption
• Then infer welfare using similar methods
• E.g. Hicks 1920, Diewert 1980, Hausman 1994, Feenstra 1994
• Other issues to consider:
• Intangibles, quality adjustments, household production etc.
• Many alternative indexes for happiness, subjective well-being etc.
Challenge: Integrate free goods
37You can also read