Case Study: New Zealand i-SITEs - Victorian Visitor Information Centre Summit - VTIC
←
→
Page content transcription
If your browser does not render page correctly, please read the page content below
Case Study: New Zealand i-SITEs
Victorian Visitor Information Centre Summit
Shepparton
9 August 2016
Australia/New Zealand: The worlds
best visitor centre networks…?
Our markets are similar
Our structures and ownership is similar
       Our challenges are similar

    We can learn from each other
New Zealand tourism overview
Tourism: importance to New Zealand
•   New Zealand's second largest export industry (behind dairy) in terms of
    foreign exchange earnings. Soon to be number 1.
•   Annual international tourism expenditure in New Zealand NZ$11.8b (year
    ended Mar15).
•   3.3 million international visitors a year spending on average NZ$3,490 each.

•   Combined with domestic expenditure the tourism industry is worth NZ$29.9b
    a year to the economy.
•   Tourism directly employs 6.9% of New Zealanders – 168,012 people.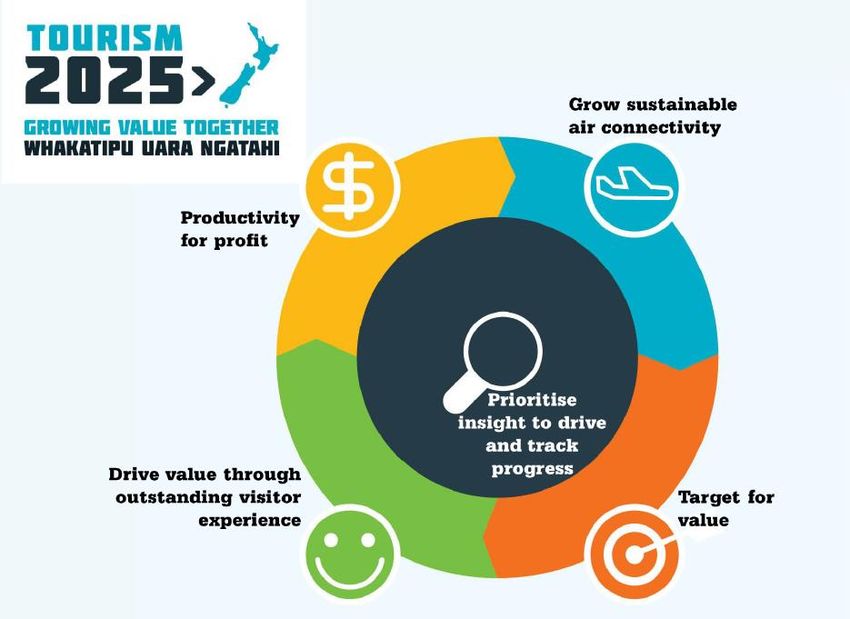
Total international visitor arrivals
                      (Top 10 markets)

Country     Year ended June       Compared to
                 2016             previous year
Australia      1,365,440                 6.2%
China          396,928                   26.7%
USA            257,536                   10.4%
UK             213,808                   7.9%
Japan           94,208                   11.6%
Germany         91,232                   12.5%
Korea           75,088                   23.9%
Canada          55,472                   9.8%
Singapore       53,456                   13.1%
India           48,368                   13.3%
All
              3,291,128                  10.6%
Countries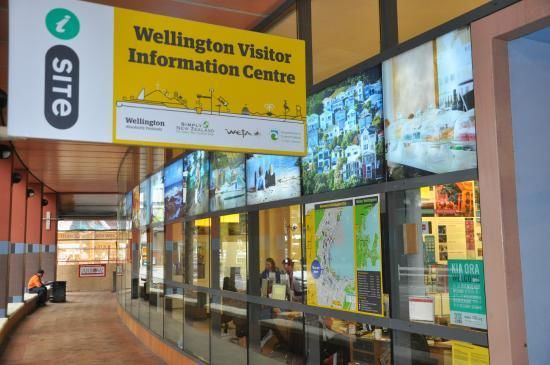
Trends
• New Zealand is in the midst of
  an international market driven
  tourism boom
• International visitor arrivals
  growing 11% pa
• International visitor
  expenditure growing 25% pa
• However domestic travel
  relatively flat
• Focus on shoulder season growth
  as peak season constrained by
  capacity
National tourism strategy

Forecast: By 2022: 4.5 million international visitors (1 million from China)

i-SITE overview
TIC’s, VIC’s and i-SITEs
TIC’s, VIC’s and i-SITEs – Why?
 Local prestige
 Promote local businesses – tourism and non-tourism
 Promote events
 Promote Council and community services
 Keep visitors staying longer in the region
 Encourage visitor spending in the region
 Reinforce local identity/brand
 Duty of care to visitors – safety/freedom camping
 Disaster management

     Everyone wants us but are they willing to pay?
i-SITE history During 70’s and 80’s up to 130 Public Relations Offices and Information centres operating using the white i on blue background. Many loosely grouped around Information centres NZ (ICNZ). New Zealand Tourism Board established VIN in 1990 Aim was to provide accurate, appropriate and objective information throughout New Zealand. Initially 100 members. In 1999 VIN became an incorporated society In 2002 i-SITE brand launched including fern and Visitor Information
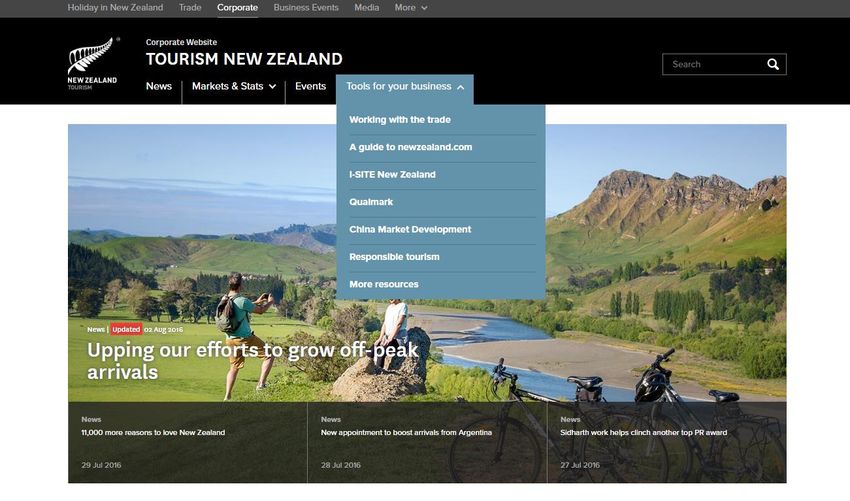
Why is Tourism New Zealand involved?
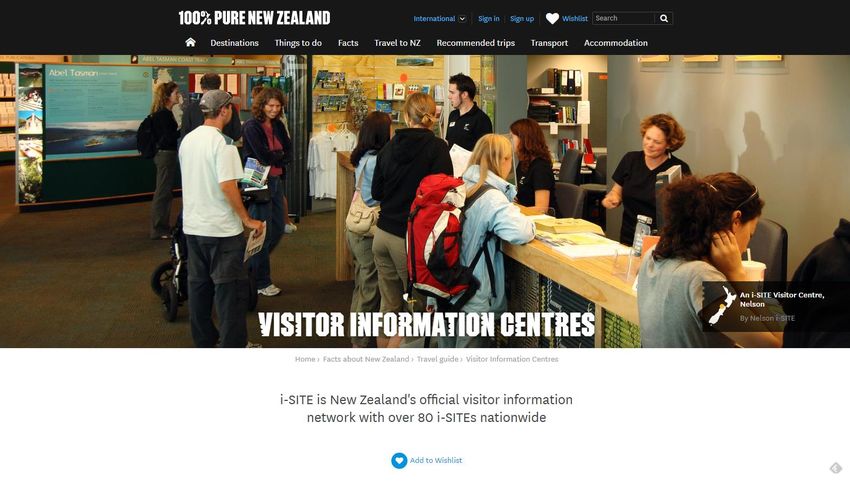
i-SITE Visitor Information Network & Qualmark
Visitor Centres are a key part of the visitor experienceKey facts about i-SITE New Zealand
New Zealand’s official Information Centre
Network
All i-SITEs independently owned – united
by common brand and membership of VIN
Inc./i-SITE New Zealand
Currently 81 i-SITEs
None owned by VIN Inc: Almost all Council
owned or rely on some form of Council
funding/grant/contract
Employ ~500 staff
Handle ~ 7.5 million visitors
Turnover >$74 million
Only 10 profitable before Council/RTO
funding. Total deficit of >$10 million
Visitor Centres are big business but shouldn’t be judged
on profitability aloneMixed ownership Council's control 43% directly EDA/RTOs directly control 24% (Council part funded) IncSoc’s/Trusts control 16% - many of these receive Council grants Independent 11% (privately owned – 2 under contract to Councils) Local government is our most important stakeholder
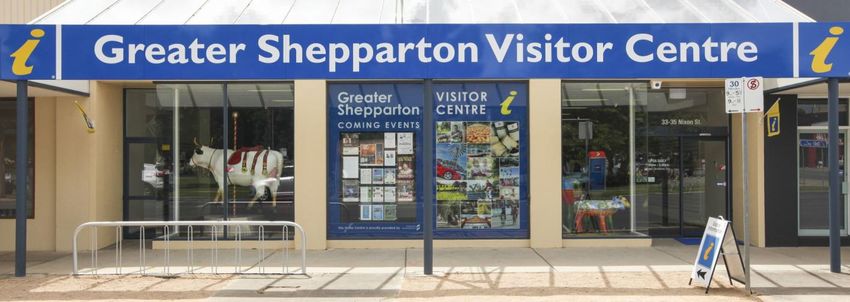
Co-location is ‘in’
• For many Council owned i-SITEs the easiest
  way to cut overheads is to co-locate
  – Trend towards sharing staff, buildings with:
     •   Museums
     •   Art Galleries
     •   Performing Art Centres
     •   Libraries
     •   Community Service Centres
     •   Council Service Centres
     •   Cafes
Non-accredited VICs
Beside i-SITEs, New Zealand VICs are also operated by:
Department of Conservation
Community volunteer groups (often Council part funded)
PLUS: numerous private sector visitor centres
DOC/i-SITE collaboration an opportunityWho uses i-SITEs?
Key international markets:
• Germany
• UK
• USA
• Australia
• Other Europe
Some of NZ’s ‘Top 10’ markets
Under represented:
• Australia
• China
Extremes: • Japan
Some centres can be up to 80% local • Korea
Some centres can be up to 85% domestic
Some centres can be up to 95% international
Every i-SITE has a different marketKey VIC differences: AUS vs NZ
• No state government involvement in New
Zealand
• Close relationship with NTO
• NZ VICs have large national touring focus
• Professional staff vs. volunteers
• NZ move to integrate with National Park VICs
• National marketing of brand
More similarities than differencesNational brand marketing Expert local knowledge Information and bookings Network throughout New Zealand The official visitor information network
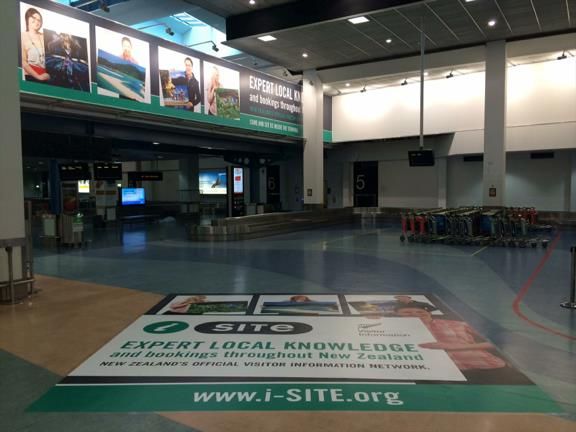
Gateway airport displays

Auckland international terminal – escalator to baggage claim
January-March 2015
Gateway airport displays

Auckland international terminal baggage hall
January-March 2015
newzealand.com   33 million visits annually
i-site.org
newzealand.com mobile
• 55% of users now on mobile
  devices
• newzewaland.com in-country geo-
  location optimised version now
  live
• ‘Find my nearest i-SITE’ now on
  front screen
• Includes opening hours, directions
  and direct connect (phone/email)
Proving our value
• Problem:
– Owners/stakeholders often judge value on profitability
– i-SITEs generally don’t/can’t make a profit
– We know we add value but wanted definitive proof
• Solution:
– Demonstrate ‘value add’ proposition by quantifying our
non-commercial activities
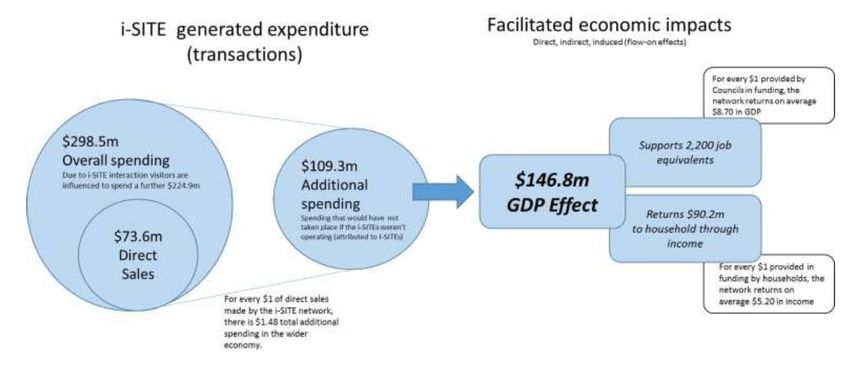
We are often regarded as a ‘cost’ rather than a ‘benefit’Economic impact • Research undertaken in mid-2015 by independent economic analysts using accepted methodology • Key finding: i-SITEs across the country are adding value to regional economies by improving visitor experiences that in turn increase local spending and generate local benefits
Direct influence                                               Learning #1

• $73.6m in direct sales by i-SITEs
• $224.9m in additional direct sales due to i-
  SITE influence
   – Visitors taking advice from i-SITEs (personal
     interaction with consultants or taking brochures
     or viewing advertising) but then booking direct
     with suppliers
• = $298.5m total
  For every $1 transacted in an i-SITE we directly influence
      a further $4.05 in spending direct with suppliers
Adding unique value Learning #2
• “Sure, but if i-SITEs didn’t exist this activity
would take place direct anyway. You’re just
clipping the ticket”
– Sure, that’s partly true, but…
• $109.3m of this additional spending was due
to i-SITE influence that would NOT have taken
place if the i-SITEs didn’t exist
For every $1 transacted in an i-SITE we directly influence
a further $1.48 in spending direct with suppliers which
wouldn’t have taken place without our involvementUnlocking potential
• VICs are able to unlock and facilitate additional
expenditure within the region because they link
visitors with the ‘things to do’ that they were
previously unaware existed.
• As a result, VICs can make the visitor experience
more pleasurable, more convenient and generally
‘richer’ for visitors.
• VICs facilitate visitor activity within the regions,
which in turn facilitates the purchase of goods
and services by visitors to the regions.
They stay longer and buy stuffFlow on effects Learning #3
• Both Councils and ratepayers are getting value
for money
• That $109.3m of additional spending
translates to a $146.8 GDP effect.
– This supports 2,200 job equivalents
– And returns $90.2m to households through
income
For every $1 provided by Councils in funding, the network returns
on average $8.70 in GDP
For every $1 provided by households (ratepayers), the network
returns on average $5.20 in incomeEconomic impact Download report: http://www.tourismnewzealand.com/tools-for-your-business/i-site-new-zealand/
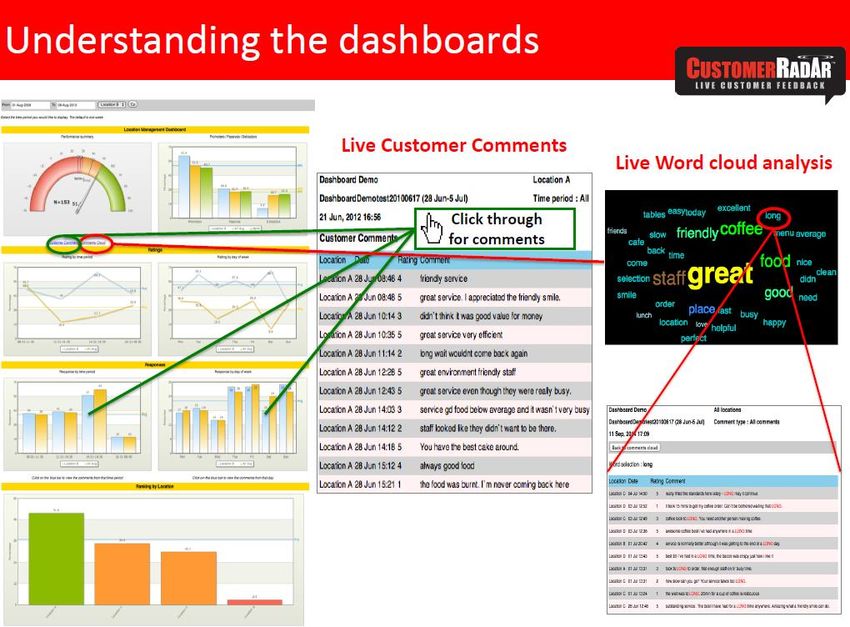
Measuring customer satisfaction
• Highly satisfied customers promote the
  network more than advertising can do
• They are also usually highly satisfied with the
  local/regional tourism products
• Proving to owners (Councils) that we do a
  great job of satisfying customers is also a key
  network outcome

 Tracking customer satisfaction is just as important as tracking
                    financial performance
Customer Radar • 24/7 live customer feedback • 1 year trial using 13 i-SITEs • Currently 45 i-SITEs using (first year 50% subsidised by i-SITE NZ)
Customer Radar
Customer Radar results
                                                 100.0%         Customer Radar - Network NPS Score
                                                     95.0%
                                                     90.0%
                                                     85.0%
                                                     80.0%
                                                     75.0%
                                                     70.0%
 350
            Customer Radar - Network65.0%
                                     Responses                                               Promoters
                                                     60.0%                                   Passives
 300                            4
                                                     55.0%                                   Detractors
                               47
        5                                            50.0%
 250   24                                                    Mar-15   Apr-15   May-15    Jun-15    Jul-15    Aug-15   Sep-15   Oct-15   Nov-15   Dec-15   Jan-16   Feb-16   Mar-16   Apr-16   May-16

                          7                     5                                        6
                                                         6                              17
 200                     32                     31      20                      3
                                                                       4       28                            3
                                                                                                            11
                    5                                                 25
 150          4    19                                                                             5
                                                                                                  7
             30                258         4
       231                                15                   4
                                                               8
 100                                 4                                                  199
                         182         20         182 187                        166                      169
                   147                                                148                         149
             120                          110                106
 50
                                     83

  0

For the first time we can now prove we are doing an exceptional
              job at delivering great customer service
Future direction
VICs will continue to be an important part of delivering a
             personalised visitor experience

The internet will only enhance our reason to exist
Key challenges Increasing funding pressure and scrutiny from local government - need to deliver measurable returns A change in the mix of international visitors with different travel preferences, resulting in reduced awareness and usage of the network – growth in new markets (i.e. China) with no visitor centre history Changes in mobile technology usage by visitors – both as information and booking source Working in isolation – need to work closer with partners (Tourism NZ, RTOs, DOC, Local Government, private sector)
New strategy
• 2016-2020 strategic plan under development
• Focus will be on:
  –   Brand and awareness
  –   Productivity
  –   Customer experience
  –   Valuing the network
• By:
  – Using technology to transform the business
  – Improving our training and knowledge management
  – Taking a commercial lead
More information
i-site.org | newzealand.com
More information
tourismnewzealand.com
Nga mihi / thank you
You can also read