REAL ESTATE INDUSTRY KEY TRENDS & COMPETITIVE STRATEGIES IN 2018 - Connexity
←
→
Page content transcription
If your browser does not render page correctly, please read the page content below
REAL ESTATE INDUSTRY KEY TRENDS & COMPETITIVE STRATEGIES IN 2018
INTRODUCTION
2017 was a transformative year for the American real estate market. Housing inventory
tightened, and home prices and demand soared in response — particularly within major cities.
Experts predict continued growth this year, although perhaps not quite as rapidly as last year.
Commercial real estate development will continue evolving as well, as the retail industry shifts
to meet consumer needs and omni-channel expectations.

In this report we’ll use search, visitation and locational data to pinpoint fast-rising real estate
trends. Next, we’ll provide tangible strategies for both large and small listing services who
want to get ahead in a competitive market. Finally, we’ll show how commercial real estate
companies can study online behavior to meet consumer demand in different regions.
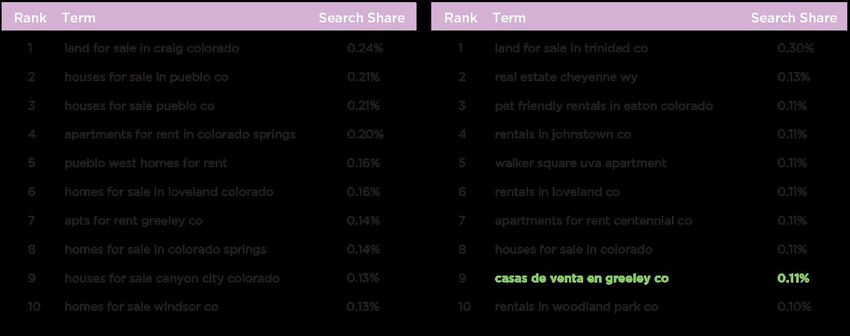
TABLE OF CONTENTS

01.   SPOT REAL ESTATE
      TRENDS WITH SEARCH

02.   TIGHTEN COMPETITIVE
      STRATEGY FOR LISTING SITES

03.   USE DATA FOR SMARTER
      COMMERCIAL DEVELOPMENT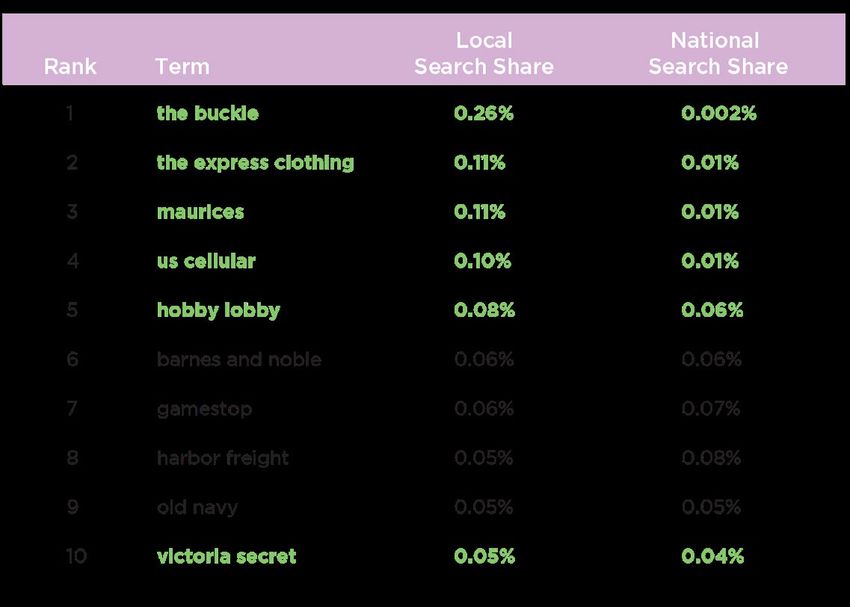
01.
SPOT REAL ESTATE
TRENDS WITH SEARCH
        In this chapter you’ll learn how to use search data
        to uncover rising real estate trends, and pinpoint
        demand on a local level.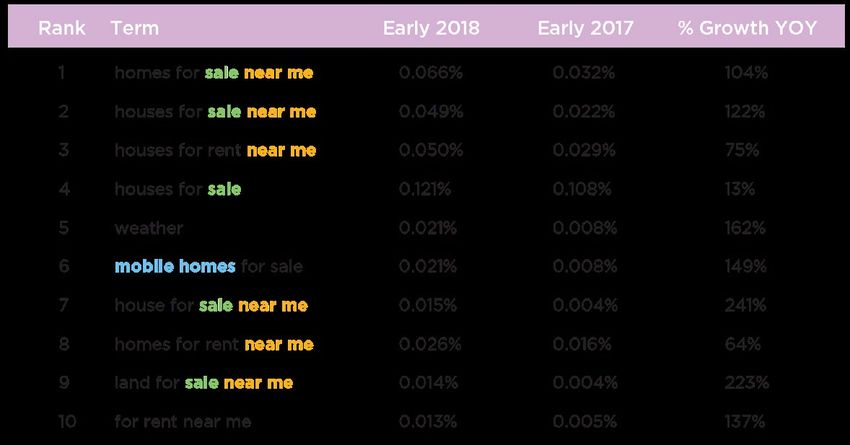
BIG-PICTURE SEARCH DEMAND
In order to get a broader view of current housing demands, we broke down the top searches driving
traffic to the real estate industry in the beginning of 2018.

                 Top 20 Unbranded Terms Driving Traffic to Real Estate Industry

From this, we observe a few things…

Apartments for rent are in high demand, but we’ll see on the next page this is a steadfastly
popular term, rather than a new opportunity. It has a lower organic rate, suggesting many listing sites
are already competing for this term in paid search.

Mortgage calculator is an important term driving traffic to the real estate
industry, and has an extremely high organic click rate.

Many home search variations have high organic rates, and several
of them include the phrase “near me” (which is a trending keyword phrase,
as we’ll show on the next page).

Source: Top unbranded searches (i.e. without brand names like zillow, redfin, etc.) leading to Real Estate industry over 4 weeks ending 2/10/2018.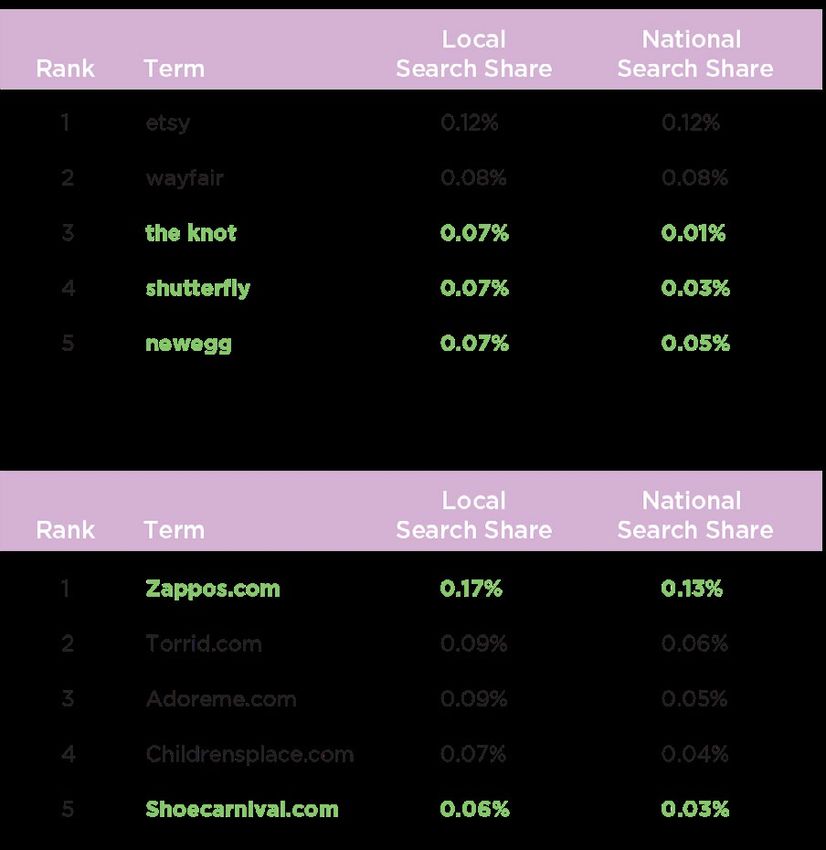
UP-AND-COMING REAL ESTATE TRENDS
Next, we charted “fast-rising” search terms — in other words, popular keyword variations that showed sizable
growth in the beginning of 2018 when compared to the same period last year.

          Fast-Rising Unbranded Terms Driving Traffic to Real Estate in 2018

These reveal several interesting trends for 2018:
Real estate searches including the phrase “near me” are much more popular this year than they were a
year ago — in many cases these terms draw about 2X as many search clicks as they did in 2017.

3/5 searches include the phrase “for sale”, which indicates a growing consumer desire to buy
(rather than rent) property.

Mobile home searches are rising, and according the US Census Bureau, sales of manufactured homes
have been growing for years. We may see a spike in consumers buying their own land, then adding mobile
or manufactured homes onto their property afterwards.

                                                            Searches for “3 bedroom house
                                                            for rent” jumped                 646% YoY
     THREE
               MS
     BEDROO                                                Searches for “3 bedroom apartment
                !
     O R B U ST                                            for rent” jumped                 257% YoY
   Source: Top fast-rising unbranded searches leading to the Real Estate industry over 4 weeks ending 2/10/2018 (“Early 2018”) and 4 weeks ending
   2/11/2017 (“Early 2017”).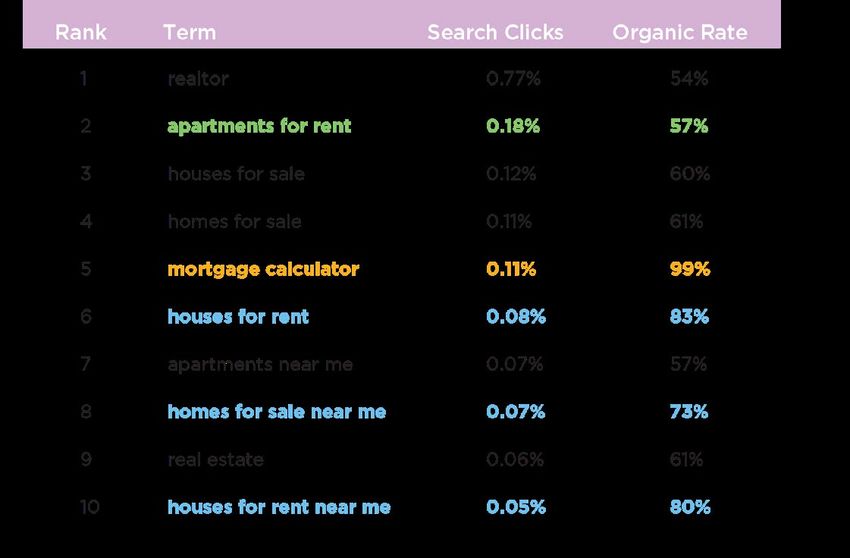
LOCALIZED TRENDSPOTTING:
SPOTLIGHT ON COLORADO
Let’s say a major real estate developer based in Colorado wants to get ahead of the next “hot spots”
to focus new housing construction. They can use state-level search data to identify popular Colorado
locations, and the type of property sought there in 2018.

                             2017                                                                                    2018
              Pueblo - purchase and rent                                                                     Trinidad – land

              Craig - land                                                                                   Johnstown - rentals

              Colorado Springs - rentals                                                                     Loveland – rentals

              Loveland - purchase                                                                            Centennial - rentals

       This year, a “homes for sale” search in Spanish surfaced to the top — how can real
       estate companies in Colorado better connect with Hispanic home buyers?

Source: Top searches leading to the Real Estate industry that include a locational keyword in them (city, state, street, etc.), conducted by audiences in
Colorado. Measured over 4 weeks ending 2/10/2018 and 4 weeks ending 2/11/2017.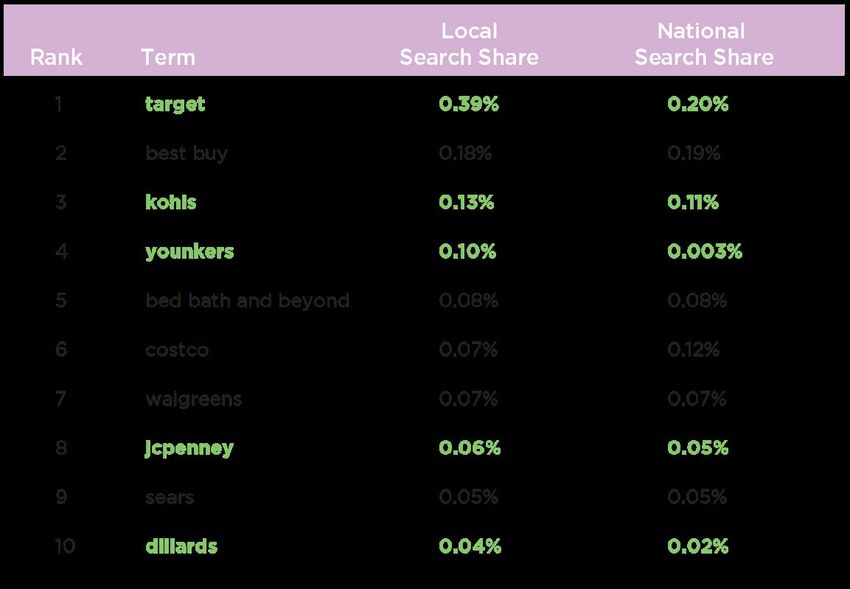
02.
COMPETITIVE BENCHMARKING
FOR LISTING SITES
       In this chapter we’ll dig into strategies for both
       national and local listing services to compete in a
       fast-moving market.
NATIONAL LISTING SITES
COMPETE LOCALLY
Real estate listings are a big business — but website rankings for most of the top players (Zillow, Trulia,
Realtor.com, etc.) have held steady for years. As you see below, the relative visit share for the top US listing
websites has shown very little movement over the past year:
Visit Share – Top 10 Real Estate Listing Sites
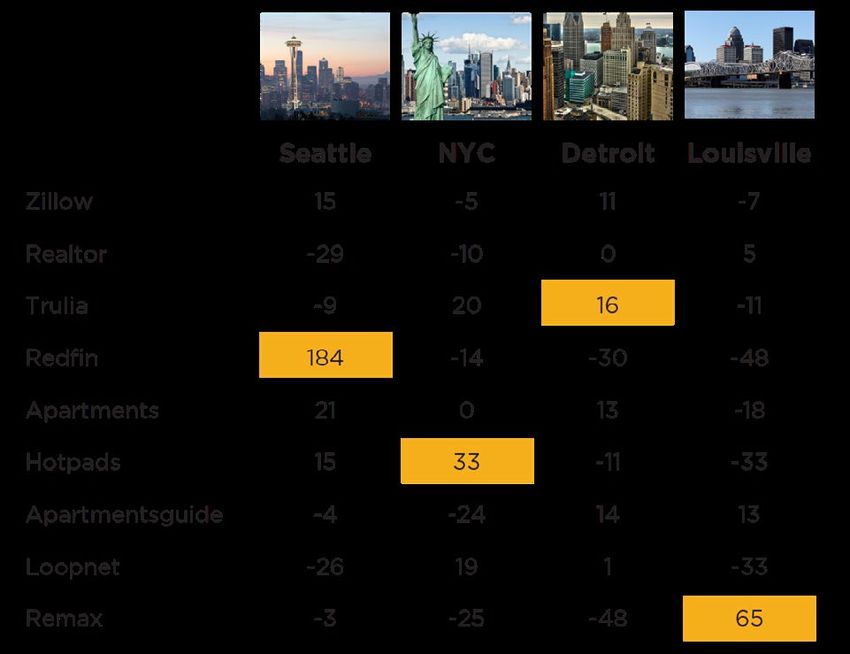
That being said, competition
amongst listing sites is fiercer
on a local level. Although
Zillow gets more total traffic
nationwide (since it’s the
largest player in this space), on
the right you can see several
cities where other listing
sites get proportionally more
traffic (therefore have a higher
visitation index). For example,
Redfin has a more relative
engagement from people living
in Seattle than any of the other
listing sites do.
Source: Website visit share for the top real estate listing sites charted from 1/17/2017 to 1/18/2018. Visitation index based on audience overlap between
visitors to the top listing websites, and residents of Seattle, NYC, Detroit and Lousville DMAs, based on 4 weeks ending 2/10/2018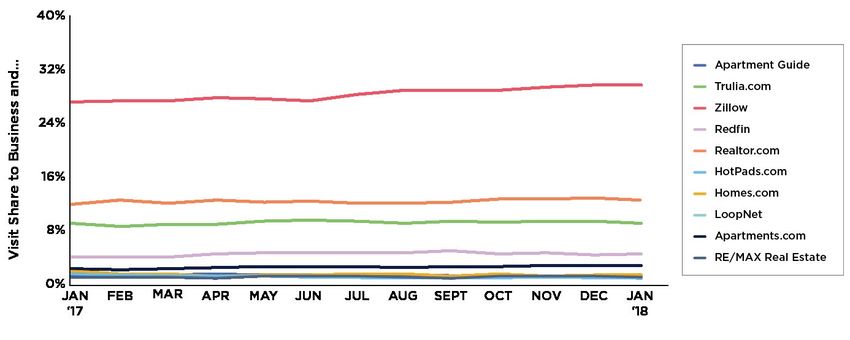
HOW SMALLER LISTING
SITES CAN THINK BIG
How can smaller listing sites survive in such a competitive market?

It turns out that there is plenty of room for smaller, more localized listings to succeed. Rather than blindly
fighting for a bigger piece of the pie, smaller listings must understand how big the pie is, what piece of the
pie they want, and how much of that piece they are getting.

For example, Reece Nichols, which is based in Kansas City and focuses on local listings, should not only
measure how much traffic they are getting each quarter, but also these two KPIs…

                                       Reece Nichols - Real Estate Benchmarking

                                                                                      Target audience reach: What percentage
                                                                                      of people are they reaching who are
                                                                                      seeking real estate and live in Missouri?

              Visit share in the real estate industry: What is their share of the real estate pie? This
              KPI enables them to know for certain whether website traffic growth is just part of an
              overall market spike, or Reece Nichols is genuinely winning more available business.

Source: Benchmarking chart based on reach (percentage of people within Missouri who have visited their website) and visit share (percentage of visits
from within the Real Estate industry). Q3: 14 weeks ending 9/30/2017, Q4: 14 weeks ending 12/30/2017 and Q1 thusfar: 7 weeks ending 2/17/2018.
WHY LOCAL LISTINGS SHOULD
LOOK NATIONALLY
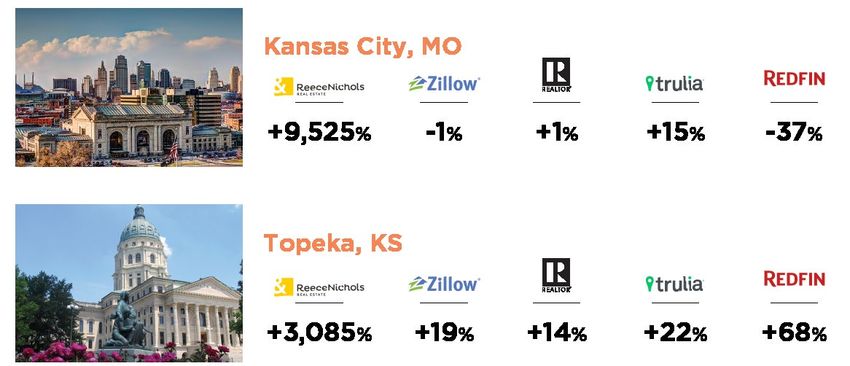
Continuing with our example of Reece Nichols, it intuitively makes that sense this local listing service over-
indexes with people living in or near Kansas City. As you see below, reecenichols.com has more relative
audience overlap with people living in Kansas City and Topeka than bigger listing sites do:
Audience Overlap Index
City Residents vs. Listing Site Visitors
However, it’s more surprising to learn that reecenichols.com also has a higher overlap index with residents
of Pittsburg, located 840+ miles away. It appears that people in Pittgsburg are more likely to research real
estate specifically around Missouri, so it may be valuable for Reece Nichols to geotarget advertisements in
this city. They also might consider digging deeper into other cities, to identify new out-of-state regions where
they can attract prospective home buyers who are toying with the idea of buying property in Missouri.
Source: Visitation indices based on the audience overlap between Kansas City, Topeka and Pittsburg, against visitors to reecenichols.com, Zillow.com
Realtor.com, Trulia.com and Redfin.com, over 4 weeks ending 2/10/2018.03.
COMMERCIAL REAL ESTATE DEVELOPMENT:
ASSESSING DEMAND
In this chapter, you’ll learn how commercial real
estate developers can use online behavioral data
to meet local demand, and evaluate the need for
specific services and spaces in different locations.CHOOSING CORNER
DEPARTMENT STORES
Let’s imagine that Westfield wants to build a new Galleria Mall in Des Moines, Iowa. They have identified a
prime location — the next step is to select the right retailers to fill the space. How can Westfield pick the right
brick-and-mortar retailers to place in their mall, based on what shoppers in Des Moines want and need?
Below are the top big-box retailers that people in Des Moines search for — those highlighted in green pull a
higher relative search share in Des Moines than the national average. Target, Kohls, JC Penney and Younkers
are all solid candidates to be the primary department stores flanking the new Westfield mall. A quick
Google search also reveals that JC Penney and Dillards are located far outside of downtown Des Moines, so
placing them in the mall (in a more central location) might also provide a lot of convenience for residents.
Top 10 Searches for Big Box / Dept Stores in Des Moines
Source: Based on top searches leading to the Retail industry by residents of Des Moines vs. the
average American population. Big box stores were identified manually, list excludes Walmart. Pulled
over 4 weeks ending 2/10/2018.SELECTING
HIGH-DEMAND RETAILERS
The large department stores have been chosen — what about the smaller retailers (apparel stores, hobby
shops, bookstores etc.) that will flesh out the rest of the mall? Below, we see the top small-box retailers
that people in Des Moines search for, and which stores they seek even more frequently than average, as
highlighted in green. Many of these searches also coincide with high website visitation, suggesting local
residents are already shopping with these retailers online.
People in Des Moines are 4X more likely than
to visit Maurices.com than the average American.
Top 10 Searches for Small Box Retailers in Des Moines
Victoriassecret.com is the #2
most
visited apparel website in Des Moines
Source: Based on top searches leading to the Retail industry by residents of Des Moines vs. the average American population. Stores selling apparel,
books, games, hobby, cellular devices and more were identified manually. Pulled over 4 weeks ending 2/10/2018.FULFILLING NEW,
UNMET SHOPPER NEEDS
Westfield has identified the top brick-and-mortar stores to fill their shopping center — how else can they
stand out from local malls? Studying online retail behavior in Des Moines can help uncover additional,
unmet retail needs that a mall can serve. For example, based on the high rate of searches for “the knot”
leading to retail websites, Westfield knows there is a strong local demand for wedding services and
products. In response, they can invite several wedding stores or bridesmaid boutiques to set up shop.
Top 5 Online-Only Retail Sites Searched in Des Moines
People in Des
7X
Moines are
more likely
to search for
the knot
Key Online-Only Retail Sites Visited in Des Moines
People in Des Moines have a high propensity to visit e-commerce stores
that sell shoes, like Zappos and Shoe Carnival. It suggests there is a demand
for shoe options, and Payless or DSW might be a good fit for the Westfield mall.
Source: Top searches for e-commerce or online-only sites leading to the Retail industry, and top visits to e-commerce sites within the Retail industry.
Based on residents of Des Moines vs. the average American population over 4 weeks ending 2/10/2018.KEY TAKE-AWAYS Localized search is an essential tool for assessing real estate demand: state and local search data enables you to identify up-and-coming residential hotspots, to evaluate the needs of people in a specific area, and to understand what type of property is in demand. Small and large listing services can win in the market — if they benchmark the right KPIs: The real estate market is ripe with opportunity, but no company or listing service should measure themselves in a bubble. You should always know how you’re doing against your target audience, and within your industry. Don’t make assumptions about the market, or where you fit into it — let the data speak first: Localized listing services should never assume their only target audience lives in their home town. Real estate developers should look at what consumers are seeking with search, but also what they need. How you can be the first to translate your audience’s needs into a physical space or experience?
WANT THESE INSIGHTS?
THE FOLLOWING HITWISE TOOLS & SERVICES WERE FEATURED IN THIS REPORT:

         Locational Data: Track real estate demand, audience demographics and your
         competitive performance on a national, state or local level.

         Search Insights: Spot fast-rising trends and track search behavior on a daily,
         weekly, monthly or annual basis. Identify high-value terms to target in SEO, PPC
         and content creation.

         Audience Profiler: Build rich segments based on online behavior, location,
         demographics and more. Discover the interests and behavior of your own
         audience, and where to target them online.

         Competitive Benchmarking: Track your performance within the real estate
         industry or against a specific competitive set. Benchmark your performance
         within specific locations or demographics.

                                     LET’S TALK
You can also read