FINSCOPE MYANMAR 2018 LAUNCH - NAY PYI TAW, MYANMAR 19 JUNE 2018

Page created by Kathy Frazier
 
CONTINUE READING
FINSCOPE MYANMAR 2018 LAUNCH - NAY PYI TAW, MYANMAR 19 JUNE 2018
FinScope Myanmar 2018
Launch
Nay Pyi Taw, Myanmar

19 June 2018
FINSCOPE MYANMAR 2018 LAUNCH - NAY PYI TAW, MYANMAR 19 JUNE 2018
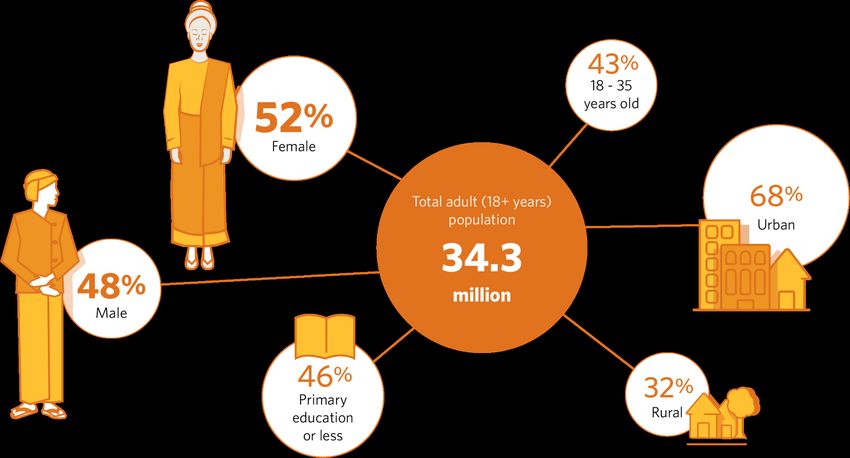
Sampling and weighting
       Respondent profile       Coverage and                      Sample and fieldwork
                                methodology                       validation
                                                              §   Sample representative at
       § Universe: Adult        § Fieldwork conducted
                                                                  national, state/regional and
         population in            from January – April 2018       urban/rural
         Myanmar
                                § Questionnaire translated    §   Sample drawn probability
       § Myanmar residents 18     and conducted in                proportional to population size
         years and older          Myanmar language            §   Survey data weighted to adult
                                                                  population projection 2018
                                § 5 500 interviews
                                  conducted by Myanmar        §   Sample methodology and data
                                                                  weighting verified by Central
                                  Survey Research (MSR)
                                                                  Statistics Office / Department
                                                                  of Population & Statistics

2
FINSCOPE MYANMAR 2018 LAUNCH - NAY PYI TAW, MYANMAR 19 JUNE 2018
Understanding local context

3
FINSCOPE MYANMAR 2018 LAUNCH - NAY PYI TAW, MYANMAR 19 JUNE 2018
Demographics

4
FINSCOPE MYANMAR 2018 LAUNCH - NAY PYI TAW, MYANMAR 19 JUNE 2018
Sources of income and livelihoods
    Most adults depend on irregular income sources

                                   Main income source

o Almost a quarter of adults
    claim farming as main income
    source
o   21% of adults claim not to
    have an income
o   90% of those without income
    are dependent on
    family/friends

5
FINSCOPE MYANMAR 2018 LAUNCH - NAY PYI TAW, MYANMAR 19 JUNE 2018
Sources of income and livelihoods
    Two in three adults earn under $75 per month

                                   Personal Monthly income

                                                                         $75 earn under per month

    o Two thirds (66%) of adults
      personally earn
      MMK100,000 (≈$75) or less
      per month                              34                     14        8    7          22              15

                                                  MMK 100 001 and above            MMK 60 001 - MMK 100 000
                                                  MMK 30 001 - MMK 60 000          MMK 30 000 and under
                                                  No income                        Do not know/refused

6
Poverty symptoms
    Poverty related symptoms show a drop in 2018

         Skipped a meal because of lack of                     6                               6%
                     money                                              9

      Gone without medical treatment or                                              15
                                                                                               15%
                 medicine                                                                 17

         Not been able to send children to                     6                               6%
                     school                                         8

                                                2018       2013

     • Poverty symptoms measured from 2013 amongst Myanmar households have reduced in 2018

7
Access to amenities

           Households with access to tap water       Households with electricity connection
       (as main source of water used in household)
                                                               Total: 54%
                    Total: 65%                             Urban 92% : Rural 39%
               Urban 79% : Rural 56%

8
Communication and media access
    Increased access & usage of technology in 2018

                      Media access in past month (%)                               Usage of communication device (%)

                                                                                Basic/
         Television                                              69       Smart phone
                                                                                                                        78
                                                            59                                              42

          Internet                                35                          Internet                 28
                                2                                                             2

             Radio
                                             25                       Computer, laptop        4
                                                                            Or tablet
                                                       51                                     3
       Newspaper/
                                         19                                     Email         3
          journals
                                         19                                                   2
                                                                           Landline at        3
        Magazines                   8                                           home
                                        16                                                        10
                                                                                                                 2018   2013
9
Infrastructure accessibility
     Rural adults are the furthest from financial access points

                                        Time taken to reach destination: Minutes (average)

                      ATM                          23
                                                                                                      82
               Post office                              26
                                                                                             70
                     Bank                          23
                                                                                             69
           Mobile money                     18
                                                                                             69
                     MFI
                                                   24
                                                                          43
            Market place
                                              18
                                                                     42
                                              20
           Medical facility                                         41
          Public transport               16
                                                             29
            Grocery Store      8                                                              Urban   Rural
                                   11
10
Financial inclusion status 2018
Financial inclusion:
     “More people have formal access in 2018”            ”

       Overall
                            2018                                                                 2013
           Formally served                       48%                                Formally served             30%

                    Banked             25%                                                 Banked         17%
                                                             = 70% as
Other formal (non-bank)                    34%               there are      Other formal (non-bank)       17%
                                                             overlaps                      Informal                        50%
                   Informal                      50%
                   Excluded                30%                                            Excluded                 38%

           • Banking is up by 8 percentage points, organic growth mainly driven by payments
           • Uptake of other formal non-bank products has doubled largely driven by credit from MFIs and Cooperatives
           • Uptake of informal financial products/mechanisms is stable at 50 percentage points although group increased
               in absolute numbers form 16,3 million in 2013 to 17 million 2018
           •   Financial exclusion has been decreased by 8 percentage points
12
Financial inclusion:
     Financial Access Strand 2018

                         25%              23%            22%               30%
          2018
                         17%    13%              32%                38%
           2013

                         25%          22%                23%               30%
          Rural
                          27%              24%            19%              30%
         Urban

                  A   One Household One          24%       29%     22%
                      Account
13                                               Total     Urban   Rural
Banking:
     Low or no income is the main barrier to not having a bank account

                               Drivers                                                   Barriers
                  25% of adults are banked in 2018                       75% of adults are not banked in 2018

               You get interest on                                        Do not need it -
                                                  27
                    savings                                              Insufficient or no                 23
                                                                         money to justify it
               Money is safe from
                                             14
                    theft
                                                                         Do not understand
                                                                                                        8
                                                                          how they work
              Easy way of sending
                                         8
               money to others
                                                                         Income coming in,
                    Easy way of                                            but insufficient
                                                                                                    6
                  receiving money    6                                      balance after
                    from others                                               expenses

               Safe way of sending                                  They are too far away
                                     6                                or transport too         1
                money to others
                                                                           difficult
14
Savings and investment
     More adults are saving in 2018

      Overall

                  Formal savings                12%
                                           7%

                         Banked            7%
                                      4%

                    Other formal           6%
                                      3%
                                                                     34%
                        Informal
                                                                  30%

                                                            25%
                        At home
                                                      19%

                                                                           50%
                     Do not save
                                                                                 62%
                                                                                       2018   2013
15
Savings and investment
     Savings across all categories increased

      Saving Strand

                     7%           5%           27%                 11%                             50%
       2018
              2018        7        5              27                  11                                 50
                 4% 3%                   25%               6%                                62%
       2013
              2013    4       3           25                 6                                    62

                          Save at bank   Save at formal non-bank   Save informally   Save with family/friends/home   Do not save

16
Saving and investments:
     Savings though MFIs, Cooperatives and Savings groups have
     doubled in 2018

             Saving mechanisms                                           2018           2013

             Savings at bank (all savings products at bank)            2,3 million    1,4 million
             Savings through investing jewellery/gold                  3,9 million    3,3 million
             Savings with / membership with informal group (Su jay)   2,25 million   930 thousand
             Saving in livestock                                       1,9 million    3,5 million
             Savings in a secret place or at home                      8,6million     5,3 million
             Savings through MFI                                      1,15 million   450 thousand
             Savings with a cooperative                               780 thousand   141 thousand

17
Drivers for saving (%)
 Adults mainly save for medical expenses, living expenses and education regardless of financial product

                   50% of adults have savings products                       50% of adults have no savings products

                Jewellery/Gold                           MFI
                                                                                   No money after living
Medical expenditure -                   Medical expenditure -                           expenses
                                                                                                                    69
                                   42       emergency
                                                                        21
    emergency
                                          Start or expand my                     Do not have an income –
        Living expenses       20                                        20          no money to save
                                                                                                               21
                                                business

Medical expenditure -
      planned
                              17             Living expenses           18                 Do not need it   4

 Education / training /
                           13           Education / training /
     school fees
                                            school fees
                                                                  13              Never thought about it   2
     Start or expand my
           business
                          9             Medical expenditure -                      Do not want to save –
                                              planned
                                                                 11                                        2
                                                                                      see no purpose

18
Borrowing and credit:
      Overall (%)

                           2018                                  Levels of credit uptake (number of adults)
                                                                                                                   4,623,334
           Formal credit                 25                4,236,801
                                    19

                               14
                                                                                       3,524,939
                Banked
                               14
      Other formal (non-        16
            bank)          7                        2018
                                                    2013
               Informal               22                                                             1,548,349
                                      23

          Family/friends       13                                         607,366
                                 17

          Not borrowing                        55
                                              52           Credit from   Credit from   Credit from    Credit from  Credit from
                                                             MADB        other banks      MFIs       Cooperatives Money lender

19
Borrowing and credit:
      Credit Strand (%)

      2018           14              12          13            7                                      54

      2013           14          5          18                 11                                      52

              Credit from bank   Credit from formal non-bank       Informal credit   Credit from family or friend   Do not borrow

20
Borrowing and credit:                                                                    54% of adults do not currently borrow
     Adults also borrow for consumption
                                                                                             • 47% Can pay living expenses with what they
                       46% of adults are borrowing                                             have
                                                                                             • 19% Fear debt

                      MADB (%)                                   MFI (%)                                            Cooperatives (%)
     Purchase of agricultural
     inputs such as seeds or                  77          Living expenses               29                     Living expenses                40
            fertilizers

     Agricultural equipment                             Start or expand my                              Purchase of agricultural
                                         48                                             27                      inputs                   32
            purchase                                          business

 Living expenses when you                          Purchase of agricultural                             Agricultural equipment
                                    23                                             17                          purchase             15
     do not have money                                     inputs

      Medical expenditure -                                                                               Medical expenditure -
                                7                     Purchasing livestock    11                              emergency            12
          emergency

       Education / training /                        Medical expenditure -
                                5                                             9                     Start or expand my business    11
        school fees costs                                emergency

21
Insurance and risk management
     Insurance uptake is slow but increasing

                                2018                                    2013

                     Insured           16%                         Insured     7%

       Other formal insurance     6%
                                                     Other formal insurance    2%
           Informal insurance      11%

        Insurance from others     1%                  Insurance from others    5%

                 Not insured                   84%             Not insured          93%

22
Insurance and risk management
 Health, crop failure and death are the most popular risks covered through credit

                                              Borrow /           Biggest risk faced that affects finances (%)
                                             pawn goods
                                                                A big illness or health
    Health                                                             problem                           45
              22%                          39%
                                Coping                                 Harvest failure             23

      RISK                      strategy
                                                                   Death of or loss of
                                                                   income from main           10
   6%         12%                          29%                       income earner

  Death of
                                                                    Natural disasters     7
breadwinner      Crop
                failure                 Do nothing
                                                                  Loss/failure of your
                                                                       business           6
Insurance and risk management
     Adults are mainly uninsured due to a lack of insurance knowledge

                                                        Have not heard about it             39

             85% of adults are uninsured
                                                      Do not know how it works         20

            50% of adults are unaware of                         Do not need it    16
            insurance products –> low
            financial literacy/education

                                                    Have never thought about it    14

                                                                  Do not know     10

24
Remittances and mobile money:
     Overview of those who remitted in the past 12 months (%)
     Overall

                                 2018                                            2013

               Formal remittances         16                    Formal remittances        10

                          Banked     6                                     Banked     3

        Other formal (non-bank)          11                Other formal (non-bank)    7
                         Informal    2                                    Informal    5
                Friends and family   3
                                                                 Friends and family       10
                    Not remitting              79
                                                                     Not remitting             77

25
Remittances and mobile money:
     Overview of those who remitted in the past 12 months

        Remittance Strand (%)                                         More people are remitting in 2018

               2018       6         10       2 3                        69
 Informal to
   Formal

               2013   3       7     4        9                           77

                              Remittances through bank               Remittances through other formal (non-bank)
                              Remittances though informal channels   Remittances though family and friends
                              Do not remit

26
Mobile money:
     Although 2% of adults are registered growth of Mobile money is
     promising

                  4% of adults use Mobile Money                96% of adults do not use Mobile Money

             It is most convenient                72                          Do not need it              44

                                                          I do not have enough information
          Only service available in                                    about it
                                                                                                     16
                                          8
              my community
                                                              I can not use it - not educated        15
                  Cheapest / most
                                      6
                    affordable                               I do not have money to send or
                                                                                                    11
                                                                         receive
                           Trust it   5
                                                                           It is complicated        10

         Practical way to pay bills   4                Do not have a cell/mobile phone / sim
                                                                                                4
                                                                       card
                                                         There are no mobile money service
            To sell airtime / trade   3       %                                                 4
                                                                providers in my area                           %
                                                                 I have not thought about it    3

27
Linking financial inclusion and local
                context through the SDGs
28
Good health and well-being

                                               Coping mechanism                     Population that skipped
                                                                                    treatment as a result of poverty
                                    Borrowed money or
                                                                           15%
                                      pawned goods                    39
                                  Gift / help / assistance
                                        from others              16
                                                                                    Time taken to reach medical
                                  Used formal account –                             facility (Mean)
                                                                 14
              22%                        savings
                                   Sold something to get                   20 min   Urban
                                          money                  13
      Experienced health crisis                                            41 min   Rural
     requiring medical expenses      Cut down expenses       9

                                      Nothing I could do     7

29
Quality education
                                                                     Asset ladder vs. educational level

       6%          Population that had to forego
                   school as a result of poverty                                                13%       Comfort
                                                                                                                    71%
                                                                                                                          Financially
                                                                                                                          included
                                                                     Primary              72%         Average
     Vocational/Special Tertiary education                                                                                Financially
        ised training                              No formal                        15%         Basic
                                                                                                                    29%   excluded
                                                   education
            1%               8% 11%
                                                                                                31%      Comfort          Financially
                                                                                                                    70%   included
                                                                                          62%
                                                                     Secondary                        Average
                                                                                                                    30%   Financially
                                                                                     7%     Basic                         excluded

       Secondary    44%                      36%      Primary
                                                     education                                  67%                       Financially
       education                                                                                          Comfort   78%   included
                                                                                          33%
                                                                     Tertiary                         Average
                                                                                                                    22%
                                                                                                                          Financially
                                                                                                Basic                     excluded
                                                                                     0%

                                                                 One of the main drivers for savings and borrowing is education costs   13%

                                                                                      Portion of average monthly income that goes
                                                                          20%         towards education costs

30
Gender equality
                No       $0.01   $1.91   $6.66 <                           Main source of income – top 6
                income   -       -
                         $1.90   $6.65             52%           48%             Farming           8
                                                                                                                 31
     Total      25%      15%     37%     23%
                                                                        Self-employed –                 15
     Female     35%      15%     33%     17%
                                                                       unregistered sector             12
     Male       14%      15%     42%     29%             F   M
                                                                       Money from family                         31
                                                                         and friends                   11

                                                                                               5
     48% of women are dependents                                            Casual labour
                                                                                                   8

     19%      Banked                                                               Selling     8
                                                                                               7
        30%        Other formal (unbanked)
                                                                        Get money from                      18
             46%         Informal                                      household member        6

                                                                                      Female       Male

31
Sustainable cities and communities
                                               Housing Ownership                                           Excluded              Included       Total
     83% Metal sheets – main                                                                Water 63                                       66   65%
     roof material for house                             Other
     49% Bamboo –
     main wall material for
                                       Free-house 2%                                   Sanitation 72                                       74   74%
     house                     Rent the house    7%                                         Power 55                                       56   54%
     54% Wooden planks –                          4%
     main floor material for                                                                              (%)                          (%)
     house

                                                                                                   Time taken to destination: Minutes
                                                                                             Post office                     26                  70
                                                                                                   MFI                      24        43
                                                            87%                                    ATM                      23                          82
                                                                       Own the house              Bank                  23                       69

                               44% of those who own the                (alone/other     Medical facility               20             41
                               house have the title deed               HH member)        Mobile money                  18                       69
                                                                                          Market place                 18             42
                                     84% used savings to purchase/build the house                                  16                                   Urban
                                                                                       Public transport                          29
                                     About 1% used formal finance to acquire house                              8 11
                                                                                         Grocery store                                                  Rural

32
Decent work and economic growth

     Main income source

33
Summary:

    • More adults have formal financial access in 2018 largely driven by MFI and Cooperatives
      with most adults using formal services for borrowing, payments and savings
    • Low, but meaningful, adult uptake (2%) on mobile money with rising potential to expand
      financial services to rural, remote, and disparate households
    • Shifts within the broad formal services with more people saving with bank and transacting
      (payments)
    • Significant increase in rural uptake of formal services outside of banking mainly driven by
      credit and savings with MFIs and cooperatives showing a double increase in this category of
      formal financial products
    • Fewer adults dependent only on informal financial services in 2018, which are mainly used
      for living expenses, mitigating risk such as health expenses and meeting goals such as
      education and buying farming equipment
    • Formal financial services are mainly employed for livelihood investments, education and
                                      %
      living expenses. Informal financial services are primarily applied toward living expenses,
      coping strategies for unforeseen events (e.g. health issues) education, and livelihood
      investments
Thank you
You can also read