Q1 2021 results ESG leader with a sustainable dividend yield - 7 May 2021 - Aperam
←
→
Page content transcription
If your browser does not render page correctly, please read the page content below
Q1 2021 results

ESG leader with a
sustainable dividend yield

 7 May 2021
                        1
Disclaimer

  Forward-Looking Statements

  This document may contain forward-looking information and statements about Aperam SA and its subsidiaries.
  These statements include financial projections and estimates and their underlying assumptions, statements
  regarding plans, objectives and expectations with respect to future operations, products and services, and
  statements regarding future performance. Forward-looking statements may be identified by the words “believe,”
  “expect,” “anticipate,” “target” or similar expressions. Although Aperam’s management believes that the
  expectations reflected in such forward-looking statements are reasonable, investors and holders of Aperam’s
  securities are cautioned that forward-looking information and statements are subject to numerous risks and
  uncertainties, many of which are difficult to predict and generally beyond the control of Aperam, in particular, the
  length and severity of the COVID-19 (coronavirus) outbreak, including its impacts in the sector, macroeconomic
  conditions and in Aperam's principal local markets, that could cause actual results and developments to differ
  materially and adversely from those expressed in, or implied or projected by, the forward-looking information and
  statements. These risks and uncertainties include those discussed or identified in Aperam’s filings with the
  Luxembourg Stock Market Authority for the Financial Markets (Commission de Surveillance du Secteur Financier).
  The information is valid only at the time of release and Aperam does not assume any obligation to update or
  revise its forward-looking statements on the basis of new information, future events, subject to applicable
  regulation.

                                                                                                                         2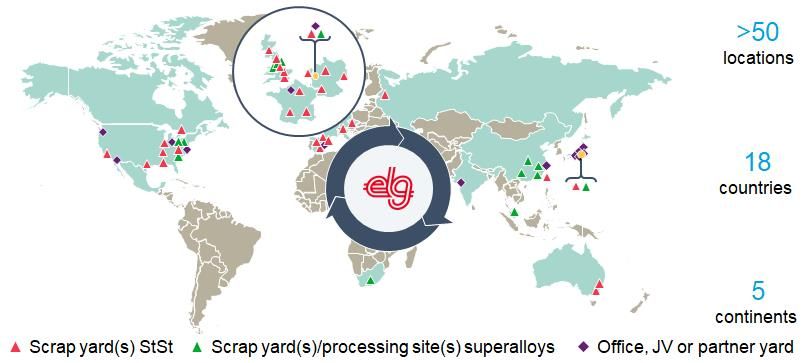
Q1 2021 Operational highlights
Economic & pricing recovery yields the best quarter in
Aperam‘s history
                                                  Q1 2021 key developments

                   Strong volumes and improved pricing in both Europe
                   and Brazil

                   Aperam to install 20,300 MWh of solar energy at Genk –
                   second largest photovoltaic installation in Belgium*

                   Leadership Journey© phase 4 started with EUR8m gains
                   in Q1 2021. New lines in Genk are ramping up and
                   produced first coils

                   EU: Registration & suggested anti dumping duties of CR
                   304 from Indonesia & India

                   Brazil: AD investigation for CR 304 against Indonesia
                   and South Africa has been launched

                 Our flexible business model and LJ improvements let us harness the recovery
*Expected to be operational by year end 2021
                                                                                               3
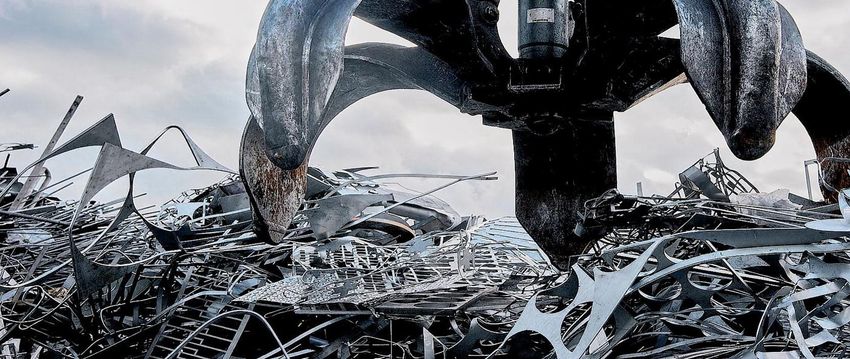
Acquisition of ELG
Aperam invests in profitable growth and the circular
economy
                                  A scrap pure play                            ELG’s global footprint

      ●      ELG Haniel GmbH (‘ELG’), Duisburg, Germany
      ●      Active in recycling, processing and trading of
             stainless steel and superalloys scrap globally
      ●      ~1,300 employees, 52 locations in 18 countries
      ●      Closing expected in H2 2021*

                                  Strategic rationale                           Financial rationale

    ●       Structural efficiency improvement of the circular   ●   EV EUR357m
            economy offers high economic rewards
                                                                ●   EUR24m synergies
    ●       Supports carbon neutrality
                                                                ●   Adj. EBITDA EUR55m Ø through the cycle
    ●       Considerable synergies
                                                                ●   EV/EBITDA 6.5x pre / 4.5x post synergies
    ●       Expansion into new geographies and industries           Clearly below recycling peers

                 Global recycling business opens significant growth & value opportunities for Aperam

*subject to regulatory approval
                                                                                                               4
Market update
The market environment improved substantially due to strong
demand and normalized imports
End markets continue to recover
• Production has normalized. Solid outlook with some impact of components shortage.
Automotive & Transport
Restocking eases
Consumer Goods • Demand is strong with a stable outlook
Construction • Recovery is visible but lag effects from 2020 project slowdown still burden
Food, Health & Catering • Normal demand in food & health. Catering is weak due to COVID effect on tourism & restaurants
Industry, Energy,
• Project pipeline remains weak but recovery has started
Chemical
Distributor inventory is seasonally normal Import market share in line with historic average
90,000 100
50.0%
85,000 90 400,000
80,000 40.0%
80 300,000
tonnes
75,000
70,000 200,000 30.0%
70
65,000
60 100,000 20.0%
60,000
55,000 50 0 10.0%
Q2 17
Q3 17
Q4 17
Q1 18
Q2 18
Q3 18
Q4 18
Q1 19
Q2 19
Q3 19
Q4 19
Q1 20
Q2 20
Q3 20
Q4 20
Q1 21
Q1-16
Q3-16
Q1-17
Q3-17
Q1-18
Q3-18
Q1-19
Q3-19
Q1-20
Q3-20
Q1-21
German distributors inventory (t) Days
Imports CR market share HR market share
Weak Below normal Normal Strong
5
Q1 2021 Segments
Brazil and S&S generate the best quarter ever. S&E Europe
normalizes and compensates for a temporary softer mix in A&S
          Stainless & Electrical Steel                                      Services & Solutions                              Alloys & Specialties

                                                                                                                               2,308
                                                                                          216
                            290
                                                                                                                                       1,714

                  206                                                                                                 989
                                         adj EBITDA*                                              adj EBITDA*                                   adj EBITDA*
                                         (EURm)                                 86                (EURm)                                        (EURm)
        124                 140                                       48                   45
                                         a dj EBITDA/t                                            a dj EBITDA/t                 15              a dj EBITDA/t
                                                                                                                                        12
                  89                     (€)                                                      (€)                  9                        (€)
         53                                                                     14
                                                                       9

      Q1 20      Q4 20     Q1 21                                    Q1 20      Q4 20      Q1 21                       Q1 20    Q4 20   Q1 21

• Shipments increased 12% qoq, 13%                            • Shipments increased by 28% qoq and                • Shipments increase by 8% qoq but
  yoy due to recovery in Europe.                                by 12% yoy                                          decline by 23% yoy
  Comparable shipments in Brazil
                                                              • QoQ higher adj EBITDA mainly reflects             • QoQ: lower adj. EBITDA was driven by
• QoQ: Europe adj EBITDA reflects                               better volumes, better pricing and a                a price/cost squeeze and lower
  higher volumes better pricing and                             higher inventory valuation gain                     inventory valuation gains
  inventory valuation gains. Brazil
                                                              • YoY: higher adj EBITDA due to higher              • YoY: higher adj EBITDA was driven by
  generated the best quarter ever due to
                                                                volumes, better pricing and inventory               the absence of COVID related costs
  higher prices and a better mix
                                                                valuation gains                                     included Q1 2020 and inventory
• YoY: adj EBITDA improves due to                                                                                   valuation gains that compensated
  higher volumes, better prices and                                                                                 lower volumes
  inventory valuation gains

                          Adj. EBITDA of EUR355/t in Q1 2020 (+ EUR102/t qoq , +EUR195/t yoy)
* Difference with total Aperam’s quarterly adj EBITDA due to Others & Eliminations line
                                                                                                                                                                6
Q1 2021 Financial highlights
Aperam‘s flexible business model is well adaptad to capture
opportunities in this upturn
Strong earnings, positive FCF and strong balance sheet Q1 key comments
• Shipments increase due strong
demand in Europe and Brazil
EURm Q1 21 Q4 20 qoq Q1 20 yoy
• Adj EBITDA at all time high as
Sales 1,177 916 28% 1,049 12% pricing recovers in Europe, Brazil
adj. EBITDA 175 109 61% 70 150% generates best quarter ever and
inventory valuation adds a low-to-
EBITDA 175 159 10% 70 150% mid double digit gain
Basic EPS (EUR) 1.45 1.26 15% 0.36 303% • Positive financial result due to FX
Steel shipments (000t) 493 431 14% 438 13% and derivative gains. Net interest
expense was –EUR3m
adj EBITDA/tonne (EUR) 355 253 40% 160 122%
• EPS increased due to higher adj.
adj EBITDA margin 14.9% 11.9% 25% 6.7% 123% EBITDA and a normalized tax rate
Operating cash flow 106 106 0% 63 68% • Strong operating CF despite raw
material price & volume driven
CAPEX -46 -19 142% -45 2% working capital build
Free cash flow* 58 88 -34% 18 222% • Solid FCF despite above run rate
Dividends paid -35 -35 0% -32 9% capex due to LJ4 more than covers
the dividend. Near debt free balance
Net financial debt 56 67 -16% 108 -48% sheet with 0.1x NFD/EBITDA
Leadership Journey improvements become fully
XXX visible in a normalizing market environment
7Leadership Journey® Phase 4 (2021-2023)
A mix of cost improvements and growth to
defend Aperam’s cost leadership in Europe
Phase 4 target gains Target savings composition Cash out
160 45
Σ EUR150m Σ EUR90m
Leadership Journey gains (EURm)
Leadership Journey gains (EURm)
140 Growth & 40
Sche- product portfolio Sche-
120 35
matic matic
100 30
Raw material &
purchasing 25
80
Sche- 20
60 matic Sche-
Fixed costs 15
40 matic
10 Sche-
Sche
20 5 matic
matic Variable costs
0 0
2021 2022 2023 2021 2022 2023
Q1 Q2 Q3 Q4 Q1 Q2 Q3 Q4
Footprint Europe Structural cost cuts Growth Brazil
Gueugnon development Purchasing & sourcing gains Top line strategy & distribution NGO upgrade
towards specialties Automation & centralization growth HGO mix improvement
CR center reduction to 3 Ramp up of Genk CRM Gueugnon transformation
Site specialisation increases frees capacity for growth in
FTE reductions
load of most efficient lines value added & specialty
products
A more efficient and lower cost footprint opens up growth opportunities
8Outlook
Q2 2021 guidance & other forward looking items
Q2 2021 outlook:
• Q2 2021 shipments are expected at a comparable level qoq
• Adj. EBITDA is expected at a higher level versus the record Q1 2021 base
– Higher underlying result due to a seasonally stronger quarter in both Europe and Brazil
– Lower inventory valuation gains
• Net financial debt is expected at a slightly lower level despite temporarily higher working
capital
Other items:
• FY 2021 group capex ~EUR130m (incl. Leadership Journey© phase 4)
• FY 2021 P&L effective tax rate expected at ~20% of which ~ half will be cash tax in CF
• FY 2021 dividend EUR1.75 (amounts to EUR140 million)
• Leadership Journey© Phase 4: EUR150 million savings target by end of 2023
We expect the positive environment to persists in Q2 2021
* Subject to the approval of the AGM
9Corporate Access
Post Q1 2021 schedule
• 18 May Global Metals, Mining & Steel conference Bank of America
• 19 May Global Metals, Mining & Steel conference Bank of America
• 26 May The Nice Conference Societe Generale
• 7 Jun European Materials Conference J.P. Morgan Cazenove
• 16 Jun MS Cannonball Run Morgan Stanley
• 28 Jun Investor calls Exane
• 29 Jun Investor calls Exane
We are looking forward to intensifying the dialogue with you
10Q&A
Q&A
11You can also read