Presentation Slides Citi ASEAN Investor Conference 2013 - Friday, 7 June 2013
←
→
Page content transcription
If your browser does not render page correctly, please read the page content below
Presentation Slides
Citi ASEAN Investor Conference 2013
                                 Friday, 7 June 2013
2
About Us
Multi-modal transport service provider, offering rail, bus,
and taxi services, which are key to Singapore’s public
FY2013 Revenue
transport system.
2%
3% 8%
Largest rail operator in Singapore (about 78% market
share), operating 2 of existing 3 lines (NSEWL and CCL), with
1.9m average daily ridership. 2nd largest bus operator (about
12%
25%) market share with average daily ridership of 918,200.
Stable & Growing Non-fare business: 1) manages about 55%
35,000 sqm of retail space within train network with 98%
occupancy rate; 2) 3rd largest taxi operator with fleet of 20%
more than 3,300 taxis.
Approximately S$2.2 billion market cap, listed on the Rail Bus Taxi Advertising Rental Eng & Others
Singapore Exchange Main Board on 26 July 2000. Temasek
Holdings is single largest investor with 54.2% stake.
3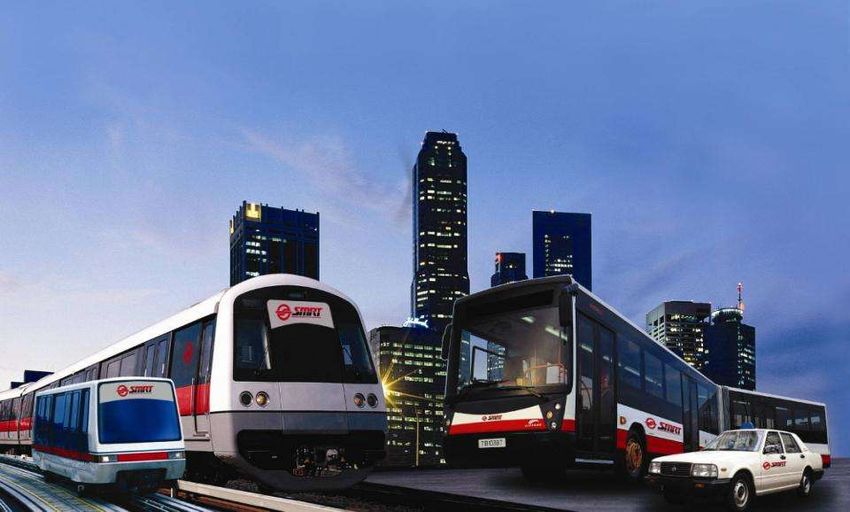
Fare Business – At A Glance

• Dominant rail operator in Singapore with 25 years of O&M
  experience since 1987
• Operates the North-South East-West Line and Circle Line
  with 78 stations and total route length of 128.6km
• Commands about 78% market share with average daily
  ridership of 1.9 million

 •Operates first LRT system at Bukit Panjang since 1999
 •Network comprises 7.8km of elevated guide ways
 linking 14 stations in Bukit Panjang
 •Average daily ridership of 53,200

                                                                 North-South East-West Line
•Owns about 1,050 buses running 94 basic bus services
 between Western and North-Western areas and the rest             Circle Line
 of Singapore
•About 25% market share based on average daily ridership         North-East Line
 of 918,200

                                                             4                                4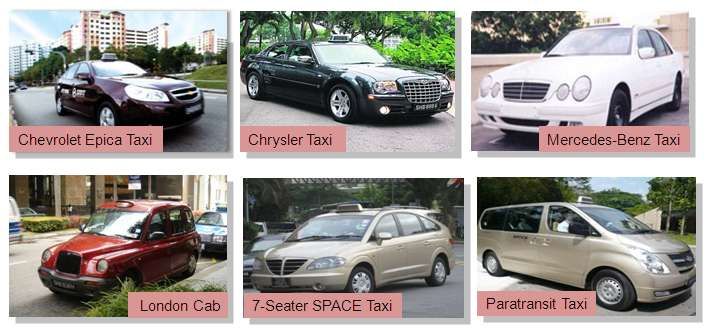
Continued Ridership Growth

(‘million)
                                                                                                                                                              (‘000)
 800.0                                                                                                                                                    6,000
                                                                                                                      5,184         5,312
                                                                                    4,988             5,077
 700.0                                                             4,839
                                                  4,589                                                                                                   5,000
                                 4,401
                4,266
 600.0
                                                                                                                                                          4,000
 500.0

                                                                                                                                                                       Total Rail Ridership
 400.0                                                                                                                                                    3,000
                                                                                                                                              690.9                    Total Bus Ridership
                                                                                                                                  654.4
 300.0                                                                                                              603.9                                              Population
                                                                                  510.2            536.6                                                  2,000
                                                434.9            469.3
 200.0       402.6            413.8
                                                                                                                         311.2        326.4       335.1
                  268.7            265.3            270.3            277.3            288.0             290.8                                             1,000
 100.0

     -                                                                                                                                                    -
               FY2005           FY2006           FY2007           FY2008           FY2009             FY2010         FY2011        FY2012      FY2013

                                                                   Financial Crisis                                   CCL
             Punggol
               LRT                                                                Boon Lay                         Dist Fare
                                                                                    Ext.

             *7 year CAGR , includes Singapore citizens, PR, and non-citizens . Information obtained from Statistics Singapore.

                                                                                                  5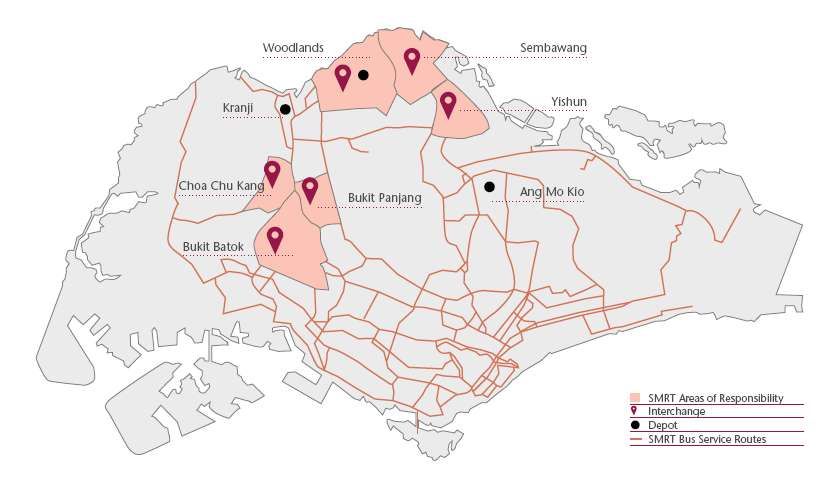
Rail Opportunities
New Lines
Eastern Region Line – 2020
Thomson Line – 2021
Jurong Region Line – 2025
Cross Island Line – 2030
Line Extension
Marina bay Extension – 2014
Tuas West Extension – 2016
Circle Line Stage 6 – 2025
Source: LTA website
6 6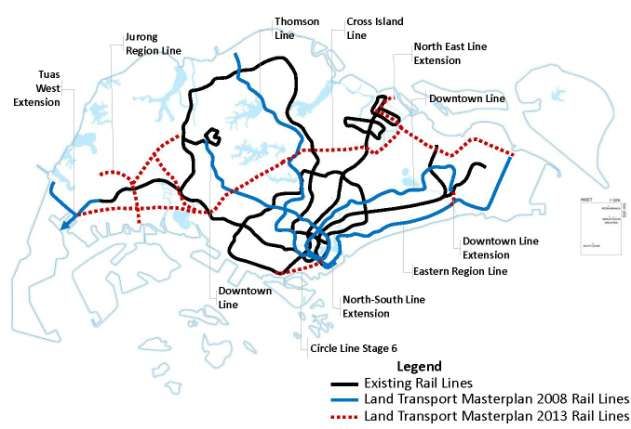
Bus Business
New Eco-friendly MAN A22 Buses
97 Public Bus Services
Fleet Expansion - 954 buses in FY2010 to
more than 1,100 buses
45 chartered bus services SMRT Buses operates 6 bus interchanges, 3 depots and 2 bus terminals.
More than 50 buses and mini-buses
BSOL agreement
10 year license due in Sept 2016
Bus routes to operate are awarded as part of license
PTOs have to comply with QoS standards – Reliability; Loading; Availability; Safety
Fare formula similar to trains
Upgrading more than 300 articulated buses over
the next five years.
7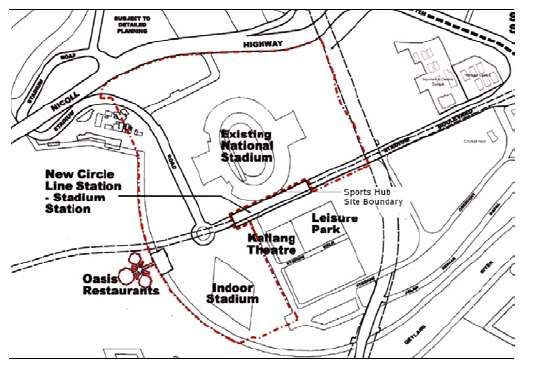
Non-Fare Business - At A Glance
           •   Manages and leases a fleet of more than 3,300 taxis, with more than 95% average hired-out
               rate
           •   Third largest taxi operator; continue to renew & expand taxi fleet

RENTAL
           •   Leases approximately 35,000sqm of commercial space within the train network
           •   More than 720 shop units with 98% occupancy rate
           •   Refurbished a total of 46 stations (78 stations in network) since FY2005

           •   Provides advertising spaces on trains, buses, taxis and stations
           •   Leverage on growing riderships and interactive media platforms to attract advertisers – e.g
               iViewSMRT, iMobSMRT etc.

           •   Pursuing overseas land transport opportunities
           •   Pursuit of opportunities relating to O&M, engineering, consultancy and project
               management services.

                                             8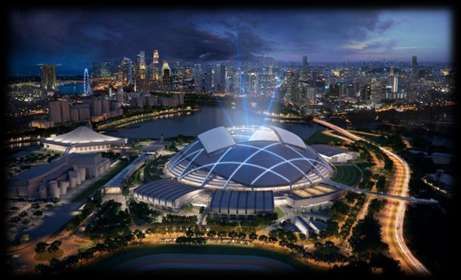
Taxi Business
Taxi Fleet
Comfort & Citycab 16,449
Trans-cab 4,610
SMRT 3,395
Premier 2,261
Prime 804
Smart 404
Individual Yellow-Top 322
Total 28,245
Source: LTA Diverse Fleet
From August 2012, Taxis will be removed from the bidding system and pay the Prevailing Quota Premium (PQP) of
Category A (1,600cc and below), which gives us greater clarity of COE prices. The PQP refers to the average premium price
for the past 6 months.
TOL agreement
LTA has given in-principle approval to renew SMRT’s 10-year Taxi TSOL from 2013
License fee payable is based on 0.1% of revenue derived from taxi operations
Current QOS based on Taxi Availability, Safety, Customer Satisfaction
9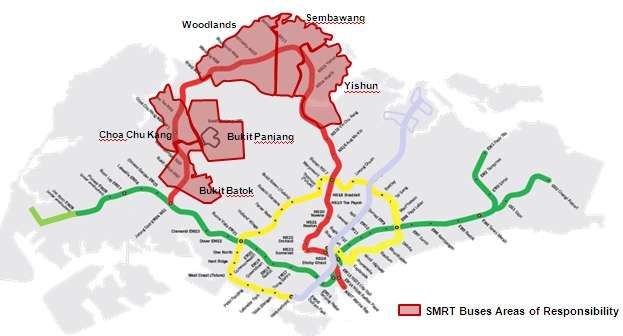
Growing Rental & Advertising
        The completion of Woodlands Xchange in FY2014 will add about 1,700sqm to the network

 $m               Launch of                           Launch of Esplande      Launch of Orchard
100.0            3 Xchanges                                Xchange          Xchange & Jurong East
                                                                                  Xchange
 90.0

 80.0                                                                                                   88.4
                                                                                   81.5
 70.0
                                                             73.6
 60.0                                        65.0                                                       67.0
                                                                                   63.0
 50.0                          57.5                          57.0
                                             50.8
 40.0                          46.5
         42.0
 30.0
         30.9
 20.0

 10.0

  0.0
        FY2008                FY2009       FY2010          FY2011                 FY2012               FY2013
                     Rental Revenue    Rental EBIT    Advertising Revenue           Advertising EBIT

                                                     10
Singapore Sportshub
Landmark project to expand retail management expertise beyond network
Fully integrated sports, entertainment and lifestyle hub, situated beside Doorstep of Stadium Station (Circle Line) and is also served by Kallang
National Stadium (East West Line), Dakota and Mounbatten (Circle Line).
70:30 Joint Venture between SMRT and NTUC to lease and operate 41,000 sqm of commercial retail
space at Sportshub
12-year contract from the opening of Sportshub in early 2014; earnings accretive in FY2015
Leveraging on SMRT’s retail management and transport network expertise
11Financial Highlights
Revenue & Profit Trend
Revenue vs PAT (S$m)

 1200.0                  18.5                             18.2                                                               20
                                                                                 16.6                                        18
 1000.0
                                                                                                                             16
                                                                                                    13.4
                                                                                                                             14
  800.0
                                                                                                               1,119.5       12
  600.0                                                                                                                      10
                                                                                                1,057.2            7.4
                                                                              969.7                                          8
                 879.0                              895.1
  400.0
                                                                                                                             6
                                                                                                                             4
  200.0
                                                                                                                             2
                             162.7                           162.9                    161.1           119.91         83.22
    0.0                                                                                                                      0
                        2009                             2010                    2011              2012           2013

                                                               Group Revenue           PAT    PAT Margin
          1 Includes   Bus goodwill impairment of S$21.7m (2012)
          2 Includes   impairment of interest in associate of $17.3m (2013)

                                                                                      13
Operating Expenses
S$m
1100 717.0 741.0 794.4 930.6 1,045.6
1000
204.5
900
188.0 17.3
800
21.7 165.5
700 161.1
139.2
144.1 166.4
600 6.6 112.5
122.4
104.1
500 118.8 84.8
79.2 78.0 150.6
400 66.3 129.6
117.1 119.3
110.4
300
200 395.2
294.8 313.6 340.1
277.4
100
0
FY2009 FY2010 FY2011 FY2012 FY2013
Staff Cost Depreciation net R&M Energy Impairment OOE
Amoritisation
14Fare/Non-Fare Performance
Revenue(S$m) EBIT(S$m)
1,119.5
1200 1,057.2
250.0
148.71 110.22
187.1 162.9 195.7
894.9 969.5
879.0
1000 276.8 200.0
256.7
219.9
800 188.2 205.8 77.5
150.0 61.6 84.3
600 90.7
100.0
400 800.4 842.4 93.7
690.7 689.1 749.6
125.5 127.4 111.4
50.0
200 79.1
33.3
0 0.0
2009 2010 2011 2012 2013 2009 2010 2011 2012 2013
Fare Non Fare Fare Non Fare
1 Includes Bus goodwill impairment of S$21.7m (2012)
2 Includes impairment of interest in associate of $17.3m (2013)
15Sound Financial Position
Cashflow from Operations Healthy Balance Sheet
As at 31 March 2012
400
Net Debt: $$63.2m
300
200 Net Gearing: 8%
S$’m
326.6 283.3 282.1
100 260.2
Debt/EBIDTA: 2.2X
0
FY2010 FY2011 FY2012 FY2013
Capital Expenditure Plans Secured Financing
FY12: S$496.1m ‘AAA’ rating affirmation by S&P in Sept 2012
FY13: S$266.1m Raised S$450 million bonds at record low rates
for Singapore dollar bond issue (5-year S$350
FY14: Approximately $500m million 1.2%, 10-year S$100 million 2.363%)
16Going Forward
Government Initiatives
New Land Transport Master plan 2013
Fare Formula revision
New Rail Financing Framework
Bus Sustainability Measures
18Beyond COI Recommendation
1 Fleet renewal
RELIABILITY Evolve maintenance
1 2 regime
& AVAILABILITY
3 Facilities expansion
1 Re-sleepering
2 SAFETY 2 Rail cracks and Detection
mechanism
1 Resignalling
3 CAPACITY 2 Passenger comfort
3
4 Retrofitting of trains
Stations upgrade
19Outlook
Group’s profitability will be impacted near-term by cost pressure in fare
business. Long-term prospect remains positive as SMRT will benefit from
Government’s push for public transport with rising ridership, supported by
increased train capacity and better network connectivity
Ongoing discussion with the government on sustainable models for Trains
and Buses will address issues on capex and operating cost pressure.
Expand commercial revenue stream by continuing to refurbish commercial
spaces and improve yield in our existing network, and diversify our media
and advertising platforms. Capitalise on commercial opportunities beyond
existing rail network, such as Sportshub, which will double retail space
under management to approximately 76,000 sqm.
20Disclaimer
The statements or information in this presentation which are not of historical fact may constitute “forward looking
statements” relating to future business and financial performance and future events or developments involving SMRT. These
statements may be identified by words such as "expects," "looks forward to," "anticipates," "intends," "plans," "believes,"
"seeks," "estimates," "will," "project" or words of similar meaning. These forward looking statements are based on
management's current views, expectations and assumptions including, but not limited to, prevailing or future economic and
market conditions, and are therefore subject to known and unknown risks, uncertainties and other factors that may cause any
future results, performance, achievements or events that may be expressed or implied by such forward looking statements,
or anticipated on the basis of historical trends, to differ materially from such forward looking statements.
Therefore, we advise you not to place reliance on these forward looking statements in making any investment decisions. In
particular, such forward looking statements are not, and should not be construed as a representation, forecast or projection of
the future performance of SMRT. SMRT neither intends, nor assumes any obligation, to update or revise these forward
looking statements in light of developments which differ from those anticipated.
For enquiries from analysts/investors, please contact:
Roger Ng; Investor Relations
Tel: (65) 6331 1211 Fax: (65) 6334 1407
Email: ngroger@smrt.com.sg
Visit http://www.smrt.com.sg/investors/investors.asp for media releases, announcements and presentationsYou can also read