Transformer Condition Monitoring Technology Based on Surface Acoustic Wave Passive Wireless Sensing Antenna
←
→
Page content transcription
If your browser does not render page correctly, please read the page content below
E3S Web of Conferences 257, 01085 (2021)                                                             https://doi.org/10.1051/e3sconf/202125701085
AESEE 2021

         Transformer Condition Monitoring Technology Based on Surface
         Acoustic Wave Passive Wireless Sensing Antenna
         Zhenwei E1,*, Dong Fu1, Zhengzhi Yu1, Yaqing Hu1 and Yu Nie2
         1   State Grid Fushun Electric Power Supply Company, State Grid Liaoning Electric Power Supply Co., Ltd. 113008 Fushun, China
         2 State   Grid Liaoning Electric Power Supply Co., Ltd., 110004 Shenyang, China

                        Abstract. As the infrastructure for people's production and life, the stable operation of power facilities is
                        very important. As a key equipment in the operation of power facilities, transformers have become
                        important power equipment for the daily maintenance of the power sector. In the past, electric power
                        operation and maintenance personnel mostly used on-site visual inspection to preliminarily judge whether
                        the transformer is operating normally. The disadvantage of this method is inaccuracy. A transformer
                        condition monitoring technology based on a surface acoustic wave passive wireless intelligent sensing
                        system is proposed to overcome the above shortcomings. Its working mechanism is to monitor the oil level,
                        oil temperature and external ambient temperature of the cooling oil in the transformer in real time. Then, the
                        operating status can be determined. The operating data is transmitted to the control center through the 4G
                        network to help the operation and maintenance personnel to centrally monitor the status of the transformer,
                        and then provide a pre-alarm function for abnormal conditions of the transformer.

      1 Introduction                                                          detection: Active wireless temperature measurement
                                                                              schemes now generally use batteries or current
      With the development of the economy, the load has                       transformers (CT) to supply power to the temperature
      increased and transformer failures have occurred more                   measurement chip, and the sensing distance is very long.
      and more frequently, which causes great troubles to the                 However, in harsh environments such as high
      production and life of enterprises and residents. Since                 temperature and strong electromagnetic fields, there are
      the transformer is directly connected to the load, the load             problems with the life of batteries and electronic
      imbalance problem cannot be solved, which causes the                    components. The active sensor that adopts the CT
      rise of the zero sequence current, the heating of the iron              power-taking method, because the CT power-taking coil
      core, and the excessive oil temperature [1]. At the same                has installation location requirements, it can not supply
      time, the geographical distribution of distribution                     power even in the state of line failure, and its application
      transformers is very scattered, and it is difficult to find             also has great limitations. Optical fiber temperature
      problems such as temperature rise, oil temperature rise,                measurement is a wired temperature measurement
      and low insulating oil level in a timely manner by                      method, and the optical fiber or its sheath on the primary
      relying on current inspection methods.                                  side of the high voltage measurement has a problem of
          Therefore, it is necessary to transform the                         insulation to the ground. At the same time, the optical
      distribution transformer. This paper establishes a                      fiber has the characteristics of being easy to break and
      comprehensive online transformer status monitoring                      break, and the cost of optical fiber sensor equipment is
      technology integrating load analysis, transformer low-                  relatively high, which is not suitable for application in
      voltage outlet temperature, transformer oil temperature                 complex and scattered distribution networks.
      and oil level.                                                              The battery wireless sensor realizes the wireless
          Transformer equipment monitoring technology is                      function by adding a battery to the traditional sensor,
      widely studied by scholars, such as, infrared temperature               which is the simplest to achieve, but the battery needs to
      measurement, active wireless temperature measurement,                   be replaced after a certain period of time [6]. The battery
      and distributed optical fiber temperature measurement.                  is also sensitive to temperature, therefore, the
      Infrared temperature measurement is currently one of the                performance of the low temperature battery decreases.
      most widely used temperature measurement methods for                        The wireless sensor of power-taking technology
      electric power [2]. It is suitable for live testing of the              generally uses a current induction coil to obtain energy
      surface temperature and point temperature of the                        through electromagnetic induction in a fixed ratio, and it
      equipment within the visible range, but its test results are            is no longer necessary to replace the battery for long-
      greatly affected by environmental conditions and are                    term work. However, it must have a closed circuit, so
      suitable for inspections and inspections [3-5]. On-line                 there are certain installation requirements during

         *
             Corresponding author: 124358916@qq.com
© The Authors, published by EDP Sciences. This is an open access article distributed under the terms of the Creative Commons Attribution License 4.0
(http://creativecommons.org/licenses/by/4.0/).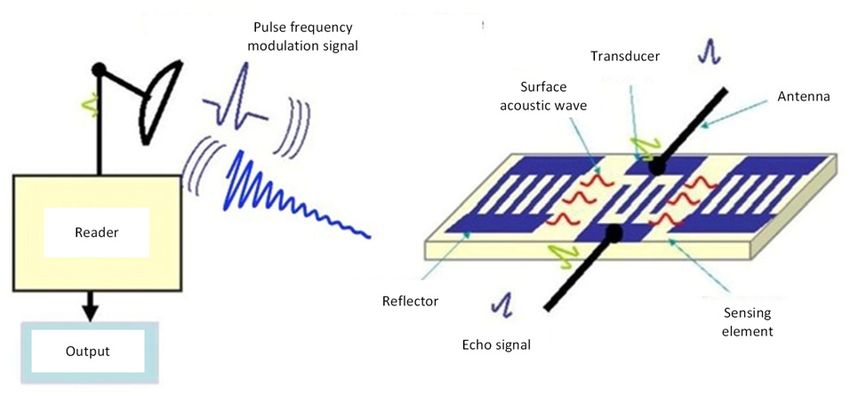
E3S Web of Conferences 257, 01085 (2021) https://doi.org/10.1051/e3sconf/202125701085
AESEE 2021
installation [7]. It must be surrounded by the joint. The The frequency-temperature characteristics of the
installation volume is generally large. At the same time, single-port SAWR used for temperature sensing
the closed circuit is prone to eddy current heating under characterize the tendency of the natural frequency of
high current, which becomes a safety hazard. Moreover, SAWR to change with temperature. Through the analysis
the low-voltage load generally changes greatly, and the of the frequency-temperature characteristics of the
repeated large-scale changes of the current will also resonator, information such as the sensitivity and
cause an impact on the power-taking device and occupied bandwidth of the SAW temperature sensor can
accelerate the damage. be obtained, so as to guide the design of the reader and
The passive wireless temperature measurement determine some reader design indicators.
device based on surface acoustic wave technology uses When a narrow-band pulse signal is used to excite
piezoelectric technology to realize the intrinsically SAWR, the echo signal obtained is an attenuated and
passive and natural wireless of the sensor without the oscillating sinusoidal signal. The energy and duration of
need for batteries or power-taking devices. The sensor the signal are related to the quality factor (Q value) of
can be installed to the low pressure joint by simple bolt the sensor. Only when the excitation frequency is the
fastening. The performance and life of the sensor are not same as the SAWR resonance frequency, the echo
affected by temperature and load current. At the same energy reaches the maximum and the duration is the
time, the sensor is intrinsically safe for the equipment. longest. When there is a certain gap between the
Even in the worst case, if the sensor is damaged, it will excitation frequency and the natural frequency of the
not affect the normal operation of the primary equipment. resonator, the energy and duration will be reduced
accordingly.
2 The principle of surface acoustic
wave wireless passive temperature 3 Antenna system design
measurement technology
3.1 Antenna plan development
Since the oil level gauge itself is made of metal, and the
antenna system requires a certain metal clearance area or
adopts a metal-resistant design scheme, the maximum
performance of the antenna can be exerted. Due to the
limitation of actual conditions, there is not enough
headroom area around the antenna, and the operating
frequency of the system is 433MHz. From Equation 1,
the wavelength is about 0.697m. According to antenna
theory, when there are metal objects around the antenna,
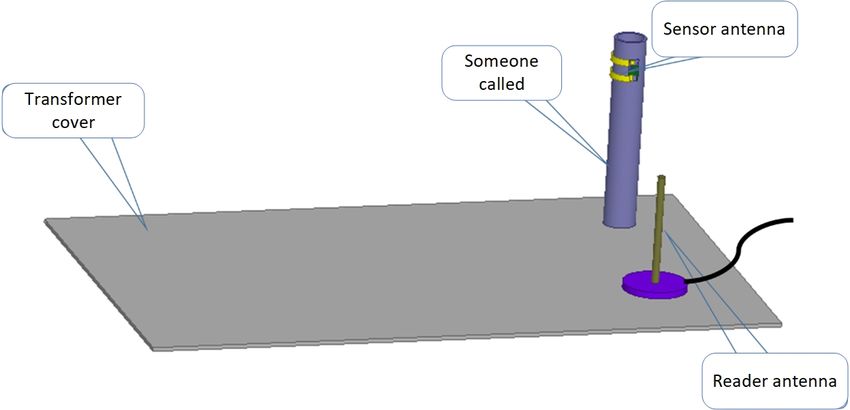
Figure 1 Schematic diagram of wireless sensing system the performance of the antenna will be greatly affected.
interference. Therefore, when designing the sensor
In the surface acoustic wave resonator (SAWR) wireless
antenna of this monitoring system, it is necessary to
sensor system shown in Figure 1, the reader transmits
focus on the balance between antenna performance and
narrowband electromagnetic waves through the reader
operating distance.
antenna. The electromagnetic waves are received by the
sensor antenna and excite a single-port SAWR made by c/ f (1)
piezoelectric technology. Through the inverse where is the wavelength, c is the speed of light, and
piezoelectric effect, the interdigital transducer (IDT) f is the operating frequency.
converts the electromagnetic wave received by the
This system needs to detect three parameters, namely
sensor antenna into a narrow-band surface acoustic wave.
oil temperature, oil level and ambient temperature. Two
The actual resonant frequency of a single-port SAWR is
sets of temperature sensor subsystems need to be
determined by the structure of the resonant cavity and
assembled, which are divided into oil temperature sensor
the environmental impact of the substrate (such as
subsystem and ambient temperature and oil level sensor
temperature, strain, etc.). When the excitation disappears,
subsystem. The two sensors use frequency division.
the surface acoustic waves of each frequency component
Technology to ensure that there will be no serious co-
in the band will freely decay and oscillate with different
channel interference between the two. Emphasize on the
time constants. Only the electromagnetic wave with the
working principle of the ambient temperature oil level
same frequency as the SAWR natural resonant frequency
sensor subsystem: through a special antenna circuit
lasts the longest. IDT uses the piezoelectric effect to
design, when the monitoring system is working normally,
convert the surface acoustic waves into electromagnetic
the ambient temperature data is transmitted back to the
waves and radiate them from the antenna. The reader
system, which is regarded as normal oil level. When the
estimates the natural resonance frequency of SAWR
oil level is lower than a certain value. The antenna
after receiving the attenuated oscillating electromagnetic
circuit is disconnected and the ambient temperature data
wave affected by temperature, and then wireless
disappears, which is regarded as abnormal oil level. The
temperature measurement can be realized.
antenna parts of the two sets of sensor subsystems have
certain differences in appearance, but the requirements
2
E3S Web of Conferences 257, 01085 (2021) https://doi.org/10.1051/e3sconf/202125701085
AESEE 2021
of working principle, simulation target and measured and impedance can be obtained. When the width W of
performance are the same. the short-circuit metal sheet is equal to the width L1 of
Considering the characteristics of easy disassembly
and installation, low wind resistance, anti-aging, long W
the radiating metal sheet, that is, when 1 , there is
life, and waterproof of actual field installation, the reader L1
antenna of the monitoring system adopts a magnetic
copper rod antenna scheme. The reader antenna is firmly H L2 (2)
attracted to the transformer cover through a strong 4
magnet, and kept at a distance of 30~50cm from the oil c
fr (3)
level gauge under the premise of maintaining a certain
safety interval. The reader antenna is an omnidirectional
4 H L2
monopole antenna, and the antenna radiator is a slender When the width of the short-circuit metal sheet W=0,
cylindrical metal copper rod (diameter 12mm, length there are:
170mm), which has excellent low wind resistance,
waterproof and anti-aging properties. The reader antenna H L1 L2 (4)
is shown in Figure 2. The reader antenna is connected to
4
the reader through the feeder. c
fr (5)
4 H L1 L2
In the formula, represents the resonance
wavelength, f r represents the resonance frequency, and
c represents the speed of light.
For short-circuit metal sheets of any width W, the
resonant frequency can be calculated by the following
formula:
f r r k f1 1 r k f 2 (6)
where
w L c c
r , k 1 , f1 , f2 .
L1 L2 4 H L2 4 H L1 L2
4 Analysis of simulation results
Figure 2 Reader antenna
Based on equations (2), (3), (4) and (5), the antenna
3.2 The basic theory of Planar Inverted-F model is established in the HFSS software, and the
Antenna setting of the antenna size model parameters refers to the
initial simulation parameters calculated according to the
The basic structure of Planar Inverted-F Antenna (PIFA) formula. in Figure 4 and Figure 5. The antenna size
includes four parts: ground plane, radiating element, model parameter setting the initial simulation parameters
short-circuit metal sheet and coaxial feeder. Its typical are selected. After multiple rounds of simulation and
basic structure is shown in Figure 3. parameter optimization, when the short-circuit metal
sheet width W 1.5mm , the radiation metal sheet width
L1 10mm , the length L2 112mm , and the height
H 5mm , the simulation results are ideal. It can be
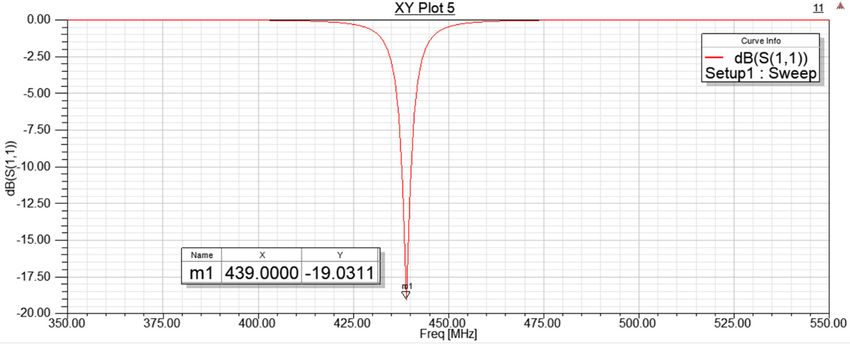
seen from Figure 6 and Figure 7 that when the operating
frequency is 439MHz, the S parameter S11 19dB and
the gain Gain 9.4dB , the performance effect meets
the predetermined target value.
Figure 3 Typical structure of PIFA antenna
According to the PIFA antenna theory, the metal
sheet width L1 , length L2 , short-circuit metal sheet
width W , and radiating sheet height H shown in Figure
3 are closely related to the resonant frequency of the
antenna. By adjusting the dimensions of L1 , L2 , H ,
and W , an antenna that works in any frequency band Figure 4 Software simulation model
3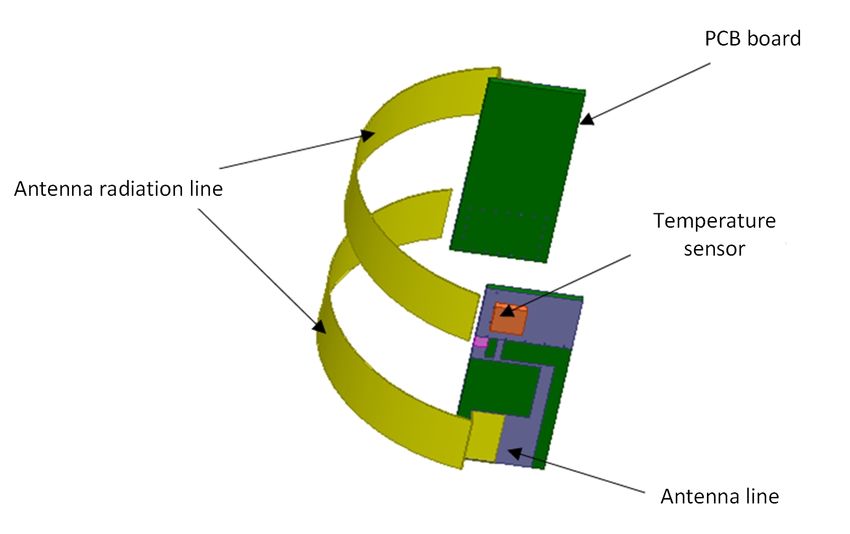
E3S Web of Conferences 257, 01085 (2021) https://doi.org/10.1051/e3sconf/202125701085
AESEE 2021
References
1. G Wang, Y Liu, X Chen, et al. Power transformer
fault diagnosis system based on Internet of
Things[J]. EURASIP Journal on Wireless
Communications and Networking, 2021, 2021(1).
2. C Bengtsson. Status and trends in transformer
monitoring[J]. IEEE Transactions on Power
Delivery, 1996, 11(3): pp.1379-1384.
Q Sun, W Qian, W Nan. Design of Distribution
Transformer Monitoring System Based on
LPC2103[J]. Journal of Convergence Information
Figure 5 Simulation model of sensor antenna Technology, 2012, 7(21): pp.120-126.
3. D Peharda, I Ivankovi , N Jaman . Using Data from
SCADA for Centralized Transformer Monitoring
Applications[J]. Procedia Engineering, 2017, 202:
pp.65-75.
4. A Raghavan, P Kiesel, M Tee Pe, et al. Low-cost
embedded optical sensing systems for distribution
transformer monitoring[J]. IEEE Transactions on
Power Delivery, 2020, 99: pp.1-1.
5. V. Catterso, S. Mcarthur, G. Moss. Online
Conditional Anomaly Detection in Multivariate
Data for Transformer Monitoring[J]. IEEE
Figure 6 S parameter of sensor antenna Transactions on Power Delivery, 2010, 25(4):
pp.2556-2564.
6. B. Garcia, J. Burgos, A. Alonso, et al. A moisture-
in-oil model for power transformer monitoring - Part
II: Experimental verification[J]. IEEE Transactions
on Power Delivery, 2005, 20(2): pp.1423-1429.
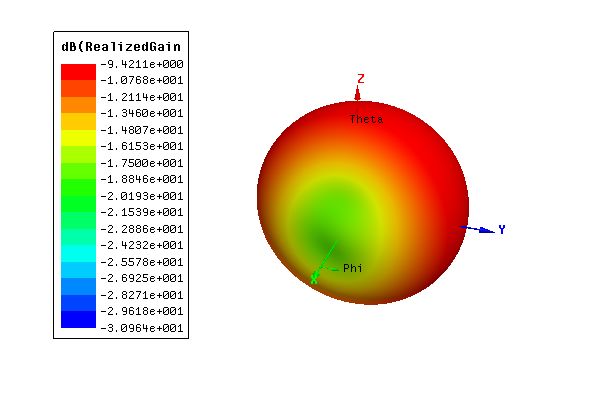
Figure 7 Sensor antenna gain
At the same time, some regular experience is
summarized in the simulation analysis, for example, the
increase of the height H can increase the gain value and
reduce the resonance frequency. The increase in the
width W of the short-circuit metal sheet increases the
resonance frequency.
5 Conclusion
In this paper, research and application of online
monitoring technology for distribution transformers are
carried out. The passive and wireless sensing scheme of
surface acoustic wave technology was adopted to realize
the online monitoring and early warning of the operation
status of distribution transformers. The reliable operation
of the transformer is ensured.
4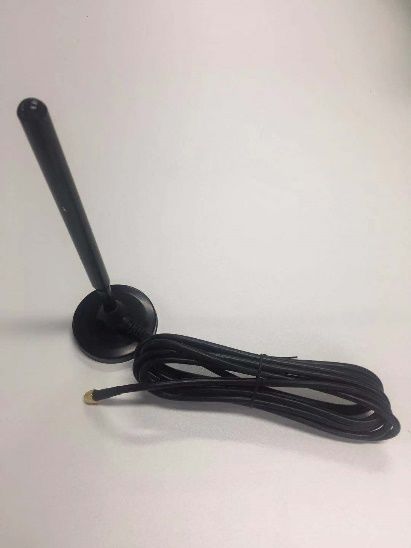
You can also read