SCALING CHEF AUTOMATE - BEYOND 50,000 NODES
←
→
Page content transcription
If your browser does not render page correctly, please read the page content below
SCALING CHEF
AUTOMATE
BEYOND 50,000 NODES

                      Published January, 2018
Chef Automate is a continuous automation platform supporting capabilities
to build, deploy, manage, and collaborate across all aspects of software
production. It is designed to help organizations deliver software faster, manage
risk, and assure software security and stability. Visibility features in the platform
provide a powerful way to gain insight into infrastructure, applications, and
compliance, providing teams a single location to access customized views and
reporting.
Automation is essential at scale, and as the managed environment grows,
visibility across all nodes is critical to maintaining compliance and enabling fast,
problem-free software delivery. Chef software is in production in some of the
world’s largest, most demanding environments. This paper describes proven
approaches for scaling Chef Automate visibility features to large scales by
detailing the architecture & hardware planning and performance tuning needed
to run the system smoothly.
ARCHITECTURE
AUTOMATE SERVER
COMPONENTS
A good way to think about the Chef Automate
server is as a collection of microservices
components underpinned by open source software
including Elasticsearch, Logstash, RabbitMQ, Chef
and the Linux kernel.
It’s important to understand the performance
characteristics, monitoring and troubleshooting
of these components. Especially Postgres,
Elasticsearch, RabbitMQ, Runit and Linux systems
in general.
SCALING CHEF AUTOMATE : BEYOND 50,000 NODES | page 2In the visibility features in Chef Automate, data flows from a service called “data collector” in
Nginx to Elasticsearch as shown in the diagram above. These services are the “critical path”
for your Chef data and must be monitored and tuned in order to alleviate data processing
bottlenecks.
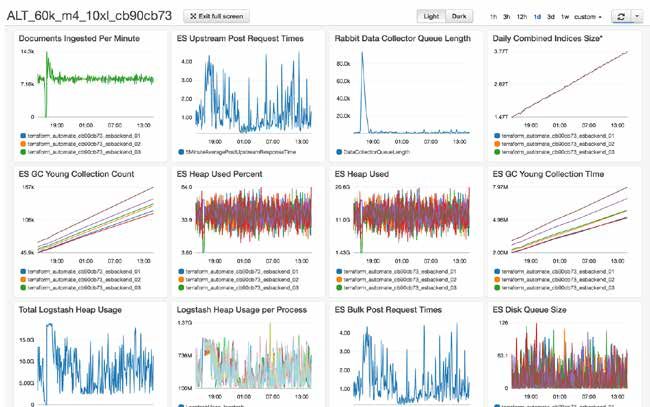
MONITORING
Excellent metrics are fundamental to making architecture or tuning changes - those are not
only real-time metrics, but historical trends and the ability to correlate various metrics. It’s
important to remember that the architecture and sizing recommendations below are a starting
point, but real-life results will vary based on a myriad of factors. Data-driven decisionmaking
based on reliable metrics and trends will enable you to increase performance while decreasing
costs.
At Chef, we’re big fans of Open Source monitoring solutions such as Sensu, Graphite, the Elastic
stack and the Influx Data Platform; these are the tools we use to monitor our own software
when we run it in production.
SCALING CHEF AUTOMATE : BEYOND 50,000 NODES | page 3We encourage you to make your own metrics collection decisions, but these are the most
important metrics we’ve found to measure when evaluating the effectiveness of your Chef
Automate system:
•• API Request and Error rates - Chef Automate is composed of a number of microservices-
style applications. As such the various services communicate with each other via HTTP
REST calls. As load begins to climb, it is most important to measure and graph the HTTP
response codes (200 OK, 400 error, 500 error), response times (in milliseconds) and error
rates over time.
•• RabbitMQ queue length - Chef Automate uses RabbitMQ to queue messages for
processing by Logstash. A healthy system should have completely (or almost) empty
queues. Queueing is a sign that your users are not immediately seeing their Chef
Automate dashboards being updated due to the processing speed of Logstash or
the ingestion rate of Elasticsearch. Beyond that, RabbitMQ performance significantly
degrades when there is a large amount of data queued.
•• Elasticsearch Post time - The amount of time it takes for Elasticsearch to ingest the data
is measured by the POST time to the _bulk API endpoint - as shown in this nginx log (/var/
log/delivery/nginx/es_proxy.access.log). POST times above a few seconds may indicate
that Elasticsearch is suffering from insufficient disk speed, Java tunings, or CPU/memory
constraints. In this example the POST time is 0.867 seconds.
127.0.0.1 - - [13/Jul/2017:20:53:22 +0000] "POST /elasticsearch//_bulk HTTP/1.1"
200 "0.867" 372 "-" "Manticore 0.6.0" "10.42.11.75:9200" "200" "0.867" "-" "-"
"-" "-" "-" 9176440
•• Java VM (JVM) Metrics - Two of the critical data processing services (Logstash and
Elasticsearch) are Java based and tuned by default for smaller systems. The most
important metric to watch is the amount of time the JVM spends paused due to “stop the
world” garbage collection (GC) events. If this value becomes a significant amount of time
(1% or higher) it indicates that the JVM Heap size is too small (frequent GC events) or too
large (infrequent but very slow GC events).
•• System disk latency - the creators of Elasticsearch recommend using Flash or Flash-
accelerated local disk storage for optimum performance. The use of magnetic and
network based storage incur additional latency as measurable by disk latency (average
time it takes to service a request) and disk queue length (the number of IOs waiting to be
serviced). Significant spikes in latency or disk queue length can impact many of the above
metrics.
SCALING CHEF AUTOMATE : BEYOND 50,000 NODES | page 4•• System disk utilization - A full disk can cause significant problems for data storage
systems used by Chef Automate: Elasticsearch, RabbitMQ and PostgreSQL. If disks are not
monitored, situations can arise including significant downtime, data corruption and data
loss.
•• System CPU utilization - number of cores, processor “steal time” indicating contention on
VM systems.
ARCHITECTURE/COST CONSIDERATIONS
Chef’s recommended architectures below are based on a number of observations we’ve seen
during customer deployments and internal testing. You may opt to decrease your hardware
requirements by adjusting some of these site-wide parameters, or increase your data
granularity which will increase the hardware requirements.
CHEF CONVERGE INTERVAL & OVERALL CHEF CLIENT RUNS PER
MINUTE
Although the total number of nodes is an important measure, the data processing speeds
of Chef Automate will be primarily determined by the rate of Chef Client Runs per Minute
(CCR/m). This also includes InSpec if configured to do so (see section on Compliance data
below). The CCR/m rate can be greatly impacted by adjusting the Chef client’s converge
interval (how frequently does Chef run) and the Splay (level of randomization so that all chef
clients don’t run at the exact same second).
Our calculations below are based on a 60 minute converge interval and a 59 minute splay - in
order to maximally smooth the server load. Cutting either your converge interval or splay in
half will double the server load and processing requirements. From a calculation standpoint, it
is simplest to say that 5,000 nodes at a 30 minute converge interval are equivalent to 10,000
nodes at a 60 minute interval.
DATA RETENTION PERIOD
Chef Automate allows users to control the retention period of its data. Our calculations are
based on a 90-day retention period, as this is a common value in regulatory documents.
Customers may choose to increase the retention period (thus increasing storage requirements)
or decrease it. A simple calculation is that a doubling of the data retention period will double
the size amount of data stored.
SCALING CHEF AUTOMATE : BEYOND 50,000 NODES | page 5For more information on controlling Automate’s data retention, see: https://docs.chef.io/data_
retention_chef_automate.html
COMPLIANCE DATA
The audit cookbook is used to collect Compliance (InSpec) data during the Chef client run.
When the audit cookbook is used, significantly more data is sent to Chef Automate’s data-
collector service ( +33-50% ) which in turn has a significant impact on data processing speeds in
Logstash and data storage requirements in Elasticsearch.
SIZE OF NODE OHAI DATA (PASSWD PLUGIN)
Every chef client runs Ohai, a tool for collecting system data. In Enterprise environments the
Ohai data can become quite large, particularly if central authentication systems are used
such as Microsoft Active Directory, Centrify or LDAP. In those cases Ohai’s “passwd” plugin
will collect the user entries from every single user in the central authentication system, which
adds significant amounts of data to each node object. All of this data must then be processed
by Logstash and Elasticsearch, so at large scales the savings of even a few KB from the node
object can have a significant impact on data processing speeds and data size.
For more information in disabling ohai plugins or restricting their data from being sent to Chef
Automate, see: https://docs.chef.io/ohai.html#ohai-settings-in-client-rb
SYSTEM ARCHITECTURE RECOMMENDATIONS
ASSUMPTIONS
•• 60 minute Chef client converge interval with a 59 minute splay:
₀₀ It’s important to note that if you choose to do a more frequent converge interval
(say 30 minutes instead of 60) then you must double the node count in the
calculation.
•• 90-day data retention period.
₀₀ The data storage requirement scales up and down proportionately if you wish to
increase or decrease the retention period
SCALING CHEF AUTOMATE : BEYOND 50,000 NODES | page 6HARDWARE PLANNING
Elasticsearch is a big data platform that automatically distributes the data storage and
processing workload across all cluster members using sharding. It also automatically provides
redundancy for all data stored (with replica shards), allowing customers to optimize their
storage solutions for speed rather than redundancy. By the default settings, an Elasticsearch
cluster can lose one cluster member without losing any data.
Storage
Elastic strongly recommends the use of Flash or SSD storage that is local to the machine
running it (not NAS or SAN). In cloud environments, we’ve found the best performance from
machine types with local SSD storage ( AWS I3 or D2, Azure Ls series) however the SSD-based
network storage options (AWS provisioned-IOPS EBS and Azure Premium Storage) provided
acceptable latency in our tests but allowed much larger volume sizes.
In on-prem VM environments, we recommend using direct-attached SSD arrays or SAN systems
that can provide guaranteed bandwidth reserved for Elasticsearch. For larger data sets, physical
machines optimized for big data workloads may be more economical. The storage must be able
to handle at least 1000 sustained IOPs per Elasticsearch node with an average latency of 2ms
or less.
For storage space, the largest amount of data we observed stored was 40 MB per client
node per day (split among the Elasticsearch servers). This grows linearly, to illustrate with an
example:
•• To retain 90 days of data for one node, you need 3.6 GB of storage space
•• In a 3-node Elasticsearch cluster, each cluster member will store 1.2 GB (1/3rd of the data)
CPU
On the Chef Automate server, the primary consumer of CPU resources is Logstash. Provide 1
CPU core (or vCPU) for each Logstash process. A tuned Logstash process can ingest data from
4000 chef clients (converging hourly) on an Intel Xeon E5-2666 v3.
SCALING CHEF AUTOMATE : BEYOND 50,000 NODES | page 7Memory
On the Chef Automate server, the primary consumer of memory is Logstash. Provide enough
memory so that each Logstash process has 2 GB of memory, multiplied by the number of
Logstash processes you run.
Elasticsearch utilizes the Linux kernel’s Page Cache (aka Buffer Cache) to cache frequently
accessed data in memory. Elastic recommends 64 GB RAM for larger installations, 32GB for
medium and 16GB for smaller installations. Elasticsearch should never be provided more than a
30 GB Java Heap.
Network
Elasticsearch documentation states: Avoid clusters that span multiple data centers, even if the
data centers are colocated in close proximity. Definitely avoid clusters that span large geographic
distances.
Gigabit Ethernet is okay for most installations, until the data ingest rate begins to reach 400
Mbps ( 50 MB/s ). At that point all systems including the Automate server should be upgraded
to 10GbE NICs.
SCALING CHEF AUTOMATE : BEYOND 50,000 NODES | page 8SERVER SIZING:
Based on a 60-minute converge interval and 90 day data retention period
Automate Elasticsearch Elasticsearch
Automate Logstash
CCR/ Server Elasticsearch Server Storage
NODES Storage Process
MIN (CPU, RAM, Server Count (CPU, RAM, AWS (GB of SSD
(GB of SSD) Count
AWS type) type) each)
4 CPU, 16
500 8.3 2,100 1 0 N/A N/A
GB, m4.xl
16 CPU, 64
5,000 83 21,000 2 0 N/A N/A
GB, m4.4xl
8 CPU, 32 8 CPU, 32 GB,
10,000 166 600 4 3 12,000
GB, m4.2xl m4.2xl
8 CPU, 32 8 CPU, 32 GB,
15,000 250 900 6 3 18,000
GB, m4.2xl m4.2xl
16 CPU, 64 16 CPU, 64 GB,
25,000 416 1,500 8 3 30,000
GB, m4.4xl m4.4xl
32 CPU, 128 16 CPU, 64 GB,
60,000 1000 3,600 30 6 36,000
GB, m4.10xl m4.4xl
PERFORMANCE TUNING
The following performance tuning settings are required in order to achieve the desired
throughput rates on the recommended hardware.
ELASTICSEARCH
Minimum Master Nodes
Elasticsearch recommends that you set minimum_master_nodes to (ClusterSize/2)+1 this
ensures that you never end up with a split brain scenario where different nodes end up with a
different view of the world. For our recommended cluster sizes this is 2 for 3 node clusters and
4 for 6 node clusters.
SCALING CHEF AUTOMATE : BEYOND 50,000 NODES | page 9Set it like so in your /etc/elasticsearch/elasticsearch.yml before starting your cluster.
discovery.zen.minimum_master_nodes: 2
If you need to change this on a live cluster, for example if you expand from 3 to 6 elasticsearch
cluster nodes. You can set it with curl on any node in your cluster. Once set on a single node the
setting will apply to all.
cat > /tmp/elastic-settings.json
{
"persistent" : {
"discovery.zen.minimum_master_nodes" : 4
}
}
curl -XPUT http://`hostname`:9200/_cluster/settings -d @/tmp/elastic-settings.
json
JVM settings
Configure Elasticsearch’s JVM heap size to be approximately 25% of the total system RAM
(Elasticsearch uses off-heap caching for data).
If you are using the Chef Backend package to provide Elasticsearch services to your Chef
Automate cluster, set the following in your /etc/chef-backend/chef-backend.rb file:
elasticsearch.heap_size = 4096
File handles
Elasticsearch’s performance may be limited by the maximum number of file descriptors it can
open. This is typically set by the limits.conf configuration file in Linux and tested using the
`ulimit -n` command. To adjust this setting, see the documentation for your operating system.
For more information, see: https://www.elastic.co/guide/en/elasticsearch/guide/current/_
file_descriptors_and_mmap.html
Shard Count
Elasticsearch uses sharding to evenly distribute the data across the data nodes - this allows
you to scale both storage and performance by adding more Elasticsearch nodes to your
cluster!
SCALING CHEF AUTOMATE : BEYOND 50,000 NODES | page 10The default shard count for Elasticsearch is 5, which is optimal for 5 data nodes. In most cases,
you want to adjust the shard count to equal the number of nodes in your Elasticsearch cluster -
up to 9 nodes.
Adjusting this value is safe at any time as it will only impact newly created daily indices. Run the
following command on your automate server.
curl -XPUT http://localhost:8080/elasticsearch/_template/index_defaults -d
'{"template": "*", "settings": { "number_of_shards": 3}}'
Indexing throttle
Elasticsearch will throttle indexing while segments are merging. By default this is set very
conservatively. We set this to 100MB which is Elastic’s recommend value for SSD storage:
cat > /tmp/elastic-settings.json
{
"persistent" : {
"indices.store.throttle.max_bytes_per_sec" : "100mb"
}
}
curl -XPUT http://`hostname`:9200/_cluster/settings -d @/tmp/elastic-settings.
json
LOGSTASH SETTINGS
Limits Tuning
The larger Chef Automate clusters spawn a significant number of threads for Logstash, Rabbit
and the Delivery erland process.. The nproc limit for the delivery user should be lifted.
/etc/security/limits.conf
delivery soft nproc unlimited
delivery hard nproc unlimited
delivery soft nofile unlimited
delivery hard nofile unlimited
SCALING CHEF AUTOMATE : BEYOND 50,000 NODES | page 11JVM settings, Worker threads and Batch Size
In order to make the Logstash process more efficient, it needs sufficient JVM heap and also
an increase in the number of worker threads. To implement, add the following to the /etc/
delivery/delivery.rb file:
logstash['heap_size'] = "2g"
logstash['config'] = {
"pipeline" => {
"batch" => {
"size" => 40
},
"workers" => 16
}
}
And then run `automate-ctl reconfigure`.
Number of logstash processes
The version of logstash that currently ships with Chef Automate is version 2.3 which has
limitations that prevent it from effectively using more than a single CPU core. If Logstash is
regularly consuming a CPU core but the RabbitMQ queue size is growing, then we recommend
launching additional logstash worker processes like so:
curl -LO http://bit.ly/automate-logstash-config-v2
sudo bash automate-logstash-config --total-procs 4
RABBITMQ
Chef Automate uses RabbitMQ to temporarily queue messages for processing by the Data
Collector - this allows the system to gracefully handle spikes of load. However, if the queue
is not monitored and data processing fails, the queue can grow until it fills all of your server’s
storage space.
To prevent that, we recommend capping the queue at a fixed number of items as a safety
net, but allowing the system some leeway to handle data processing lag. We have observed
SCALING CHEF AUTOMATE : BEYOND 50,000 NODES | page 12RabbitMQ to significantly degrade to the point of unresponsiveness at around 100,000 objects
in queue.
# Example: The following will cap the queue at 100,000 items
$ export PATH=/opt/delivery/embedded/bin:$PATH
$ rabbitmqctl set_policy -p /insights max_length '(data-collector)' '{"max-
length":100000}' --apply-to queues
LINUX SERVERS
Modern Linux/kernel
Linux kernels developed in recent years have shown significant speed, scaling and efficiency
improvements - particularly in Cloud and VM environments. As such we strongly recommend
using RHEL 7 (CentOS/OEL/variants acceptable) or Ubuntu 16.04 OSes. In cloud environments
like AWS, we have observed stock Ubuntu 16.04 to be significantly more performant than stock
RHEL/CentOS 7 images, although with performance tuning they can be made equivalent.
SELinux (RHEL)
On RHEL-based systems we have observed up to a 20% performance penalty in IO and process
intensive services when SELinux is enabled. We recommend disabling it, or else increasing
hardware to compensate.
# to immediately disable selinux
setenforce 0
# To make the change persist through reboots
sed -i 's/SELINUX=enforcing/SELINUX=permissive/g' /etc/selinux/config
RHEL boot-time kernel tuning:
In order to take advantage of modern Flash devices, the following changes must be made on
RHEL-based systems (they are the default on Ubuntu 16.04).
•• Enable Multi-queue I/O scheduling for SCSI
•• Set the “noop” disk I/O scheduler
•• Disable Transparent Huge Pages
SCALING CHEF AUTOMATE : BEYOND 50,000 NODES | page 13Adjust the following line in your GRUB configuration file, /etc/default/grub:
(changes bolded for emphasis)
GRUB_CMDLINE_LINUX="console=ttyS0,115200n8 console=tty0 net.ifnames=0
biosdevname=0 crashkernel=auto scsi_mod.use_blk_mq=Y elevator=noop transparent_
hugepage=never"
Linux kernel VM tuning
The following settings are recommended by the Chef Automate development team to increase
system responsiveness under load (reboot required):
cat > /etc/sysctl.d/chef-highperf.confIt is worth noting that AWS EBS volumes are limited to 16TB in size, and other storage solutions
may also present per-volume limits. In those cases we recommend building a RAID-0 stripe set
of multiple volumes before formatting with LVM+XFS, like so:
http://docs.aws.amazon.com/AWSEC2/latest/UserGuide/raid-config.html
WANT TO LEARN MORE?
Chef offered a training course at ChefConf 2017 called “Chef Automate Up & Running”. In
case you missed it, we’re currently developing a private version of this training that should be
available soon! You can find all Chef Training offerings at training.chef.io.
CONTRIBUTORS:
Irving Popovetsky, Principal Customer Architect
Joshua Hudson, Customer Engineer
Thomas Cate, Customer Engineer
Yvonne Lam, Software Development Engineer
SCALING CHEF AUTOMATE : BEYOND 50,000 NODES | page 15You can also read