A finite element analysis (FEA) approach to simulate the coefficient of friction of a brake system starting from material friction characterization
←
→
Page content transcription
If your browser does not render page correctly, please read the page content below
Friction 9(1): 191–200 (2021)                                                                                ISSN 2223-7690
https://doi.org/10.1007/s40544-020-0397-9                                                                    CN 10-1237/TH
RESEARCH ARTICLE

A finite element analysis (FEA) approach to simulate the
coefficient of friction of a brake system starting from material
friction characterization
Gabriele RIVA1,*, Francesco VARRIALE1, Jens WAHLSTRÖM2,3
1
    Brembo S.p.A., Stezzano (BG), Stezzano (BG) 24040, Italy
2
    KTH Royal Institute of Technology, Stockholm 11428, Sweden
3
    Department of Mechanical Engineering, Lund University, Lund 22100, Sweden
Received: 28 February 2020 / Revised: 23 March 2020 / Accepted: 10 April 2020
© The author(s) 2020.

Abstract: The coefficient of friction (COF) is one of the most important parameters to evaluate the performance
of a brake system. To design proper brake systems, it is important to know the COF when estimating the
brake force and resulting torque. It is challenging to simulate the COF since friction in disc brakes is a
complex phenomenon that depends on several parameters such as sliding velocity, contact pressure, materials,
and temperatures, etc. There is a lack of studies found in the literature focusing on simulation of the COF for a
full brake system based on tribometer material characterization. The aim of this work is therefore to investigate
the possibility to use a finite element analysis (FEA) approach combined with a COF pv-map to compute the
global COF of a disc brake system. The local COF is determined from a pv-map for each local sliding velocity
and contact pressure determined by the FEA. Knowing the local COF, the braking force of the entire brake
system and the global COF can be evaluated. Results obtained by the simulation are compared with dyno bench
test of the same brake system to investigate the validity of the simulation approach. Results show that the
simulation is perfectly in line with the experimental measurements in terms of in-stop COF development, but
slightly higher with a positive offset for every braking.

Keywords: disc brakes; friction coefficient; simulation; brake performance; pin-on-disc

1      Introduction                                                 is mainly given by the rotating disc rate, while the
                                                                    local pressure conditions are mainly given by how the
The coefficient of friction (COF) is one of the main                pads are put in contact with the disc and it could be
parameter determining a brake system performance.                   influenced by the entire calliper and the disc. Therefore,
A brake system is generally composed by a calliper,                 different brake systems can produce different COF
one or more pistons, two pads, and a rotating disc.                 with the same disc and pads materials. This difference
When the pressure is applied, the pistons are pushed                in friction conditions brings to different performance
by the fluid and they push the pads against the disc,               which have to be evaluated before the brake system
generating the braking force. The braking force is                  is produced. Since it is difficult, in general, studying
strongly dependent of the COF, which is, in turn,                   the contact during braking [8, 9] and in particular im-
strongly affected by the contact situation in terms                 possible to evaluate it experimentally before having the
of local contact pressure and sliding velocity at the               components produced, a simulation tool able to predict
pads-to-disc interface [1–7]. The local sliding velocity            it could have a key role in the brake industries.

* Corresponding author: Gabriele RIVA, E-mail: Gabriele_Riva@brembo.it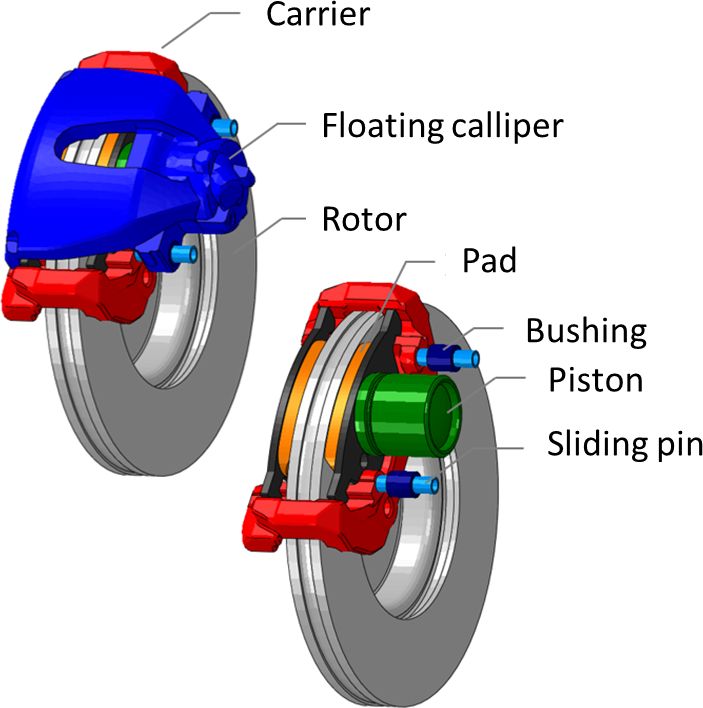
192                                                                                           Friction 9(1): 191–200 (2021)

   To simulate brake systems from a macroscopic point               different brake systems and the results show a good
of view, different finite element analyses (FEAs) have              representation of the experiments in terms of COF.
been done by several authors. The contact pressure at               In this model every parameter has to be calibrated
the pads-to-disc contact interface has been studied and             according to the experimental test. Nobody, known to
compared with tests by Abukabar and Ouyangb [10]                    the authors, considered a characterisation of the local
focussing its influence on the wear and brake squeal.               COF dependency on the local contact pressure and
Han et al. [11] also considered temperature effects                 sliding velocity typical of a specific couple pad–disc.
performing a thermo-mechanical analysis to study the                This characterization results in a friction map of the
influence of contact pressure on wear and they used the             COF as a function of contact pressure and sliding
analysis inside an optimization loop to design the pad              velocity. Knowing the material characterization, these
shape in order to have a more uniform contact pressure              data are used to simulate the braking force of the
distribution. The influence of the contact pressure                 whole brake system, aiming to study the brake system
                                                                    performance during the very early design phase. Also,
distribution on the wear has been also studied by
                                                                    this kind of FEA approach could be used to simulate
Söderberg et al. [12] and Valota et al. [13]. They used a
                                                                    friction phenomena, such as in-stop increase of COF
FEA to compute the pressure distribution on the pad
                                                                    and in-stop semi-local temperature rise which can be
and then, knowing the disc rotation rate, applied a
                                                                    responsible of some negative phenomena as fading of
generalization of the Archard’s wear law [14] to com-
                                                                    friction material.
pute the pad wear. Wahlström et al. [15] used a similar
                                                                       The aim of this work, therefore, is to develop a FEA
approach to investigate the wear particles emission
                                                                    to compute the local contact pressure. Knowing the
from disc brakes, considering the friction coefficient
                                                                    contact pressure and the sliding velocity from the disc
independent by contact pressure and sliding velocity.
                                                                    rotation rate, it is possible to compute the COF and the
Wahlström et al. [16, 17] worked on this approach to
                                                                    resulting braking torque using a COF pv-map based on
study friction, wear, and emission from the sliding                 pin-on-disc tribometer (POD) tests [5]. The simulated
contact between disc and pads. This work included the               COF is compared with experimental results obtained
friction dependence by the contact pressure at the                  by a dyno bench test [18] to validate the simulation
pad-to-disc interface. Riva et al. [18] extended the                approach.
approach to include the local pressure and velocity
dependency on wear and emissions. They used a FEA
to compute the local contact pressure and developed a               2 Simulation methodology
subroutine to take into account the local pressure and              An overview of the proposed simulation methodology
velocity conditions in the wear and emissions computa-              is presented in Fig. 1. First (box-1), pre-process
tion. In the previous mention studies on macroscopic                operations consist in choosing the brake system and
size-scale, the COF is seen as independent on contact               driving cycle conditions. Thereafter (box-2), tribometer
pressure and sliding velocity. There are some studies in            tests are run in order to get the local COF dependence
which the COF is modelled as a function of pressure,                on the nominal contact pressure and sliding velocity.
velocity, and/or temperature [19]. In particular, Oster-            The results of the tribometer tests are then used as
meyer [20] developed a two-equations dynamic model                  input data to a FEA (box-3) to simulate the global
in which contact pressure, sliding velocity, and tem-               COF of the brake system. Inertia dynamometer tests
perature are taken into account. Into the model five                (box-4) are run with the chosen brake system and
constant parameter are taken into account to distinguish            driving cycle. Box-4 can be performed in parallel with
different chemical compositions of the friction materials           box-2 and box-3. Finally, the results from the FEA and
and need to be set through experimental tests. Recently,            dynamometer tests are compared in the post-processing
Ricciardi et al. [21] developed a three-equations semi-             operations (box-5). The activities of the methodology
empirical model based on the work of Ostermeyer.                    are explained more in detail in the following sub-
The model is parametrized and tested for three                      sections.

                                | https://mc03.manuscriptcentral.com/friction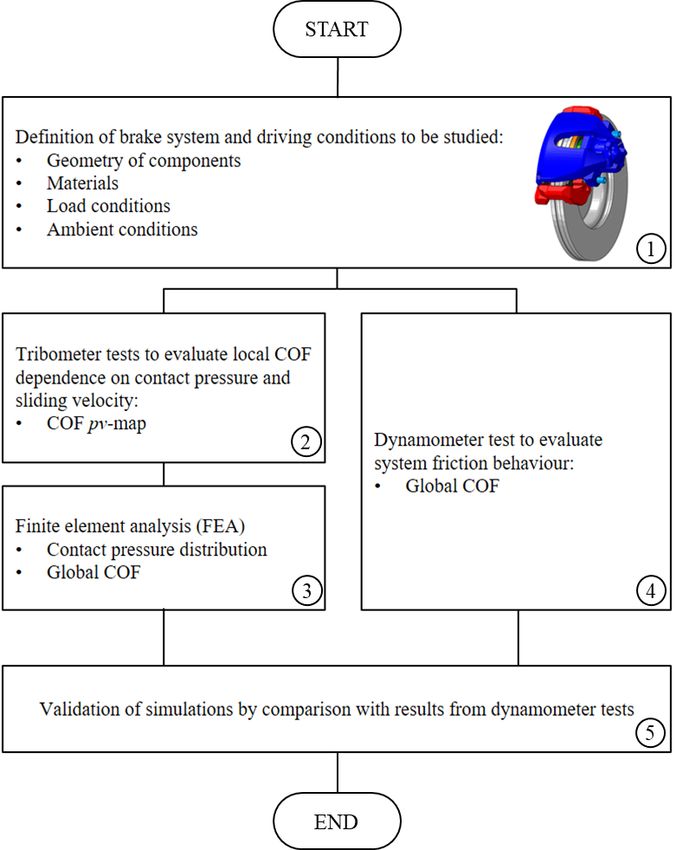
Friction 9(1): 191–200 (2021) 193
Table 1 Sliding velocities and contact pressures tested with
POD.
Velocity (m/s) Pressure (MPa) COF
2 0.59 0.48
2 1.14 0.50
1 1.14 0.50
2 0.31 0.52
1 0.59 0.57
4 0.59 0.54
1 0.31 0.58
3 0.31 0.43
3 0.59 0.46
3 0.86 0.50
obtained by dividing the tangential by the normal
force
FT
POD (1)
FN
Every test has been repeated three times and the mean
value after running-in between the tests has been
Fig. 1 An overview of the simulation methodology. considered. The friction map obtained is shown in
Fig. 2.
2.1 Pin-on-disc tribometer
2.2 Disc brake system
The materials considered in the simulation and used
in the dyno bench test were tested by Wahlström et al. The studied brake system is used in a typical
[5] using a POD at different sliding velocities (v) and C-segment car. The brake system considered is made
nominal contact pressures (p) values to obtain a COF by a grey cast iron rotor and a floating calliper.
pv-map. This map is used by the FEA to have the local The floating calliper consists in two pads with steel
COFs. The pin-on-disc experiments are described backplates and friction material, a piston, a calliper
below.
The components from a real brake system were used
to manufacture the pins and discs. The pin samples
were made from low-metallic pads and the disc samples
were made from a grey cast iron disc [22]. The pin is
cylindrical with a diameter of 10 mm while the disc
has a diameter of 60 mm. The nominal contact pressures
and sliding velocities tested are summarized in Table 1.
All the tests are conducted for two hours to ensure
the steady condition has been reached. The COF value
in Table 1 corresponds to the one measured when the
steady condition is reached. The normal force (FN) is
applied using weights and the nominal contact pressure
Fig. 2 Nominal contact pressure (p) and sliding velocity (v) map
is then computed dividing this normal force by the of the friction coefficient. The p and v used in the pin-on-disc
pin area. The tangential force (FT) is measured using tribometer are marked with circles. The pv-values are represented
a load cell (HBM® Z6FC3/10kg). The COF (μPOD) is with dashed isolines.
http://friction.tsinghuajournals.com ∣www.Springer.com/journal/40544 | Friction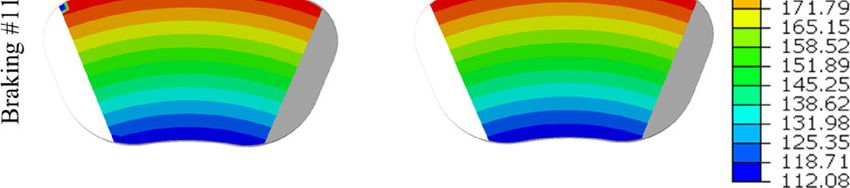
194 Friction 9(1): 191–200 (2021)
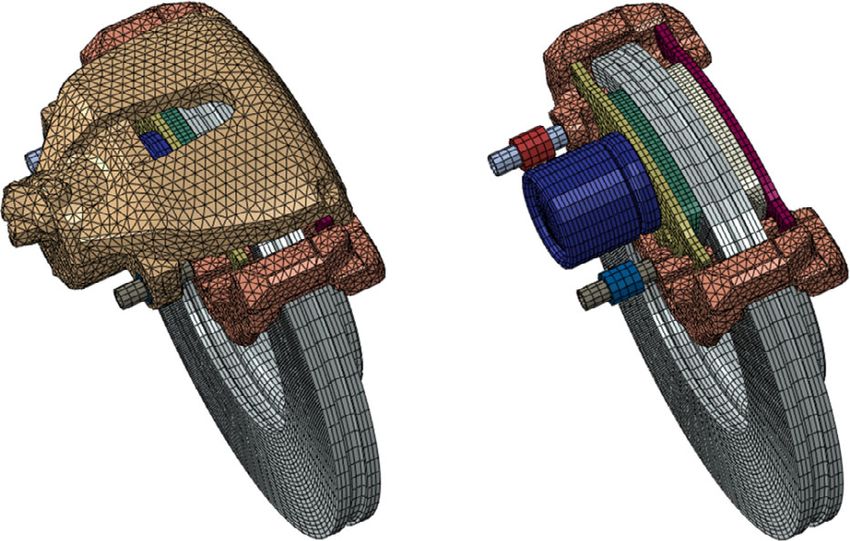
body, a carrier, and two pins with two bushings A quasi-static analysis is performed for every braking
where the calliper can slide. The entire brake system considered. At every time step of the braking, the FEA
is represented in Fig. 3. The disc braking ring has an is able to compute a contact pressure and a slip rate
internal and external radius respectively of 79.5 and distribution between pads and disc. The contact
138.7 mm. The pad area is 5,088 mm2 and the piston pressure distribution is determined by the way the
diameter is 28.5 mm. pads are pushed against the disc and it is sensitive
to the brake system geometry. The slip rate is pro-
2.3 Finite element analysis portional to the rotation rate of the disc, so it is higher
The FEA has been performed with the commercial for higher disc radii, and it decreases time step by time
software Abaqus [23]. A representation of the meshed step during the same braking. The contact pressure and
components is shown in Fig. 4. A parabolic tetrahedral the slip rate are computed in every node in contact.
mesh has been used for the calliper, while linear Therefore, each node in contact will be characterized
hexahedral mesh has been used for all the other by a contact pressure pci and a slip rate vi. The friction
components. The average size of the mesh is 4 mm. coefficient map presented in Fig. 2 can be written as a
A constraint of zero displacement has been set in function of contact pressure and slip rate as follow:
correspondence of the fixing points of the carrier. The
POD f ( p , v) (2)
system pressure psys is applied to the back of the piston
and on the wall of the calliper canalization. The rotation where a linear interpolation is considered between
rate is applied to the disc. the twelve conditioned tested, while the nearest value
is considered if a condition outside the map is verified.
Evaluating this function for every node of the pads
in contact—characterized by pci and vi—it is possible
to obtain the local friction coefficient μi distribution.
Knowing the local friction coefficient distribution,
the system friction coefficient μ at every time step
is obtained dividing the normal braking force by the
tangential braking force:
N
p Ani
1
i ci
(3)
2 psys Ap i 1
where psys is the brake system pressure, Ap is the
piston area, μi is the local friction coefficient, pci is the
Fig. 3 Disc brake system. local contact pressure, Ani is the nodal area, and N is
the number of pads nodes.
2.4 Braking case
An inertia brake dynamometer [6] has been used to
run a Los Angeles City Traffic (LACT) [24] cycle. Ten
brake events of the LACT cycle have been chosen to
be simulated with the FEA procedure. The system
pressure and car velocity during braking have been
considered linear and are shown in Table 2. The
velocity values reported in Table 2 represent the vehicle
velocity, while the pressure values represent the fluid
Fig. 4 Brake system mesh. pressure inside the brake system.
| https://mc03.manuscriptcentral.com/friction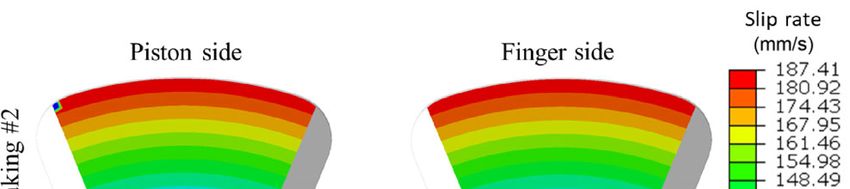
Friction 9(1): 191–200 (2021)                                                                                                          195

Table 2   Brake events: Vehicle velocity and brake system pressure.     and the velocity are, the lower is the heat generation,
                 Initial      Final         Initial      Final          and the lower is the temperature increase. The
  Braking
                velocity     velocity      pressure     pressure
  number                                                                temperature topic will be treated more in detail in
                 (kph)        (kph)          (bar)        (bar)
                                                                        the discussion section.
      1          25.87         10.68         8.10         6.10
      2          24.46         6.09          7.30         6.10
      3          21.63         6.44         11.50         10.00         3    Results
      4          26.40         6.18         10.70         8.80
                                                                        The contact pressure computed with FEA analysis
      5          25.52         8.39          8.10         6.90
                                                                        is shown in Fig. 6 for braking #2 and braking #11 in
      6          22.78         6.00          8.20         7.40
                                                                        Table 2, for the piston and finger side pads. The
      7          24.11         5.38          6.80         6.10          condition represented corresponds to the end of the
      8          27.02         7.59          6.80         5.60          braking. The contact pressure has a very similar map
      9          16.16         5.74          7.00         6.30          for both the braking. The pad on the piston side
     10          21.46         7.06         11.30         10.00         shows a higher pressure toward the disc inner side,
     11          24.73         6.53          8.50         6.80          which is also a higher for higher radii. The result is
     12          26.93         6.00          9.90         7.70          a transversal gradient for low radius-outer side to
                                                                        high radius-inner side. The finger pad has a contact
   The braking in Table 2 is chosen to have the                         pressure distribution with a gradient from low to
nominal contact pressure and the sliding velocity at                    high radii not much influenced by the disc sliding
the effective radius inside the friction map in Fig. 5,                 direction. The slip rate is shown in Fig. 7. As evident
with a tolerance of 5% for the final velocity. This is                  in the picture the slip rate is a mainly affected by the
done to consider only the area where the friction                       disc sliding velocity and is higher for higher radii in
coefficient value has been investigated in the POD                      all the distributions analysed.
tests. Considering these restrictions, the chosen braking                  The COF generated by the piston and the finger
all results in the lower-left part of the friction map,                 side pads during all the chosen braking in Table 2 is
which means low pressure and velocity. Note that                        represented in Fig. 8. The resulting COF is very similar
choosing low pressure and velocity braking is consistent                for both the pad, which means that for the braking
also with the neglecting of temperature of this                         analysed the different contact pressure in Fig. 6 does
simulation approach. In fact, the lower the pressure                    not significantly influence the global friction coefficient
                                                                        generated. The finger side pad results with a slightly
                                                                        lower friction coefficient almost in every braking and
                                                                        during all the single braking time.

Fig. 5 Simulated braking checked to be inside the friction map
with a tolerance of 5%. Every line in the figure represents a single    Fig. 6 Contact pressure of braking #2 and #11 in Table 2. Arrows
brake event.                                                            show the disc sliding direction.

                                                             http://friction.tsinghuajournals.com ∣www.Springer.com/journal/40544 | Friction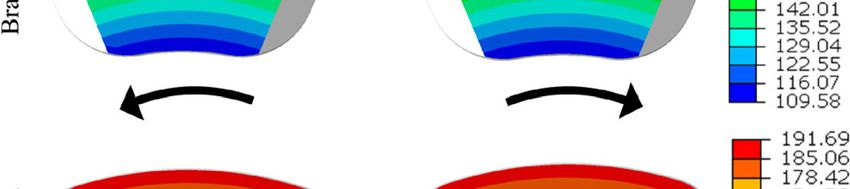
196                                                                                                   Friction 9(1): 191–200 (2021)

                                                                          Fig. 10 COF time history with offset removed from simulated
                                                                          curve. Experimental COF in black, FEA COF in red.
Fig. 7 Slip rate of braking #2 and #11 in Table 2. Arrows show
the disc sliding direction.
                                                                          4 Discussion
                                                                          The aim of the presented approach is to propose
                                                                          a simulation methodology which could be applied
                                                                          to investigate and predict a brake system friction
                                                                          performance for the considered friction material
                                                                          contact pair by using a pv-map of the local COF. This
                                                                          can be useful during the design phase of a new brake
                                                                          system, when a prototype is no yet available and a
                                                                          specific friction material has to be chosen to better
                                                                          define the system requirements and friction per-
Fig. 8 Internal and external side friction coefficient.
                                                                          formance. Moreover, this approach can be used to
                                                                          investigate phenomena which are difficult to study
   Simulated COF has been compared to the
                                                                          using experimental test such as in-stop COF increase
experimental one measured during dyno bench tests.
                                                                          and semi-local contact temperature increase.
The comparison is shown in Fig. 9. The simulated
                                                                             Twelve different stops coming from a city-traffic
COF is always higher than the experimental one
                                                                          cycle (LACT) have been simulated and the results
in terms of absolute value, with an offset varying
                                                                          have been compared with the correspondent experi-
braking by braking between 0.03 in braking #2 and
                                                                          mental measurements. For two brake events the
0.1 in braking #3, 4, 5, and 6. The simulated trend inside
                                                                          contact pressure and the slip rate have been shown.
every braking, instead, seems to be very representative
                                                                          It is possible to see in Fig. 6 that the contact pressure
of the experiments. The comparison removing the
                                                                          distribution is different on the piston side compared
offset has been done in Fig. 10.
                                                                          to the finger side for both brake events presented.
                                                                          This is explained by that the braking pressure of the
                                                                          analysed brake events is relatively low and due to the
                                                                          nature of the floating callipers. The piston pushes just
                                                                          one pad on the disc while the other is pushed by
                                                                          reaction of the floating body. By looking at the contact
                                                                          pressure distribution it seems that the brake torque
                                                                          generated by the rotating disc has an effect only on
                                                                          the piston-side pad that has a gradient in the tangential
                                                                          direction from the outer to the inner side. The slip
Fig. 9 COF time history during the selected braking. Experimental         rate (Fig. 7) is directly related to the radius. This seems
COF in black, FEA COF in red.                                             to be obvious since the disc is in rotation, but it is

                                      | https://mc03.manuscriptcentral.com/friction
Friction 9(1): 191–200 (2021)                                                                                                 197

also a signal that there are no transversal movements          temperature as a variable could be implemented. It has
of the pads which can usually be more typical at higher        to be considered that there are phenomena, especially
pressure brake events. The COF simulated for the               in the noise-vibration-harshness (NVH) field, where
piston and the finger side (Fig. 8) seem to be very            the contact pressure and the sliding velocity are much
similar. Moreover, the slip rate is the same for both          lower. In these phenomena the temperature does not
the pads, the contact pressure, as discussed above, has        play a primary role, therefore it is also more consistent
a different distribution which does not seem to affect         to neglect it and apply the approach directly as it is.
the global COF.                                                Ostermeyer [19] considered this fading effects intro-
   The correlation between experimental and simulated          ducing a two-equations dynamic model where the
results (Figs. 9 and 10) shows that the absolute value         second equation is focused on temperature effects. The
of the COF simulated is always slightly higher and that        tested case is a sort of constant velocity braking where
the trend during every brake event is well represented         a real variation of velocity is not considered which
by the simulation. This is important to be able to study       results in a COF as a function of contact pressure and
phenomena such as the in-stop increase of the COF.             temperature. The five constant parameters included in
It remains to better investigate the simulation offset         the model have been identified matching the experi-
compared to the experiments. A hypothesis is that the          mental measurements with the simulation results. The
measurement on the POD, where the input COF map                difference between the two approaches is that the one
is created, is different compared to the measurement           presented is focused on evaluating the performance of
at the dyno bench, where the experimental results              a new system by only knowing the friction material.
come from.                                                     In Ref. [19], instead, a model to find a law for the friction
   Inside every single brake event it is clear that a rise     coefficient has been formulated including some constant
of the COF occurs. This is in line with what has been          parameters which have to be set case by case.
numerically simulated by Wahlström [17] where in                  At the beginning of a braking most of the contact
the first part of the braking there is an increase of the      is carried by the metal fibres [21] which are inside
COF, while it stays constant after a run in phase. In          the friction material mixture. During braking pads
Ref. [17] the braking considered are more powerful             and disc wear, and the worn material can fill the gaps
compared to the brake events analysed in this present          in the disc and pad surface generating secondary
work and therefore the run in phase is shorter and they        plateaus [8]. This secondary plateaus contribute to
reach a situation similar to a steady state. Considering       increase the real contact area and increase the friction
lower power braking, instead, the run in time is incre-        coefficient during a braking. Looking at the meso-
ased. Looking at the experimental results presented in         scales, every portion of the pad is made by different
Ref. [17], after the run in phase the COF is not constant,     materials, therefore different properties. These dif-
but it has some decreasing phases that differs between         ferent properties, combined with the different local
brake events. This can be explained by the effect              values of pressure and velocity, generate different
of contact temperature which influences the material           contact conditions and in particular different friction
properties and decreases the performance of the                coefficient values [5]. Higher friction coefficient brings
friction material by causing some local fading effects.        to higher power and higher temperature. At the same
In this work the decreasing of the in-stop COF is not          time, lower thermal diffusivity contributes to lower
visible neither in the simulation nor in the experimental      dissipation of the heat generated and then higher
tests. Note that considering the friction map in Fig. 5        temperature. These higher temperature areas could
the twelve braking have been chosen in the lower-left          generate a strong decrease of friction performance
side of the map, which means low pressure and low              and then fading phenomena. It would be interesting
velocity, and, therefore, low braking power. Though,           to study the possibility to use the proposed simulation
at low power and energy braking it seems reasonable to         methodology to investigate these phenomena if the
neglect the temperature. For higher power and energy           pv-map is expanded for conditions when fading could
braking, the number of experiments in the POD can              occur.
be increased and a 3 dimentional (3D) map including               In the last paragraph we mentioned the gaps in the

                                                    http://friction.tsinghuajournals.com ∣www.Springer.com/journal/40544 | Friction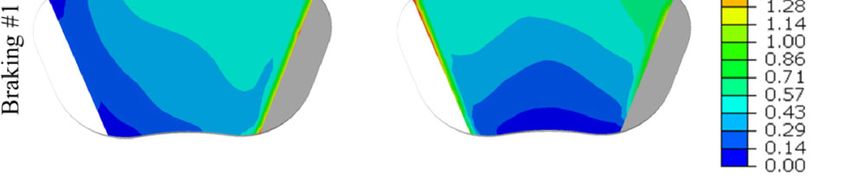
198                                                                                             Friction 9(1): 191–200 (2021)

disc and pad surfaces which are responsible of the                   test, but the friction material is already known. This
roughness of the material, and the wear which modifies               gives the possibility to avoid several iterations after
this surface roughness. The roughness influences                     prototyping. Feature developments are needed to test/
phenomena that act at the meso-scales, as investigated               simulate other brake systems using the same friction
by Riva et al. [25]. The focus of this work is on the                material and new friction materials. In fact, other
macro-scales where the overall brake system acts,                    POD friction maps with other friction materials can be
therefore this is not explicitly developed in the                    developed to build a material database. Moreover, it
simulation methodology. However, this is implicitly                  could be interesting to develop a 3D map of the COF
taken into account in the POD friction map. In fact,                 including local temperature effects and implement the
during the POD experiments, the pin and the disc                     temperature variable into the simulation, being able to
tested have a specific roughness, are subjected to a                 investigate higher power brake events and possible
specific wear, and have a specific real contact area,                fading effects. This approach also gives the possibility
which is different compared with the nominal pin area                to study how design changes of the calliper impact
used to compute the contact pressure reported on                     the global COF. That is, how should the calipper be
the y-axis of Fig. 5. During the FEA local conditions                designed in order to have a pressure distribution that
are considered for every node in contact. This local                 results in a COF that one wants.
condition is characteristic of a nodal area that is on
the order of the pin area used in the POD test. This
                                                                     5     Conclusions
means that we can use the nominal contact pressure
computed in that specific node to query the friction                 A simulation methodology based on a FEA has been
map and all the roughness and contact area effects                   developed. The methodology consists of computing
at the smaller scales are included in that specific                  the global COF of an entire brake system starting
condition tested. Instead, what it is explicitly com-                from the local COF dependence of contact pressure
puted in the simulation is the real macro-contact area               and sliding velocity. By analysing brake events from
determined by the contact pressure distributions in                  a city traffic cycle and comparing the simulation and
the FEA. Since the piston and the floating calliper                  experimental results, the following conclusions can
push the pads in a non-uniform way, the pad-to-disc                  be done:
contact will produce a non-uniform pressure dis-                        1) For the studied brake system and brake events
tribution which is computed in the analysis. Also, this              there is no significant difference between the COF
pressure distribution in some cases can avoid to some                generated by the piston and the finger side pads;
nodes of the pad to be in contact with the disc, and                    2) Experimental and simulation results are
reducing then the real contact area. The macroscopic                 qualitatively in line especially in the in-stop behaviour,
wear of the pad can also affect the contact pressure                 while the simulated results show a positive offset in
distribution and therefore the local friction coefficient.           the COF compared to the experimental ones;
However, the macroscopic wear of pads and disc acts                     3) No decreasing of COF has been seen neither
at different time scales compared to the one studied                 in experimental nor in simulated results, possibly
here. In brake disc applications wear can be usually                 explained by the low power braking considered which
considered important after a series of high-energy                   allow to neglect the thermal effects.
braking or even after some braking cycles. In this study                Further studies with different brake systems have
only twelve braking have been investigated and the                   to be done to fully validate the model and other
wear as first approximation can be neglected to reduce               friction materials can be tested to generate a friction
the computational time.                                              pv-map database.
   To summarize, the results from the present
study seem promising. The simulation methodology                     Open Access: This article is licensed under a Creative
developed can be useful in the early design phase                    Commons Attribution 4.0 International License, which
of a brake system when there are no components to                    permits use, sharing, adaptation, distribution and

                                 | https://mc03.manuscriptcentral.com/friction
Friction 9(1): 191–200 (2021)                                                                                                           199

reproduction in any medium or format, as long as                            reibzonendynamik trockenlaufender reibpaarungen unter
you give appropriate credit to the original author(s)                       ergänzung physikalischer und chemischer charakterisierungen
and the source, provide a link to the Creative Commons                      der reibpartner. Ph.D Thesis. Ilmenau (Germany):
licence, and indicate if changes were made.                                 Universitätsverlag Ilmenau, 2015.
   The images or other third party material in this                   [10] AbuBakar A R, Ouyangb H J. Wear prediction of friction
article are included in the article’s Creative Commons                      material and brake squeal using the finite element method.
licence, unless indicated otherwise in a credit line to                     Wear 264(11–12): 1069–1076 (2008)
the material. If material is not included in the article’s            [11] Han M J, Lee C H, Park T W, Park J M, Son S M. Coupled
Creative Commons licence and your intended use is                           thermo-mechanical analysis and shape optimization for
not permitted by statutory regulation or exceeds the                        reducing uneven wear of brake pads. Int J Automot Technol

permitted use, you will need to obtain permission                           18(6): 1027−1035 (2017)
                                                                      [12] Söderberg A, Sellgren U, Andersson S. Using finite element
directly from the copyright holder.
                                                                            analysis to predict the brake pressure needed for effective rotor
   To view a copy of this licence, visit
                                                                            cleaning in disc brakes. SAE Technical Paper 2008-01-2565.
http://creativecommons.org/licenses/by/4.0/.
                                                                            SAE 2008.
                                                                      [13] Valota G, De Luca S, Söderberg A. Using a finite element
References                                                                  analysis to simulate the wear in disc brakes during a dyno
                                                                            bench test cycle. In Proceedings of the Eurobrake, Dresden,
[1]   Tirovic M, Day A J. Disc brake interface pressure distri-
                                                                            Germany, 2017: EB2017-SVM-003.
      butions. Proc Inst Mech Eng Part D J Automobile Eng 205(2):
                                                                      [14] Archard J F. Contact and rubbing of flat surfaces. J Appl
      137–146 (1991)
                                                                            Phys 24(8): 981–988 (1953)
[2]   Garg B D, Cadle S H, Mulawa P A, Groblicki P J, Laroo C,
                                                                      [15] Wahlström J, Söderberg A, Olofsson U. Simulation of
      Parr G A. Brake wear particulate matter emissions. Environ
                                                                            airborne wear particles from disc brakes. SAE Technical
      Sci Technol 34(21): 4463–4469 (2000)
                                                                            Paper 2009-01-3040. SAE, 2009.
[3]   Kukutschová J, Moravec P, Tomášek V, Matějka V, Smolík
                                                                      [16] Wahlström J, Söderberg A, Olofsson U. A cellular automaton
      J, Schwarz J, Seidlerová J, Šafářová K, Filip P. On airborne
                                                                            approach to numerically simulate the contact situation in disc
      nano/micro-sized wear particles released from low-metallic
                                                                            brakes. Tribol Lett 42(3): 253–262 (2011)
      automotive brakes. Environ Pollut 159(4): 998–1006 (2011)
                                                                      [17] Wahlström J. A comparison of measured and simulated
[4]   Sanders P G, Xu N, Dalka T M, Maricq M M. Airborne
                                                                            friction, wear, and particle emission of disc brakes. Tribol
      brake wear debris: Size distributions, composition, and a
      comparison of dynamometer and vehicle tests. Environ Sci              Int 92: 503–511 (2015)
      Technol 37(18): 4060–4069 (2003)                                [18] Riva G, Valota G, Perricone G, Wahlström J. An FEA
[5]   Wahlström J, Matějka V, Lyu Y Z, Söderberg A. Contact                 approach to simulate disc brake wear and airborne particle
      pressure and sliding velocity maps of the friction, wear and          emissions. Tribol Int 138: 90–98 (2019)
      emission from a low-metallic/cast-iron disc brake contact       [19] Ricciardi V, Augsburg K, Gramstat S, Schreiber V, Ivanov V.
      pair. Tribol Ind 39(4): 460–470 (2017)                                Survey on modelling and techniques for friction estimation
[6]   Perricone G, Wahlström J, Olofsson U. Towards a test stand            in automotive brakes. Appl Sci 7(9): 873 (2017)
      for standardized measurements of the brake emissions. Proc      [20] Ostermeyer G P. On the dynamics of the friction coefficient.
      Inst Mech Eng Part D J Automobile Eng 230(11): 1521–1528              Wear 254(9): 852–858 (2003)
      (2016)                                                          [21] Ricciardi V, Travagliati A, Schreiber V, Klomp M, Ivanov
[7]   Mathissen M, Grochowicz J, Schmidt C, Vogt R, Farwick                 V, Augsburg K, Faria C. A novel semi-empirical dynamic
      zum Hagen F H, Grabiec T, Steven H, Grigoratos T. A novel             brake model for automotive applications. Tribol Int 146:
      real-world braking cycle for studying brake wear particle             106223 (2020)
      emissions. Wear 414–415: 219–226 (2018)                         [22] Chan D, Stachowiak G W. Review of automotive brake
[8]   Eriksson M, Lord J, Jacobson S. Wear and contact conditions           friction materials. Proc Inst Mech Eng Part D J Automobile
      of brake pads: Dynamical in situ studies of pad on glass.             Eng 218(9): 953–966 (2004)
      Wear 249(3–4): 272–278 (2001)                                   [23] Information about Abaqus. https://www.3ds.com/products-
[9]   Gramstadt S. Methoden der in-situ visualisierung der                  services/simulia/products/abaqus/.

                                                           http://friction.tsinghuajournals.com ∣www.Springer.com/journal/40544 | Friction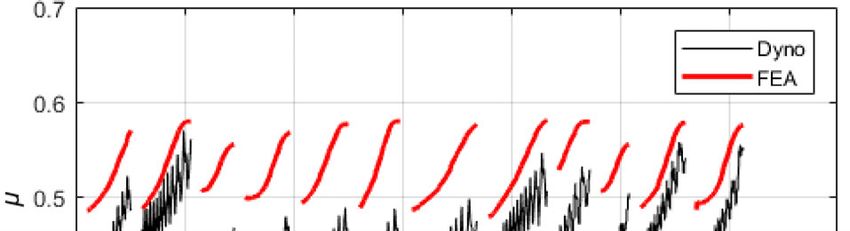
200                                                                                                     Friction 9(1): 191–200 (2021)

[24] Mody P, Rumold W, Attia F, Ansmann S. Mojacar and los               [25] Riva G, Perricone G, Wahlström J. Simulation of contact
     angeles city traffic vehicle testing: A comparison & analysis            area and pressure dependence of initial surface roughness
     of subjective ratings and objective measurements. SAE                    for cermet-coated discs used in disc brakes. Tribol Ind 2019.
     Technical Paper 2002-01-2600. SAE, 2002.                                 DOI: 10.24874/ti.2019.41.01.01.

                      Gabriele RIVA. He received his                      Department. He worked with some European projects
                      master’s degree in aeronautical                     collaborating with KTH Royal Institute of Technology,
                      engineering in 2013 from Politecnico                Stockholm, Sweden, where in January 2018 he started
                      di Milano, Milano, Italy. Then, he                  his Industrial Ph.D. in machine design with focus on
                      started to work for Brembo S.p.A.                   tribology applied to brake systems.
                      in the Research & Development

                                     | https://mc03.manuscriptcentral.com/friction
You can also read