(Bio)Signatures of Planet Earth from (Spectro)Polarimetry - Michael Sterzik, European Southern Observatory Stefano Bagnulo, Armagh Observatory
←
→
Page content transcription
If your browser does not render page correctly, please read the page content below
(Bio)Signatures of Planet Earth

   from (Spectro)Polarimetry

Michael Sterzik, European Southern Observatory

Stefano Bagnulo, Armagh Observatory
a             b                   c

              ‘ Holds Life?
    Which World
d             e                   f

    Polarimetry will help.
       Talk by Fossati
       Poster B4 by Bagnulo
       Poster B18 by Miles-Paez
322 BAILEY
Polarimetric Signatures of Planet Earth occurring at the minimum scattering angle, and
this occurs at:
x0 ! !"((4 " n2)/3) (2)
On Venus, the liquid is sulfuric acid (about 75%
H2SO4 to 25% H2O) with a refractive index of 1.44
(Hansen and Hovenier, 1974), whereas on Titan,
it is liquid methane at a temperature of #100K,
which has a refractive index of 1.29 (Badoz et al.,
rainbow polarization
For water, the resulting scattering angle is about 1992).
139° (for blue light), which gives a rainbow with The light of the rainbow is highly polarized in
a semivertex angle of 41° about the anti-solar a direction perpendicular to the scattering plane.
point. Light that internally reflects twice inside a This arises because the angle of incidence within
droplet gives a secondary rainbow at a scattering the drop is close to the Brewster angle, at which
angle of about 128°. The region between the pri- light with parallel polarization is fully transmit-
mary and secondary rainbows is dark (Alexan- ted, but light with perpendicular polarization is
der’s dark band), but some light is scattered into partially reflected. For water, the primary rain-
angles inside the primary rainbow and outside bow has a polarization of about 96% and the sec-
the secondary rainbow. ondary rainbow about 90% for large droplets
Figure 1 shows the variation of primary rain- (Adam, 2002).
bow scattering angle with refractive index de-
rived from Eqs. 1 and 2. This variation of scat- Rainbows in Lorenz-Mie theory
tering angle with refractive index gives rise to the
familiar colors of the rainbow since the refractive The familiar brightly colored rainbows arise
index of water varies from about 1.344 at 400 nm from water droplets with a size of 1 mm or larger.
to 1.329 at 800 nm, which gives a range of scat- However, the rainbow scattering phenomenon
tering angles from 139.5° to 137.4°. It also means persists for much smaller droplets. As the drop-
that different scattering liquids will give rise to lets become smaller, diffraction effects broaden
different rainbow angles. Liquid droplet clouds, the scattering peak (as a function of scattering an-
and probably rain, are known to occur in the at- gle), and this means that rainbows from small
mospheres of Venus and Titan as well as Earth. droplets (fogbows or cloudbows) no longer show
distinct colors. Nevertheless, there is still a strong,
highly polarized scattering peak at the primary
rainbow angle. It is the ability to observe rainbow
scattering from cloud droplets that makes rain-
bow scattering a feasible technique for studying
Venus extrasolar planets.
The rainbow scattering from small particles can
be best studied using Lorenz-Mie scattering the-
ory. To investigate the rainbow properties, I have
Earth carried out a series of calculations of the normal-
ized scattering matrix Fij (Mishchenko et al., 2002,
Eq. 4.51) for a size distribution of spherical
Titan droplets. The calculations used the code of
Mishchenko et al. (2002, section 5.10). The size dis-
tribution of spherical droplets is specified using
the power-law distribution of Hansen and Travis
(1974):
n(r) ! $
constant # r"3, r1 $ r $ r2,
0, otherwise
(3)
As described by Mishchenko et al. (1997), the val-
FIG. 1. Primary rainbow scattering angle as a function ues of r1 and r2 can be expressed in terms of the
of refractive index, as determined by the ray optics ap- cross-section-area weighted effective radius reff
Hansen, J. E. & Hovenier, J. W. Interpretation of the polarization of Venus. Journal of Atmospheric Science 31, 1137–1160 (1974).
proximation. The rainbow angles are indicated (at a
Bréon, F. M. & Goloub, P. Cloud droplet effective radius from spaceborne
wavelength ofpolarization
400 nm) for measurements.
andresearch
Geophysical
three substances known to
effectiveletters
variance eff.
25, !1879–1882 (1998).
Bailey, J. Rainbows, Polarization, and the Search for Habitable form liquid Astrobiology
Planets. droplet clouds 7,
in 320–332
the solar system:
(2007). liquid The components of the normalized scattering
methane (Titan), water (Earth), and sulfuric acid (Venus). matrix describe the intensity and polarization of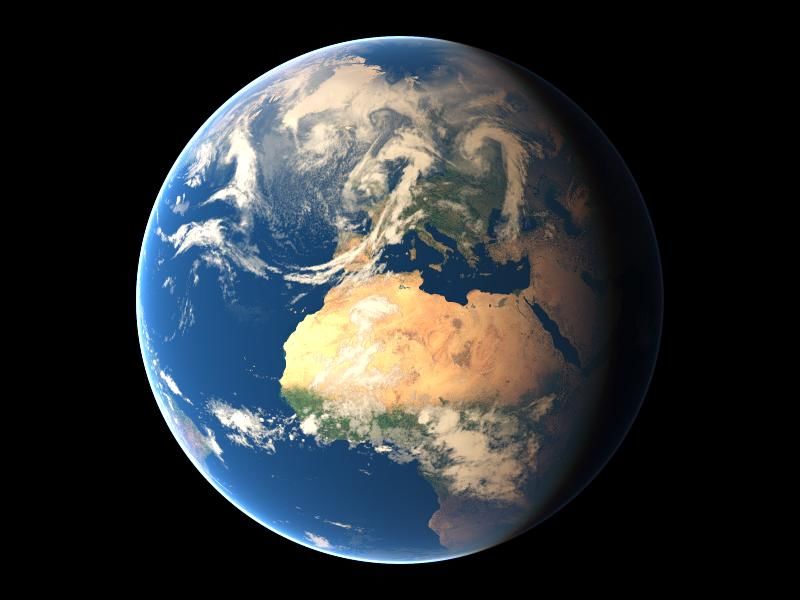
Polarimetric Signatures of Planet Earth
                                                                                   – 27 –

               pure ocean surface                                                                                              pure land surface

                                                                                  no clouds

                                                                                    clouds

                                 Phase Angle                                                                                         Phase Angle

 McCullough, P. R. Models of Polarized Light from Oceans and Atmospheres of Earth-like Extrasolar Planets. arXiv astro-ph, (2006).

 Williams, D. M. & Gaidos, E. Detecting the glint of starlight on the oceans of distant planets. Icarus 195, 927–937 (2008).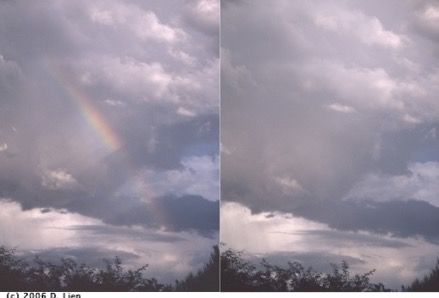
996
Models of the Earth’s Polarization D. M. Stam: Spectropolarimetry of Earth-like exoplanets
0.25 1.0
Degree of polarization Ps
1.0 0.0
0.20 0.8
0.15 0.6
VRT calc. include
Flux F
0.1 Fig. 3. The flux F (left) and the degree of
0.10
0.4 0.4 Rayleigh
linear polarization P (right) of starlight re-
flected by model planets with clear atmo-
s
phase angle
0.2 spheres and isotropically reflecting, com-
0.05 pletely depolarizing surfaces as functions
0.0 0.0 1.0 of the wavelength, for various values of
0.3 0.4 0.5 0.6 0.7 0.8 0.9 1.0 0.0, 0.1, 0.2, 0.4,ocean
0.00 the (wavelength independent) surface albedo:
0.3 0.4 0.5 0.6 0.7 0.8 0.9 1.0 0.8, and 1.0. The planetary
Wavelength λ (in µm) Wavelength λof(in
D. M. Stam: Spectropolarimetry µm) exoplanets
Earth-like phase angle α is 90 . 999
◦
0.25 1.0
clouds
(quadrature) is
1.0relatively high (provided there is an observable
0.0 absorption of light in the
“vegetation”
Fig.Huggins
7. The wavelength
band of Odependent
decreases (left)
F the
Degree of polarization Ps
3
exoplanet).
0.20 0.8 amount ocean and P light,
of multiple scattered (right)which
of starlight thathas
usually sis reflected
a lowerby
clear and cloudy horizontally homogeneous
Each curve in Fig. 3 can be thought of as consisting of acleardegree of polarization than the singly-scattered light. In gen-
model planets with surfaces covered by de-
continuum
0.15 cloudy
with superimposed high-spectral resolution 0.6 features. eral, with increasing atmospheric
work in progress
absorption optical thickness,
Flux F
ciduous forest (thin solid lines) and a specu-
The continua of the flux and polarization curves are determined Ps will tend towards thelar
forest degree of polarization
reflecting of light
ocean (thin dashed singly-
lines). Note
by0.10
the scattering of light by gaseous molecules in the atmosphere0.4 cloudy scattered by the atmospheric constituents
that the (for these
lines pertaining to Psmodel
of the plan-
cloudy
and by the surface albedo. The high-spectral resolution features ets: only gaseous molecules),
are0.05 clear
due to the absorption of light by the gases O0.2 3 , O2 , and H2 O single-scattering angle Θfrom inhomogenities
andeach
whicharedepends
atmospheres
thusother.
on the
virtuallystrongly
Forplanetary
comparison, phase
on the
indistinguishable
we an-
have
(see below).
0.0 Note that the strength and shape of the absorption
0.00 depend on the spectral resolution (0.001 0.0
bands
0.3calculations.
0.4 0.5 0.6 0.7 0.8 0.9 1.0
1.0
0.3 0.4 0.5 0.6
gle α. From Fig. 1b, it can
µm) of the nu- 90◦ , Ps of light singly-scattered
0.7This
0.8explains
realistic clouds
alsobe seen that
included
planets with
0.9 1.0the high
1.0 (thick
the at
by surface
a scattering
spectra
gaseousalbedos
solid
equal is
molecules
angle
of the clear of
model
to about
0.0 and
merical 0.95. values oflines),
Ps at shown before in
the shortest Fig. 3.
wave-
Wavelength (in µm) Wavelength (in µm)
In the total flux curves (Fig. 3a), the contribution of light lengths in Fig. 3b. WithThe aerosols/haze
planetarywavelength,
increasing
scattered by atmospheric molecules is greatest around 0.34 µm: multiple-scattered light decreases, simply because of the de-
phase angle isthe ◦
90 amount
. of
at shorter
be observed
Huggins
wavelengths,
on the
absorption
moon’s
band,
light
and
is absorbed
nightside.
at longer
by O3 in the
Interestingly,
wavelengths,
the
the
so-called
reflection
amount
by chlorophyll leaves a much stronger signature in Ps than in F, the last fact, the
crease in the atmospheric
singly-scattered
Consequently, P
Stam, D. M. Spectropolarimetric signatures of Earth-like extrasolar planets. A&A 482, 989–1007 (2008) by
of the realistic surfaces
molecular
gaseous
planet with
scattering
molecules
the
(see
black
optical
Fig. 1b).
surface
s continuum P of the cloudy planets is neg-
thickness.
Thanks to
increases
of starlight that is scattered by the atmospheric molecules de- with wavelength, to approach itss single-scattering value at the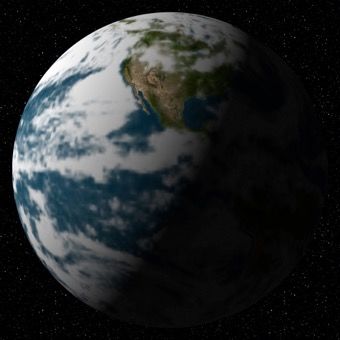
Earth aspect variations
Earthshine

                                Phase angle

courtesy of E. Pallé
1957SAnAp...4
195
Early Polarimetry of Planet Earth
1957SAnAp...4....3D
Difficult!
fractional Polarization [‰]
Phase Angle
Wavelength dependency Moon surface depolarization
Dollfus, A. Étude des planètes par la polarisation de leur lumière. Supplements aux Annales d'Astrophysique 4, 3–114 (1957).Spectropolarimetry of
Earthshine with FORS@VLT
Sterzik, M. F., Bagnulo, S. & Pallé, E. Biosignatures as revealed by spectropolarimetry of Earthshine. Nature 483, 64–66 (2012).Spectropolarimetry of ES:
Observing Date 25-Apr-2011:UT09 10-Jun-2011:UT01
View of Earth as seen from
the Moon
12
Sun-Earth-Moon phase 87 deg 102 deg
ocean fraction in Earthshine 18% 46%
vegetation fraction in 7% 3%
Earthshine
tundra, shrub, ice and desert 3% 1%
fraction in Earthshine
total cloud fraction in 72% 50%
Earthshine
cloud fraction t > 6 42% 27%10-Jun-2011:UT01
25 1.0
10 % vegetation does NOT fit !
20
PU=U/I 0.5
fraction of polarization PQ [%]
15
P [%]
0.0
10
5 −0.5
0
−1.0
500 600 700 800 900
wavelength [nm]25-Apr-2011:UT09
25 1.0
12 % vegetation DOES fit !
20
0.5
fraction of polarization PQ [%]
15
P [%]
0.0
10
5 −0.5
0
−1.0
500 600 700 800 900
wavelength [nm]More (Spectro-)Polarimetry
A.No. 2]
Bazzon Earthshine
et al.: Measurement of the earthshine Polarization
polarization in theSpectra
B, V, R, and I band as function of phase
A. Bazzon et al.: Measurement of the earthshine polarization in the B, V, R, and I band as function of phase
38-5
of ES
Unfortunately it is not clear whether they measured the back-
scattering from maria or highlands. Sterzik et al. (2012) attribute
the polarization differences between the two epochs mainly to in-
trinsic differences of the polarization of Earth because the earth-
shine stems from different surface areas and were taken for days
with different cloud coverage. Considering our polarization val-
ues for highlands and maria then it could be possible that the
differences measured by Sterzik et al. (2012) are at least partly
due to the mare/highland depolarization difference (or surface
albedo difference). A&A 562,
Another spectra-polarimetric observation of the earthshine
was published by Takahashi et al. (2013). They also find a rise 18
This work
of the fractional polarization of the earthshine towards the blue 16 Sterzik et al. 2012
but with a much flatter slope. Unfortunately they do not re- 14 Bazzon et al. 2013: highlands
Bazzon et al. 2013: maria
port whether their results were obtained from maria or high- 12 2
H O
lands either. Therefore, only a qualitative comparison with our 10
p* (%)
data can be made. The observations of Takahashi et al. (2013) 8 2
O 2
HO
2
O
H2O
are conducted at 5 consecutive nights and cover phase angles 6 H2O
α = 49◦ − 96◦ . In the blue they find that the maximum polariza- 4
tion is reached at α ≈ 90◦ . However, for wavelengths > 600 nm 2
the polarization keeps increasing up to and including their last 0
measurement at α = 96◦ . They conclude that the phase with 0.3 0.6 0.9 1.2 1.5 1.8 2.1
the highest fractional polarization αmax is shifted towards larger Wavelength (µm)
phase angles which could be explained by an increasing con- Fig. 3. Our visible and NIR spectropolarimetric measurements of the
tribution of the Earth surface reflection. In our data we do earthshine not compared to literature data. A 10-pixel binning was applied
A. Bazzon et al.: Measurement of the earthshine polarization see this in the
shift B,
but V, R,
neither and I band
can we as function
exclude itof phase
because we were not
Fig. 7. Fractional polarization Q/I and U/I of the earthshine measured for highland (top) and mare regions (bottom) for the four to the NIR spectrum of region B. The uncertainty per wavelength is plot-
different filters B, V, R and I (left to right). The solid curves are qmax sin2 fits to the data. able Thetoerror
derive
bars meaningful
give the statistical data 1σ due to the very strong stray light ted as vertical gray error bars. Wavelengths of strong telluric absorption
Unfortunately it is and not clear whether Miles-Páez, P. Some
A., Pallé, E. & Zapatero Osorio, M. R.
noise ∆noise of the data whereas the mare I band data at phase angle 109.5◦ are additionally from affected by a substantial
the moonshine systematic
the weak signalthey from measured thehave
the earthshine. back- been removed. molecular species seen in “emission” (in-
offset ∆syst > 0.5 %. The dots in the V panel for the mare region indicate the measurementsscattering of Dollfus (1957)from and maria or
a correspondinghighlands. Sterzik et al. (2012) attribute
dicativeSimultaneous
of strong optical and
atmospheric fluxnear-infrared
absorption and linear
less multiscattering
qmax sin2 fit (dashed line) is also given.
In this regime our linear extrapolation method to subtract the
the polarization mainlyprocesses spectropolarimetry
occurring at those of particular
the earthshine. A&A 562,
wavelengths) L5 (2014).
are labeled. The
background stray differences
light from between the earthshine the two epochs
signal introduces toa in-
trinsicsystematic
strong differences of the polarization
overestimate ∆syst of the of Earth
result because
(see Sect. vertical
the4.2).
earth- dashed line separates the ALFOSC and LIRIS data.
and the estimated statistical 1σ uncertainties of the individual also support phase curves qmax sin p (α). She calculates polariza-
data points ∆noise . The mare V band panel shows also the mea- tion phase curves assuming
shine
Takahashi stems
a range of
from
etsurface
al. (2013) different
types (e.g.also surface
use
forest-
areas
a linear and were taken
extrapolation method forto days
surements by Dollfus (1957) which are in good agreement with covered areas with Lambertian with different
determine cloud
the earthshine
reflection, dark oceancoverage.
with spec- Considering
polarization our polarization
but unfortunately they doval- We compare our measurements with data from the literature
our data. ular reflection) and cloud ues for
coverages.highlands
We find and
that themaria
broad then
not describe their data reduction in detail. Therefore, consider- it could be possible that the
in Fig. 3. To improve the quality of the NIR linear polarization
Our earthshine data show a very good correlation between shape of her model phase curves can be well fitted by curves
p differences
ing
the polarization taken simultaneously for the highland and mare ∼ qmax sin (α + α0 ) with p ≈ 1.5 − 3 and α0 ≈ 0 − 10 . the measured
limitations of
◦ our ◦by Sterzik
linear et al.
extrapolation, (2012) it are
could at least
be partly spectrum of region B, we applied a ten-pixel binning in
degree
possi-
regions. Independent of color filter and phase angle the polariza- Furthermore, she finds duethat
ble to the
the shift
characteristic mare/highland
of αatmax
features lowreporteddepolarization
phase by Takahashi difference
et al. (2013) the is spectral dimension. Overlaid in Fig. 3 are the optical p∗ val-
(or surface
◦
tion for the mare region is a factor of 1.30 ± 0.01 higher than for angles due to the rainbow due
albedoto thedifference).
effect strong
and negative stray light atatphase angles > 90 .
polarization ues obtained at a spectral resolution of 3 nm and for two sep-
the highland region as illustrated in Figure 8. large phase angles due to second order scattering. We cannot
Good correlations are also found between different colors assess the presence of such features Overall,
Another the
because spectral
spectra-polarimetric
of the coarse phase dependence of the polarization
observation of the earthshine arated
of dates by Sterzik et al. (2012), and the broadband filter
taken for the same observing date. When we plot the polariza- sampling of our data. Sterzik et al. (2012)
was published and Takahashi
by Takahashi et al.et(2013).
al. (2013) They also findmeasurements
is qualitatively a rise of Moon highlands and maria made by Bazzon
tion (Q/I)es in the V, R and I band versus the polarization in the Besides the qmax sin 2
similar
of the to
(α) curve our measurements
we also
fractional tried functions
polarization withbutofthe thelevel and slope
earthshine of the the
towards et blue
frac- al. (2013) for a Sun-Earth-Moon phase angle similar to ours.
Fig.
B band 13.
(Fig.Top:we Earthshine
9)A., find that the H. polarization
ratios
M.are&independent results at quadrature
ofMeasurement
αE . We more free for
parameters to fit the data, e.g. using a curve like
get
maria
Bazzon,
the ratios
Schmid,
0.72highlands
± 0.02, 0.49 (+).
(∗) earthshine
and ± 0.02The
Gisler, D.
and thin0.28 ±lines0.05 for
givethetheqmax
of
sin p (α et
Sterzik + αal. but with a much flatter slope. Unfortunately they do not optical
tional polarization
0 ) and varying the exponent p between values
differ quantitatively. Because Sterzik etAll
al. re- data display a qualitatively similar pattern (previously
the polarization in the B, V, R, and I band
ratios of the polarization between V and B band, R and B band, of 1.5-3 and by introducing
(2012) spectro-polarimetry for we waning (dashed) and(a)–(e)
waxing
(2012)
port andshift
Takahashi,
whether
a phase Takahashi
αJ. . et
ı0their
However, Phase
et
al.results al.
such(2013) Variation
were
fits
10 (60ı ), our
provide
obtained noEarthshine
of information
from
March 11 (72ı ), March 12 (84ı ), and
ordiscussed),
maria about high- but they differ quantitatively in the amount of polar-
and asBfunction
I and ofFig.
band respectively. 3.
phase Polarization
Therefore, . arXiv spectra
concludeof Earthshine.
that
astro-ph.EP, to Panels
(2013).
provide not are
a results from March
the
significantly
◦ bars signify standard deviation in thelands lunar
better 09 (! =to49the
surface
Polarization
match
either.
), March
albedo
Spectra.
data.
Therefore, for
Because
is shownonly
their
Publicationsmeasuring
a qualitative of area
the and
comparison do not ization
withas- our per wavelength and the spectral slope. The spectral slope
(dotted)
first moon
order we at Earth
can assume the phases
March
same13 (96
shape87◦forand
ı ), respectively.
the 102 Errorrespectively
polarization data cover and the
predominantly observed
phase sets. Noaround
angles error barquadrature in (a) because
theJapan only one effective set was
Takahashi
phase curve foretallal. obtained. Panel (f) is a
(2013) spectro-polarimetry (dash-dot)
wavelengths. plot of results for all the dates.
shape of at Derived
96
the phase
ı
sess
spectra
◦ curvedata
. are the stray
Astronomical
binned
is not can by 3 light
nm (5 effects
pixels)
be constrained.
very well made. ı The observations of Takahashi et al. (2013) et al. (2012) and Bazzon et al. (2013) data is steeper
Society
to from
obtain of
a the
better bright
S=N 65, moonshine
38
ratio. (2013).
The results their
from of
results SterzikMYSTIC 3D-vec. rad. transfer
n be
rth-
ther brief section about Monte Carlo method with polarization
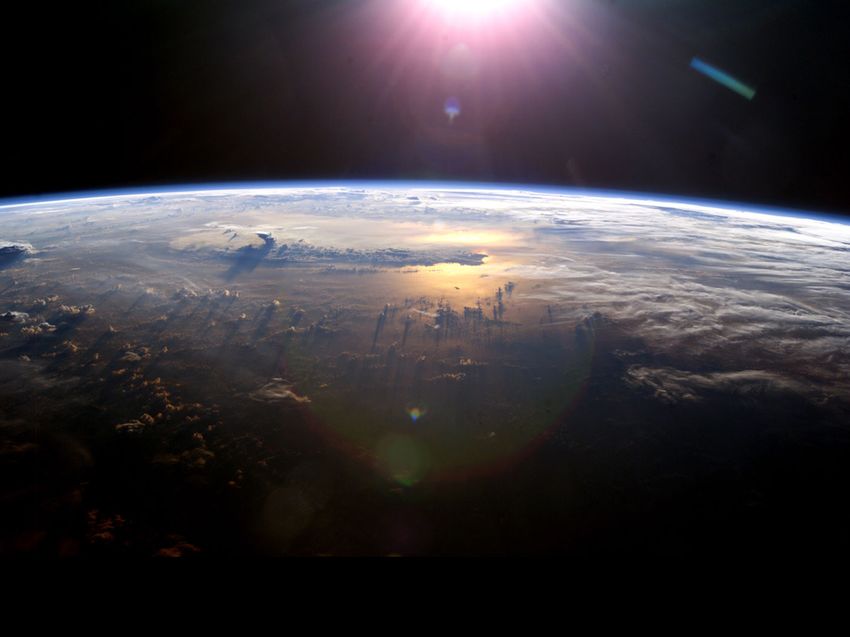
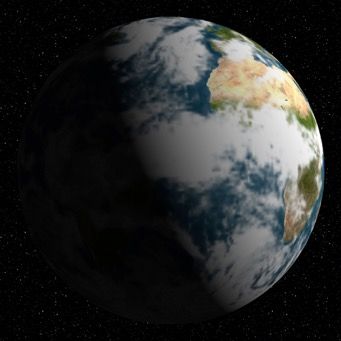
Fig. 2. Example calculation for a simulation of the earth as seen by
and- Emde et al. (2010)
the moon for a homogeneous atmosphere for a phase angle of 0°.
ob- fully spherical geometry
ans- w/ C. Emde (Monte Carlo code for the phYSically correct Tracing of photons In Cloudy atmospheres)
ount
oud
face
and
ma-
ible
ence
hod
due
the
ice
dge
ons.
ap-
for
met- 4 C. Emde et al.: Spectropolarimetric signatures of Earth-like planets
om-
T in Emde, C., Buras, R., Mayer, B. &
Fig. 1.M.Example
Blumthaler, calculation
The impact of aerosols for a simulation of the earth as seen Fig. 3. Example calculation for a simulation of the earth as seen by
by the moon.
on polarized Surface
sky radiance: albedo is taken from ECHAM model and the
model
development, validation, and the moon for a homogeneous atmosphere for a phase angle of 90°.
simulation is done without
applications. Atmos. Chem. Phys. 10,
atmosphere. The phase angle is 80°.
383–396–396 (2010).
Emde, C., Buras, R. & Mayer, B. An 40 show image of simulation for geometry of 25 April 2011,
efficient method to compute high include clouds, atmosphere, aerosol
spectral resolution polarized
solar radiances using the Monte
ALIS Emde et al. (2011) show spectrum for example
Carlo approach. Journal of above
Quantitative Spectroscopy and
Radiative Transfer 112, 1622– REPTRAN Gasteiger et al. (2014)
1631 (2011).MYSTIC 3D-vec. rad. transfer Fig. 7. Wavelength dependent flux F , polarization difference Q and degree of polarization P . The solid lines show MYSTIC calculations and the error bars correspond to the standard deviation. A Lambertian surface albedo of 0 is assumed. The aerosol mixtures have been defined according to Hess et al. (1998); Emde et al. (2010). Fig. 8. Same as Fig. 7 but for a green surface.
towards 3D-vec. rad. transfer
8                                                          C. Emde et al.: Spectropolarimetric signatures of Earth-like planets

Fig. 9. Sensitivity on cirrus cloud top height. The geometrical thickness of the cloud layer is 1 km. The optical thickness of the cloud at
550 nm is 2 and a general habit mixture as in Baum et al. (2005) is assumed. The underlying surface albedo is 0.

Fig. 9. Sensitivity on cirrus cloud top height. The geometrical thickness of the cloud layer is 1 km. The optical thickness of the cloud at
550 nm is 2 and a general habit mixture as in Baum et al. (2005) is assumed. The underlying surface albedo is 0.

Fig. 10. Sensitivity on cirrus optical thickness. The cloud layer is placed at 10km–11km altitude. A general habit mixture as in Baum et al.
(2005) is assumed. The underlying surface albedo is 0.
Spectro-Polarimetry of Planet
  Earth through Earthshine
 (+) robust tool to retrieve integrated surface and
 atmospheric properties

 (+) sensitive on biosignatures (VRE, O2, H2O)

 (-) restricted phase coverage

 (-) improve lunar depolarisation models

 (-) improve Earth VRT atmosphere/surface/haze modeling

 (-) long shot towards biosignatures on exo-planets…

 (+) SP of Planet Earth can constrain the design of future
 exo-Life machines
Construction of the 39m-ELT
     has been approved
You can also read