CATIALO4 SPINAL CERAMIC NANO OVALS: SYNTHESIS, PHYSICOCHEMICAL CHARACTERIZATION AND ANTIMICROBIAL ACTIVITY WITH WATER REMEDIATION APPLICATION
←
→
Page content transcription
If your browser does not render page correctly, please read the page content below
Research Journal of Chemistry and Environment_______________________________________Vol. 25 (6) June (2021)
                                                                                     Res. J. Chem. Environ.

 CaTiAlO4 Spinal Ceramic Nano Ovals: Synthesis, Physicochemical
     Characterization and Antimicrobial Activity with Water
                    Remediation Application
                                         Patil M.V.1*, Bamane S.R.2 and Khetre S.M.3
                                    1. Department of Chemistry, Miraj Mahavidyalaya, Miraj-416410, INDIA
                                2. Sushila Shankarrao Gadave Mahavidyalaya, Khandala, Satara-416416, INDIA
                               3. Department of Chemistry, Dahiwadi College, Dahiwadi, Satara-416416, INDIA
                                                        *
                                                         pramanikpatil@rediffmail.com

Abstract                                                                 suitable nanocomposite mix metal oxide ceramic material to
Oval shaped CaTiAlO4 nanoparticles were synthesized by                   kill microbial contents of water resources to generate good
wet chemical co precipitation and muffle ignition method.                quality of potable water6,11,15,30.
The oval shapes of nanomaterial were confirmed using SEM
imaging and spinal packing in crystals were determined on                Hydrogen peroxide is the major theme for this application of
the basis of XRD spectrum. The surface functionalities over              ceramic nanocomposites as these materials generate
nanomaterial was confirmed using FTIR spectrum                           peroxide entities with porous surface in water14. Oval
elucidating hydroxyl and oxide groups over surface for                   ceramic material can be used not only for antimicrobial
future water wetability.                                                 application but also for water remediation.

Furthermore the porous nature and electronic states in                   Material and Methods
nanomaterial were elaborated on the basis of UV-Vis. And                 All the chemicals used for synthesis for nanocomposites and
PL spectral transitions along with matching SEM and XRD                  their in vitro biological screening such as aluminium nitrate,
data. The very high porosity of this ceramic nanomaterial                titanium chloride, calcium nitrate, conc. HCl and ethanol
was confirmed by BET measurements and future water                       were of A. R. grade. These chemicals were purchased from
remediation applications were demonstrated using                         S. D. Fine Chem. Ltd. and Merck and were used without
antimicrobial testing on Staphylococcus Aureus and                       further purification. The cell culture medium such as agar
membrane water purification activity. Overall this novel                 growth broth and bacterial culture, fetal bovine serum,
ceramic porous nano material has proved useful application               trypsin buffer were obtained from Hi Media Ltd. The double
in water purification membranes.                                         distilled water was obtained from Millipore system and used
                                                                         throughout the synthesis and in vitro biological screening
Keywords: Oval ceramic, Nano material, Highly Porous,                    tests.
Water remediation, Absorbance.
                                                                         General procedure
Introduction                                                             Synthesis of oval ceramic nanoparticles: All the metal
With the idea in the field of ceramic water nanotechnology,              salts are mixed in 0.01M proportion in 25 ml. double
here in this research work we had developed a new class of               distilled water and traces of HCL are added to the flask. The
trio oval metal oxide ceramic nanocomposite material for                 flask contents are vortexed on magnetic stirrer at 600 rpm.
microbial remediation of surface water resources. Calcium                for 6 hours. Visible color change was observed after
and titanium based materials are used nowadays for                       formation of precipitate. The precipitate was washed with
antimicrobial applications in various fields.19,20,26,33 Along           double distilled water and dried in oven at 92OC. The dried
with sodium it can form stable mix metal oxide to result in              trio metal oxide nano composite ceramic powder was then
trio metal ceramic type material with good expected                      crushed and bonded with gluteraldehyde binder to form
porosity. Porosity is mainly important for water remediation             pallet. This powder and pallet were characterized and used
and antimicrobial effects of bacterial cell adhesion. So here            for antimicrobial studies in water remediation.
in this research work we had synthesized this mixed metal
oxide ceramic nanocomposite for such porosity required for               Co-precipitation method: For this experimental detection,
antimicrobial effects and future water remediation                       co-precipitation method is used. The advantage of the co
applications.1,3,6                                                       precipitation method involve simplicity and rapid
                                                                         preparation, composition and particle size control, energy
Nano technology has emergent research fields which are                   efficiency, low temperature and homogeneity of particles.
growing towards development of new class of ceramic metal                There are three main mechanism of co-precipitation:
oxide materials used for water remediation. Ceramic metal                inclusion, occlusion and adsorption.
oxide nanoparticles and nano composites are having suitable
applications for antimicrobial and cleansing of water                    Structural and morphological characterization of oval
pollutants and agents. Limited number of reports have been               nanomaterial: As mentioned in table 1, the structure,
attempted and published by researchers in this field.17,19,20 So         morphology, particle diameter range and types of bonding of
there is need of development of new class of cheaper and                 functionalities in the ceramic nanocomposite was

                                                                   163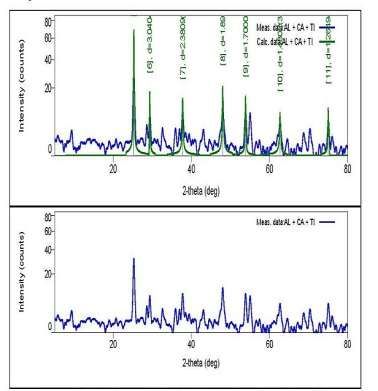
Research Journal of Chemistry and Environment_______________________________________Vol. 25 (6) June (2021)
                                                                                     Res. J. Chem. Environ.
determined based on physicochemical characterization using            the wells bored on plates. The gram positive Staphylococcus
UV-Vis., PL, FTIR, XRD spectrometry techniques and SEM                Aureus bacteria was grown on culture plates and inhibited
microscopic analysis.2,8-10,36 The Spectronics double beam            by dosing of material solutions in buffer dispersions with
UV-Vis. spectrometer with water as blank was used to                  physiological pH = 7.4 by use of phosphate buffer 26. The
determine absorption spectrum of material.                            culture plates were incubated and zones of inhibition were
                                                                      measured and biocompatibility/ antimicrobial property of
To confirm functionalities present in material and comparing          nanocomposite was elaborated.
with pallet form, Perkin Elmer series FTIR spectrometer was
used with KBr pellet technique. The PL emission spectrum              Results and Discussion
of nanocomposite was determined using Jusco type spectra              Morphological and structural characterization of
fluorometer with excitation identity of material with same 25         ceramic nanomaterial
ppm concentrations. The X-ray diffraction pattern of                  UV-vis Absorption and pl emission spectrum: The UV-
material was determined using X-ray spectrometer by                   vis region of energy for electromagnetic spectrum at
powder diffraction technique to elaborate the packing f ions,         wavelength range from 200nm to 400nm. Absorbance or
hybridization and crystal system of nanocomposite entities.           emission peak shown in fig. 1 of UV-Vis spectrum is due to
The composition of material, formation and phase of                   Schiff base transition21,24,25 results in metal CORM complex
ceramic nanocomposite is proved here by this spectrometric            charge transfer transition. The UV-Vis absorption at 209.5
analysis.                                                             nm is due to n to pi absorption maxima in which charge
                                                                      transfer takes place A1g to T1g and A2g to T2g from d5 state
Antimicrobial screening on gram positive bacteria by                  of Ti and Al for splitting from bonding of carbimide and CO
agar well disc diffusion method: The cell-particle                    species. PL g at 222 nm is due to n to Pi relaxation in which
interactions of materials demonstrating their reactivity and          charge transfer takes place Pi to Pi relaxation- no quenching
biocompatibility can be elaborated using simple in vitro              due to Ti, Al oxide.
antibacterial screening in buffer solutions to maintain
physiological mimicking pH at material cell interactions. As          The composition of material, formation and phase of
cell pH affect on the biocompatibility of molecules. Here in          ceramic nanocomposite was proved here by spectrometric
this work 20 ppm. concentrations of material were dosed on            analysis.
bacterial cell cultures grown in agar broth on discs, inside

                     Figure 1: UV-Visible absorption spectrum of CaTiAlO4 ceramic nanomaterial

                                                      Table 1
                   MLCT transitions of non bonded/ Pi electrons of ligands and d electrons of metals
   Absorption or emission peak              Schiff base transition                 Metal CORM complex charge transfer
shown in UV-Vis. Or PL spectrum                                                                    transition
 UV-Vis. Absorption at 209.5nm.           n to Pi absorption maxima           A1g to T2g and A1g to A2g from d5 state of Ti ans Al
                                                                               for splitting from bonding of carbimide and CO
                                                                                                     species
          PL g at 222 nm.                      n to Pi relaxation-             Pi to Pi relaxation – no quenching due to Ti, Al
                                                 no quenching                                         oxide

                                                                164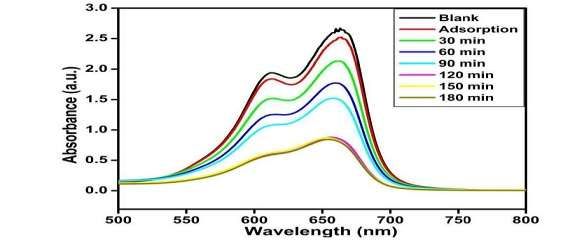
Research Journal of Chemistry and Environment_______________________________________Vol. 25 (6) June (2021)
Res. J. Chem. Environ.
Figure 2: PL emmission spectrum of CaTiAlO4 disc Nanomaterial
Table 2
Matching of FTIR signals elaborating the functionalities of Schiff base and CORM complex
Signal in FTIR Functionality Ceramic group functionality
spectrum
483 cm-1 Ca-Al linkage Metal-oxide bonds
828 cm-1 Al-O linkage Presence of linked oxide metal species
1050 cm-1 Ti-Al group Metal (I) and Metal (III) interaction
1385 and 1663 cm-1 Presence of hydroxide Surface groups of oxide nanomaterial
1764 and 3222 cm-1 Presence of –OH and Oxides Presence of surface moisture for porosity
Figure 3: FTIR spectrum of CaTiAlO4 ceramic nanomaterial for surface functionalities
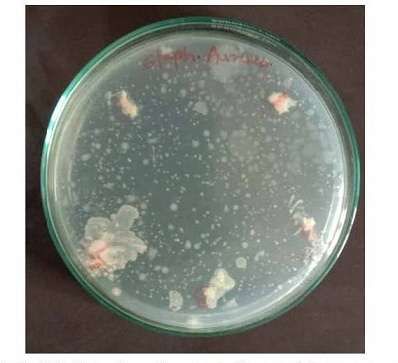
FTIR spectrum of ceramic nanomaterial for surface correspond to peak of (101), (221), (242), (211), (412). As
functionalities: FTIR spectrum of ceramic nanomaterial per XRD data in fig. 4, it has been proved that the ceramic
CaTiAlO4 is shown in fig. 3 and table 2. With the help of it nano composite material has octahedral packing of ions and
we can find surface groups.12,24,32 cubic phase purity elaborated 65nm size from main peak by
using Schere’s equation:
XRD (X- RAY diffraction) pattern of trio metal
nanomaterial: X-ray diffraction study of CaTiAlO4 ceramic d= a/√ h2+k2+12 (1)
nano material sample was examined by XRD analysis
10,13,35.Fig. 4 shows x-ray diffraction pattern of CaTiAlO As per XRD data in figure 3 and table 3, it had been proved
4
ceramic nano material sample analyzed at different that the ceramic nanocomposite has octahedral packing of
temperatures 0C. The XRD analysis of this sample contain ions and cubic phase purity elaborating the 65 nm sizes from
similar pattern with each other except change in peak height main peak using Scherer’s equation.
and peak with increase in temperatures. This pattern
165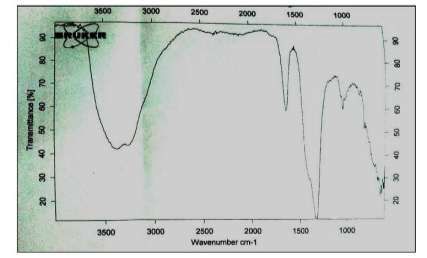
Research Journal of Chemistry and Environment_______________________________________Vol. 25 (6) June (2021)
                                                                                     Res. J. Chem. Environ.
SEM image for disc morphology: The SEM image of                    BET isotherm elaborating porosity of disc nanomaterial:
nanocomposite ceramic was shown in figure 5. It throws             As per fig. 6, it is oberved that the ceramic nanocomposite
light on Oval shapes of material with some aggregation of          show multi layer BET isotherm for nitrogen adsorpion hence
particles. This trio metal oxide ceramic composite possess         it has good surface posrosity. The BET plot hence proved
not only porosity but also exhibits Oval shapes for better         presence of porosity on surface of this nanocomposite
water loving nature and cell particle interactions.                ceramic material.9

                                                   Table 3
 Crystal parameters of Ceramic nanocomposite with octahedral packing matched with known ceramic JCPDS card.
                                                  0                           0
    Crystallite planes                                                                          Lattice Constant
                                 d Calculated A             d Standard A                          0
     (Miller Indices)                     2   2   2
                                                         JCPDS card no.- 86-          a and b A from main XRD peaks
          (h,k,l)               d = a/√(h +k +l )
                                                          6788 for CaTiAlO4              [242] at theta = 37.5 of disc
   Main peaks of ceramic                or
                                                               matched                     ceramic nanomaterial
   nano trio metal oxide           2dSinθ= nλ
            101                       4.324                          4.345            a standard = 5.249
            221                       5.453                          5.456            b standard = 7.266
            242                       7.234                          7.230
            211                       4.986                          4.988            a calculated = 5.251 and
            412                       6.789                          6.785            b calculated = 7.272

                         Figure 4: XRD pattern of the disc CaTiAlO4 ceramic nanomaterial

                       Figure 5: SEM image of CaTiAlO4 nanomaterial with oval morphology

                                                             166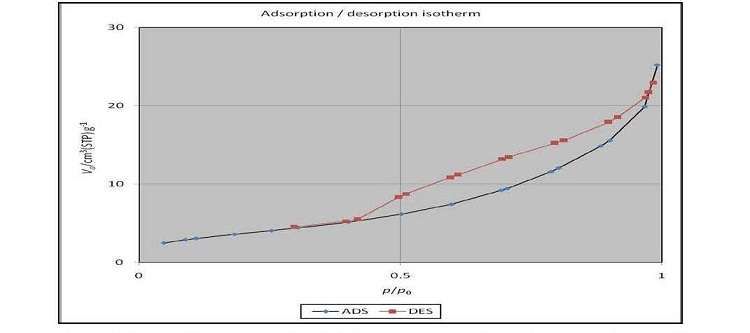
Research Journal of Chemistry and Environment_______________________________________Vol. 25 (6) June (2021)
                                                                                     Res. J. Chem. Environ.
Antimicrobial properties for water remediation from                  nanocomposite exhibit antimicrobial and water remediation
nanomaterial: As per figure 7 and table 4, for antimicrobial         potential at surface by material cell interactions. Here as
activity of 20 ppm material on Staphylococcus aureus, it had         material had surface porosity after reaction with cell
been demonstrated that good zone of inhibition was having            membrane material and water, the surface of material shows
better antimicrobial activity.26,36                                  adhesion to liquid and biomaterials which result in
                                                                     dissociation of nanocomposite to oxides on surface,
Mechanism for antimicrobial activity and water                       resulting in production of peroxide on surface. This peroxide
remediation activity: As per physicochemical and                     produced at surface of nanomaterial further can produce
antimicrobial screening of material and elaboration in               oxide and super oxide radicals to give antimicrobial effects
scheme 1, the disc nanomaterial trio metal oxide ceramic             for water remediation activity.26,36

              Figure 6: BET adsorption isotherm of CaTiAlO4 nanomaterial elaborating surface porosity

Figure 7: Anti microbial effects of ceramic nanomaterial on Staphylococcus Aureus for zone of inhibition at 20 ppm.

                                                       Table 4
    Anti microbial activities of Schiff base and complex compared for gram positive and gram negative bacteria.
        Type/ name of bacterial culture in      Zones of inhibition for gram positive bacteria as zone diameter in
                  Agar broth                    mm. for Concentrations of drug/ dose of ceramic nanomaterial
                [as per figures]                At 10 ppm.                               At 25 ppm Fig. 7
        Staphylococcus Aureus (gram +ve)                       15 mm.                                27 mm.

                                                               167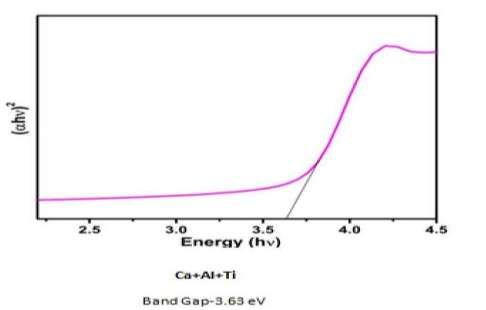
Research Journal of Chemistry and Environment_______________________________________Vol. 25 (6) June (2021)
                                                                                     Res. J. Chem. Environ.
Water remediation activity of CaTiAlO4                                characteristics wavelength. The percentage degradation of
Explanation: The photo catalytic degradation of methylene             methylene blue dye at irradiated time interval was calculated
blue dye in CaTiAlO4 mixed oxide ceramic suspension                   by using following equation:
under UV light elimination was investigated in order to
evaluate its photo catalytic activity18,32. A reaction system                                          At
                                                                      Degradation Percentage = (1 −         ) x 100
was setup at 20ppm concentration and 150 mg/100ml photo                                                Ao

catalysts amount. Sample is observed in total 180 min in
photo catalytic multi lamp reactor with UV light (365 nm Hg           where A is absorbance after time‘t’ and Ao is absorbance of
Vapor lamp) with maximum emission at about 660 nm at                  dye solution before degradation.
room temperature at constant starring to maintain
                                                                      It has been observed that at 180 min. Methylene blue dye
homogeneous suspension. The suspension was irradiated for
30 min to 3 hrs. period. The suspension was withdrawn and             shows 68% degradation rate. The absorption band gap of
centrifuge at each time of interval to remove CaTiAlO4                CaTiAlO4 is 3.63 eV indicating that ceramic nano catalyst
particles.                                                            CaTiAlO4 is suitable and best catalyst for degradation of
                                                                      methylene blue dye result in removal of polluted elements
                                                                      from water resources.
The absorption of methylene blue dye solution was
measured using UV-visible Spectrophotometer at its

                                                         Table 5
                                                  Degradation Parameters
                             1.                   Dye                            Methylene Blue
                             2.              Concentration                          20 ppm
                             3.          Photo catalyst’s amount                 150mg/100mL
                            4.             Degradation Time                         180 min
                            5.           Degradation Efficiency                       68%
                            6.                     pH                                   7
                            6.               Source of light                 365 nm Hg Vapor lamp

                          Fig. 8: % Degradation of Methylene Blue Dye with catalyst CaTiAlO4

                                                        Table 6
                                           % degradation during course of time
                                            Time            % Degradation of MB
                                            Blank                   00
                                          Adsorption                 5
                                           30 min                   19
                                           60 min                   33
                                           90 min                   42
                                           120 min                  66
                                           150 min                  67
                                           180 min                  68

                                                                168
Research Journal of Chemistry and Environment_______________________________________Vol. 25 (6) June (2021)
Res. J. Chem. Environ.
Fig. 9: Absorbance Band gap of CaTiAlO4
Conclusion 5. Bragg W.H., The structure of the spinel group of crystals, Phil.
A new disc shaped trio metal oxide based ceramic Mag., 30(176), 305 (1915)
nanomaterial was prepared using simple wet chemical and 6. Buxton G.V., Greenstock C.L., Helman W.P. and Ross A.B., J.
drying route. This nanomaterial with 55 nm mean size had Phys. Chem. Ref. Data, 17, 513 (1988)
exhibited surface porosity on the basis of BET isotherm N2
adsorption. The absorption and emission spectra of 7. Crewe Albert V., Isaacson M. and Johnson D., Rev. Sci.
nanomaterial had proved presence of oxide free electrons on Instrum., 40(2), 241-246 (1969)
surface. The nanomaterial possess surface oxide and
hydroxide species for water loving nature of material on the 8. Connes J. and Connes P., Instruments and Results, 56(7), 896-
basis of FTIR analysis. 910 (1966)
9. Condon J., Surface Area and Porosity Determination by
On the basis of antimicrobial testing of the material, it has Physisorption; Measurement, Classical Theory and Wuantum
been determined that this oval ceramic trio metal oxide Theory, 2nd ed., Amsterdam, Chapters 3, 4-5 (2020)
nanomaterial finds applications in water purification and
environmental fields. 10. Cullity B.D., elements of X-ray diffraction, Addison-Wesley,
California, USA, 2nd ed., 102 (1978)
Acknowledgement
The authors are thankful to Analytical Instrumentation 11. Egerton R.F., Physical Principles of Election Microscopy: An
Introduction to TEM, SEM and AEM, Springer, 125-153 (2005)
Laboratory, DST-FIST, Jaysingpur College, Jaysingpur,
India for providing some spectroscopic characterizations of 12. Fujishima A. and Zhang X., CR Chimie, 9, 750-760 (2006)
samples and Department of Microbiology, Miraj
Mahavidyalaya, Miraj for providing cell cultures and in vitro 13. Fultz Bo and Howe J., Transmission Election Microscopy and
testing facilities. We are also thankful to Principal, Miraj Diffractometry of materials, Springer (2007)
Mahavidyalaya, Miraj and Principal, Dahiwadi College,
Dahiwadi for encouragement. 14. Giamello E., Volante M., Fubini B., Geobaldo F. and Morterra
C., Mater. Chem. Phys., 29, 379 (1991)
References 15. Giamello E., Calosso L., Fubini B. and Geobaldo F., J. Phys.
1. Amorelli A., Evans J.C. and Rowlands C.C., J. Chem. Soc., Chem., 97, 5735 (1993)
Faraday Trans., 84, 1723 (1988)
16. Ghormely J.A. and Stewart A.C., J. Am. Chem. Soc., 78, 2934
2. Baran W. and Makowasky A., Dyes and Pigments, 76, 226-230 (1956)
(2008)
17. Gupta A.K., Pal A. and Sahoo C., Dyes and Pigments, 69, 224-
3. Binet C. and Daturi M., Catal. Today, 70, 155 (2001) 232 (2006)
4. Barwell C.N. and McCash E. Mo, Fundamentals of molecular 18. Haines R.I., McCracken D.R. and Rasewych J.B., In Water
spectroscopy, Fourth Edition, Tata, Mc-Graw-Hill. Publishing Chemistry of Nuclear Reactor Systems 5, British Nuclear Energy
Company Limited (2017) Society, London, 309 (1989)
169Research Journal of Chemistry and Environment_______________________________________Vol. 25 (6) June (2021)
Res. J. Chem. Environ.
19. Hochanadel C.J., J. Phys. Chem., 56, 587 (1952) 31. Pillai V., Lonkar S. and Alhassan S., ACS Omega, 5(14), 7969-
7978 (2020)
20. Hawkes P., ed., The beginnings of Electron Microscopy,
Academic Press (1985) 32. Ramachandran V.S., Applications of differential thermal
analysis in Cement Chemistry, Chap. V, Chemical Publishing Co.,
21. The Infracord double-beam spectrophotometer, Clinical Inc., New York, 92 (1969)
Science, 16(2) (1957)
33. Reimer L., Scanning Electron Microscopy: Physics of Image
22. Kingery W.D., Archaeometry, 16, 109-112 (1976) formation and Microanalysis, Springer, 527 (1998)
23. Lee R.E., Scanning electron microscopy and x-ray 34. Schuler R.H. and Allen A.O., J. Phys. Chem., 24, 56 (1956)
microanalysis, PTR Prentice Hall, Englewood Cliffs, New Jersey
(1993) 35. Sondi I. and Salopek-Sondi B., J Colloid Interf Sci., 275(1),
177-182 (2004)
24. Lewes G., Scanning electron microscopy and X-ray
microanalysis, John Willey and Sons, UK (1987) 36. Spence J.H., High-resolution electron microscopy, Oxford
press (1980)
25. Matai I., Sachdev A., Dubey P., Kumar S.U., Bhushan B. and
Gopinath P., Colloids Surf B Biointerfaces, 115, 359-367 (2014) 37. Suryanarayana C. and Norton M., X-ray Diffraction: A
Practical Approach (2013)
26. McCracken D.R., Tsang K.T. and Laughton P.J., Aspects of the
Physics and Chemistry of Water Radiolysis by Fast Neutrons and 38. Westgren A. and Phragmers G., X-ray Analysis of the Cu-Zn,
Fast Electrons in Nuclear Reactors, AECL 11895, Atomic Energy Ag-Zn and Au-Zn Alloys, Phil. Mag., 50, 311 (1925)
of Canada Limited, Chalk River, CA (1998)
39. Williams D. and Carter C.B., Transmission Electron
27. McMullan D., Scanning, 17(3), 175-185 (2006) Microscopy 1- Basics, Plenum Press (1996)
28. Misra P. and Dubinski M., eds., Ultraviolet Spectroscopy and 40. Zhu J., Gao J. and Wang Y., Synthesis of highly active H2O2
UV Lasers, New York, Marcel Dekker (2002) sensitized sulfated titania nanoparticles with a response to visible
light, J Photochem Photobiol A: Chem., 202, 128-135 (2009)
29. Novak E., Hancz A. and Erdohelyi A., Radiat. Phys. Chem.,
66, 27 (2003) 41. Zworykin V.A., Hillier J. and Snyder R.L., A Scanning electron
microscope, ASTM Bull., 117, 15-23 (1942).
30. Goldstein J., Scanning Electron microscopy and - X-ray
Microanalysis, Plenum Publishers, 68 (2003) (Received 05th February 2021, accepted 10th March 2021)
170You can also read