A contrast-enhanced-CT-based classification tree model for classifying malignancy of solid lung tumors in a Chinese clinical population
←
→
Page content transcription
If your browser does not render page correctly, please read the page content below
Original Article

A contrast-enhanced-CT-based classification tree model for
classifying malignancy of solid lung tumors in a Chinese clinical
population
Xiaonan Cui1,2^, Marjolein A. Heuvelmans3,4, Grigory Sidorenkov3, Yingru Zhao1, Shuxuan Fan1,
Harry J. M. Groen5, Monique D. Dorrius2, Matthijs Oudkerk6, Geertruida H. de Bock3,
Rozemarijn Vliegenthart2, Zhaoxiang Ye1
1
Department of Radiology, Key Laboratory of Cancer Prevention and Therapy, Tianjin Medical University Cancer Institute and Hospital, National
Clinical Research Centre of Cancer, Tianjin, China; 2Department of Radiology, University Medical Center Groningen, University of Groningen,
Groningen, The Netherlands; 3Department of Epidemiology, University Medical Center Groningen, University of Groningen, Groningen,
The Netherlands; 4Department of Pulmonology, Medisch Spectrum Twente, Enschede, The Netherlands; 5Department of Pulmonary Diseases,
University Medical Center Groningen, University of Groningen, Groningen, The Netherlands; 6Faculty of Medical Sciences, University of
Groningen, Groningen, The Netherlands
Contributions: (I) Conception and design: X Cui, Z Ye, R Vliegenthart; (II) Administrative support: Z Ye, R Vliegenthart, MA Heuvelmans; (III)
Provision of study materials or patients: Z Ye; (IV) Collection and assembly of data: X Cui, Y Zhao, S Fan; (V) Data analysis and interpretation: X
Cui, G Sidorenkov; (VI) Manuscript writing: All authors; (VII) Final approval of manuscript: All authors.
Correspondence to: Zhaoxiang Ye, MD. Tianjin Medical University Cancer Institute and Hospital, Huan-Hu-Xi Road, Ti-Yuan-Bei, He Xi District,
Tianjin 300060, China. Email: yezhaoxiang@163.com.

                Background: To develop and validate a contrast-enhanced CT based classification tree model for
                classifying solid lung tumors in clinical patients into malignant or benign.
                Methods: Between January 2015 and October 2017, 827 pathologically confirmed solid lung tumors
                (487 malignant, 340 benign; median size, 27.0 mm, IQR 18.0–39.0 mm) from 827 patients from a dedicated
                Chinese cancer hospital were identified. Nodules were divided randomly into two groups, a training group
                (575 cases) and a testing group (252 cases). CT characteristics were collected by two radiologists, and
                analyzed using a classification and regression tree (CART) model. For validation, we used the decision
                analysis threshold to evaluate the classification performance of the CART model and radiologist’s diagnosis
                (benign; malignant) in the testing group.
                Results: Three out of 19 characteristics [margin (smooth; slightly lobulated/lobulated/spiculated),
                and shape (round/oval; irregular), subjective enhancement (no/uniform enhancement; heterogeneous
                enhancement)] were automatically generated by the CART model for classifying solid lung tumors. The
                sensitivity, specificity, PPV, NPV, and diagnostic accuracy of the CART model is 98.5%, 58.1%, 80.6%,
                98.6%, 79.8%, and 90.4%, 54.7%, 82.4% 98.5%, 74.2% for the radiologist’s diagnosis by using three-
                threshold decision analysis.
                Conclusions: Tumor margin and shape, and subjective tumor enhancement were the most important CT
                characteristics in the CART model for classifying solid lung tumors as malignant. The CART model had
                higher discriminatory power than radiologist’s diagnosis. The CART model could help radiologists making
                recommendations regarding follow-up or surgery in clinical patients with a solid lung tumor.

                Keywords: Pulmonary nodules; classification tree model; prognosis; lung cancer

^ ORCID: 0000-0002-4019-6680.

© Journal of Thoracic Disease. All rights reserved.                     J Thorac Dis 2021;13(7):4407-4417 | https://dx.doi.org/10.21037/jtd-21-588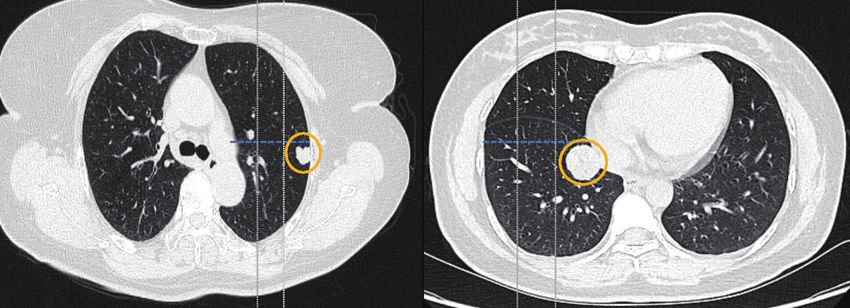
4408                                  Cui et al. A contrast-enhanced CT based classification tree model for classifying solid lung tumors

                Submitted Apr 03, 2021. Accepted for publication Jun 25, 2021.
                doi: 10.21037/jtd-21-588
                View this article at: https://dx.doi.org/10.21037/jtd-21-588

Introduction                                                                   of CT enhancement can differentiate the nature of the lung
                                                                               tumor (12,13). Absence of significant tumor enhancement
The diagnosis of lung nodules is a common and expensive
                                                                               (≤15 HU) at contrast-enhanced CT is strongly predictive of
challenge in medicine. Chest computed tomography (CT)
                                                                               a benign nature (11). Therefore, the use of difference in CT
is widely used for lung disease diagnosis (1,2). Lung nodules
                                                                               density between non-contrast and contrast CT may help to
are divided into solid and sub-solid based on their density
                                                                               establish a classification model to effectively improve the
on CT, and the consensus of multiple guidelines is that
                                                                               diagnosis of pulmonary nodules, especially for patients with
lesions of different densities should be managed differently
                                                                               a large solid tumor considered for surgery.
(3-6). Sub-solid nodules are often considered to be early
                                                                                  Our purpose was to develop and to validate a classification
stage adenocarcinoma (6,7), however, the histologic types
                                                                               tree model based on contrast-enhanced CT characteristics of
of solid nodules or tumors vary widely. The 2015 World
                                                                               solid lung tumors to differentiate between the malignant or
Health Organization Classification of Lung Tumors reports
                                                                               benign nature in clinical preoperative patients.
there are four major histological types of solid pulmonary                        We present the following article in accordance with the
malignancies, including adenocarcinoma, squamous cell                          TRIPOD reporting checklist (available at https://dx.doi.
carcinoma, large cell carcinoma, and small cell carcinoma;                     org/10.21037/jtd-21-588).
and four major types of benign lesions, including pulmonary
hamartoma, inflammatory myofibroblastic tumor, sclerosing
pneumocytoma and granuloma (8). This brings a challenge                        Methods
to the stratification of solid tumors into malignant or benign                 The institutional ethics committee board of Tianjin Medical
based on radiological imaging.                                                 University Cancer Institute and Hospital (No. bc2018039)
   In recent years, research has focused on the work-                          approved this study. All participants signed an informed
up of smaller solid lung nodules. The Fleischner Society                       consent form before participating in this study, and this
2017 guidelines for the management of incidentally                             study conformed to the provisions of the Declaration of
detected pulmonary nodules (4), advises that a solid nodule                    Helsinki (as revised in 2013).
larger than 8 mm with suspicious morphology or upper
lobe location should be considered for CT at 3 months,
positron emission tomography/computed tomography                               Patients
(PET/CT), or tissue sampling. However, the challenge                           A total of 1,789 consecutive patients from Tianjin Medical
that radiologists often face is to give a definitive diagnosis                 University Cancer Institute and Hospital who underwent
of a certain nodule to be malignant or benign, especially                      surgical resection of a lung tumor with postoperative
in cancer centers where patients usually present with                          histopathological confirmation from January 2011 to
larger nodules or masses. Tissue biopsy is limited by                          October 2017 were considered. The inclusion criteria were:
difficulty to access locations and size of the tumor, and has                  (I) solitary solid lung tumor on CT (diameter ≥8 mm);
potential complications such as pulmonary hemorrhage,                          (II) preoperative thin-section non-contrast and contrast-
pneumothorax, and risks associated with general anesthesia                     enhanced CT images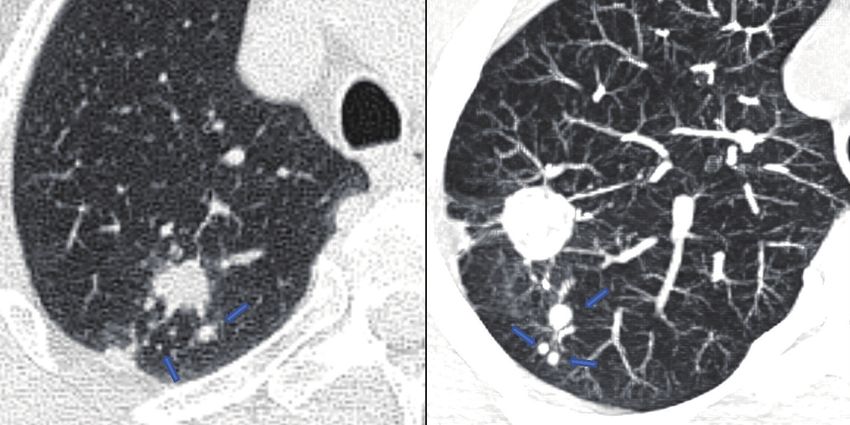
Journal of Thoracic Disease, Vol 13, No 7 July 2021                                                                                  4409

Computed tomography examination                                      Decision analysis for the radiologist’s diagnosis

CT examinations, consisting of an acquisition without                We used the clinical CT report to assess the diagnostic
and with iodine contrast, were performed on Somatom                  performance of radiologist evaluation. All CT diagnostic
Sensation 64 (Siemens Medical Solutions, Forchheim,                  reports were double read by two radiologists at the time
Germany) CT scanner, Lightspeed 16 (GE Medical                       of CT acquisition and assigned to one of five categories:
Systems, Milwaukee, WI), or Discovery CT 750 HD (GE                  (I) benign; (II) probably benign; (III) undetermined; (IV)
Medical Systems). The scan tube voltage was 120 kVp with             probably malignant; (V) high suspicion of malignancy.
automatic tube current modulation. The iodine contrast               These categories represent the radiologist classification
agent Visipaque (Iodixanol, 270 mg/mL) was administered              of malignancy probability of the evaluated nodule in
intravenously through the upper extremity (1.5 mL/kg,                real clinical setting. In total, 27 radiologists in the
injection rate: 2.5 mL/s). The scan range included the               radiology department were involved in CT reporting. In
pulmonary apex level to below the diaphragm, and scanning            this study, we classified into three management groups
was performed 70 seconds after injection of the contrast             defined the radiologist diagnosis risk thresholds based
agent. For the Siemens CT system pitch was 0.95, acquired            on the malignancy probability of the five categories
and reconstructed slice thickness of 1.5 mm, B70f and                (observe =1, indeterminate =2 or 3 or 4, surgery =5). The
B30 reconstruction kernels were used. Pitch for the GE               “Observe” group was recommended for CT follow-up, the
CT systems was 0.984, acquired and reconstructed slice               “indeterminate” group was recommended for further work-
thickness of 1.25 mm, and Stnd and Lung reconstruction               up (short interval CT follow-up, PET-CT or biopsy), and
kernels were used.                                                   the “surgery” group was recommended for surgery.

Evaluation of contrast-enhanced CT characteristics                   Statistical analysis

All contrast-enhanced CT scans were reviewed by two                  We randomly divided the tumors (n=827) into a training
experienced radiologists (6-year and 9 year reading                  group (n=575) and testing group (n=252). Student’s t-test,
experience in chest CT) blindly and independently by using           chi-square test, and Kolmogorov-Smirnov test were used
the RadiAnt DICOM Viewer (version 2020.2). The two                   to assess each indicator in the training and testing group.
radiologists determined the final radiological characteristics       Finally, a classification and regression tree (CART) method
after a mutual consultation. The radiologists evaluated              was constructed to assess variables that might discriminate
the pulmonary solid tumor on pulmonary window setting                between benign and malignant tumors (P value
4410                                  Cui et al. A contrast-enhanced CT based classification tree model for classifying solid lung tumors

 Table 1 Characteristics of patients in the study
 Characteristics                                      Total (n=827)        Training (n=575)              Testing (n=252)             P

 Age, mean (SD) years                                   57.5±9.4               57.7±9.3                     57.0±9.5              0.271a

 Sex, n (%)

     Man                                               466 (56.3)             328 (57.0)                   138 (54.8)             0.543b

     Woman                                             361 (43.7)             247 (43.0)                   114 (45.2)

 Histologic type, n (%)                                                                                                           0.338b

     Malignant                                         487 (58.9)             352 (61.2)                   135 (53.6)

      Adenocarcinoma                                   319 (65.5)             226 (64.2)                    93 (68.9)

      Squamous cell carcinoma                          118 (24.2)              87 (24.7)                    31 (23.0)

      Large cell                                        50 (10.3)              39 (11.1)                    11 (8.1)

     Benign                                            340 (41.1)             223 (38.8)                   117 (46.4)

      Inflammatory pseudotumor                          80 (23.5)              55 (24.7)                    25 (21.4)

      Hamartoma                                        156 (45.9)             101 (45.3)                    55 (47.0)

      Sclerosing pneumocytoma                           54 (15.9)              37 (16.6)                    17 (14.5)

      Tuberculosis                                      50 (14.7)              30 (13.5)                    20 (17.1)
 a                                                                                                   b
  , Student’s t-test (Normally distributed) and Kolmogorov-Smirnov test (non-normally distributed); , Pearson’s chi-square test and Fisher’s
 exact test. HU, Hounsfield units.

as ‘observe’ group, ST2 suggested for further work-up                     statistically significant differences between the training and
(see above), and ST3 advised for surgery, similar to the                  testing group in patient and nodule characteristics.
radiologist’s decision (Appendix 2). Finally, we used the
testing group to validate the discriminatory performance of
                                                                          Development of the CART model for predicting malignant
the CART model. P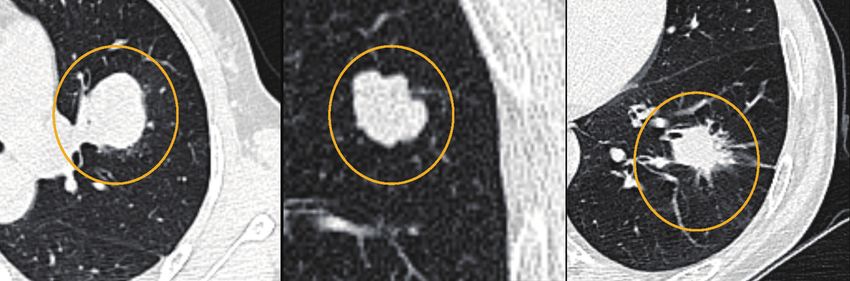
Journal of Thoracic Disease, Vol 13, No 7 July 2021                                                                                         4411

 Table 2 Characteristics of benign vs. malignant tumors in the training group
 Characteristics                              Subgroup                     Malignant (n=352)            Benign (n=223)                P

 Patient age, mean± SD, years                                                   60.2±8.7                   53.9±8.9                0.000a

 Sex, n (%)                                   Man                               227 (64.5)                 101 (45.3)              0.000b

                                              Woman                             125 (35.5)                 122 (54.7)

 Morphological

   Location, n (%)                            Left upper lobe                   103 (29.3)                  59 (26.5)              0.627b

                                              Left lower lobe                   67 (19.0)                   44 (19.7)

                                              Right upper lobe                  91 (25.9)                   52 (23.3)

                                              Right middle lobe                  27 (7.7)                   16 (7.2)

                                              Right lower lobe                  64 (18.2)                   52 (23.3)

   Nodule type, n (%)                         Peripheral                        268 (76.1)                 198 (88.8)              0.000b

                                              Central                           84 (23.9)                   25 (11.2)

   Shape, n (%)                               Round/oval                        180 (51.1)                 154 (69.1)              0.000b

                                              Irregular                         172 (48.9)                  69 (30.9)

   Margin, n (%)                              Smooth                             21 (6.0)                   95 (42.6)              0.000b

                                              Lobulated                         182 (51.7)                  71 (3.18)

                                              Spiculated                        149 (42.3)                  57 (25.6)

   Calcification, n (%)                       No                                311 (88.4)                 176 (78.9)              0.002b

                                              Yes                               41 (11.6)                   47 (21.1)

   Fat, n (%)                                 No                                351 (99.7)                 189 (84.8)              0.000b

                                              Yes                                1 (0.3)                    34 (15.2)

   Necrosis, n (%)                            No                                288 (81.8)                 195 (87.4)              0.073b

                                              Yes                               64 (18.2)                   28 (12.6)

   Cavitation, n (%)                          No                                278 (79.0)                 201 (90.1)              0.000b

                                              Yes                               74 (21.0)                   22 (9.8)

   Air Bronchograms, n (%)                    No                                247 (70.2)                 214 (96.0)              0.000b

                                              Yes                               105 (29.8)                   9 (4.0)

   Pleural indentation, n (%)                 No                                80 (22.7)                  123 (55.2)              0.000b

                                              Yes                               272 (77.3)                 100 (44.8)

   Vascular invasion, n (%)                   No                                247 (70.2)                 222 (99.6)              0.000b

                                              Yes                               105 (29.8)                   1 (0.4)

   Postobstructive pneumonia, n (%)           No                                215 (61.1)                 165 (74.0)              0.001b

                                              Yes                               137 (38.9)                  58 (26.0)

   Satellite nodules, n (%)                   No                                347 (98.6)                 206 (92.4)              0.000b

                                              Yes                                5 (1.4)                    17 (7.6)

 Table 2 (continued)

© Journal of Thoracic Disease. All rights reserved.                    J Thorac Dis 2021;13(7):4407-4417 | https://dx.doi.org/10.21037/jtd-21-588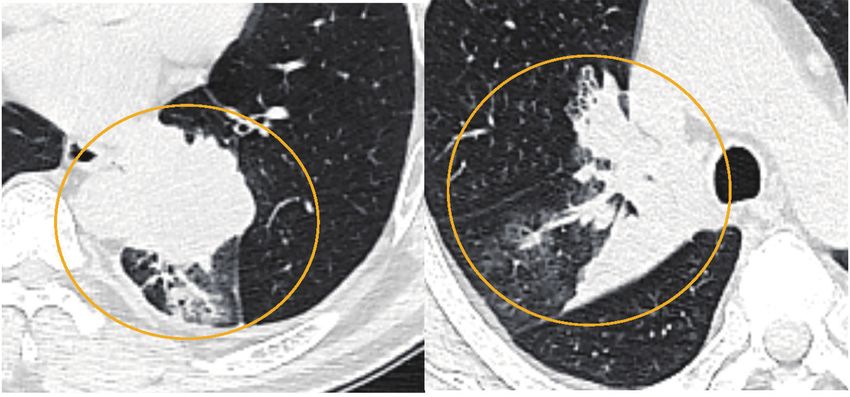
4412                                  Cui et al. A contrast-enhanced CT based classification tree model for classifying solid lung tumors

 Table 2 (continued)

 Characteristics                              Subgroup                  Malignant (n=352)              Benign (n=223)              P

     Pleural effusion, n (%)                  No                            340 (96.6)                    220 (98.7)            0.130b

                                              Yes                            12 (3.4)                      3 (1.3)

     Lymph nodes, n (%)                       No                            248 (70.5)                    218 (97.8)            0.000b

                                              Yes                           104 (29.5)                     5 (2.2)

     Subjective enhancement, n (%)            No                              6 (1.7)                     89 (39.9)             0.000b

                                              Uniform                         3 (0.9)                     38 (17.0)

                                              Heterogeneous                 343 (97.4)                    96 (43.0)

     CT attenuation (HU), mean± SD            Plain CT                      28.6±11.4                    23.0±27.0              0.001a

                                              Enhanced CT                   63.1±19.9                    50.8±40.2              0.000a

                                              Difference in HU              34.5±17.7                    27.9±27.4              0.001a

     Size, median (IQR), mm                   Diameter                   32.0 (23.0–42.8)              17.6 (13.5–28.4)         0.000a

     Radiologist’s diagnosis, n (%)           Observe                        12 (3.4)                     117 (52.5)

                                              Indeterminate                  24 (6.8)                     52 (23.3)

                                              Surgery                       316 (89.8)                    54 (24.2)
 a                                                                                                 b
  , Student’s t-test (Normally distributed) and Kolmogorov-Smirnov test (non-normally distributed); , Pearson’s chi-square test and Fisher’s
 exact test. HU, Hounsfield units.

Validation of the CART models and radiologist’s diagnosis                27.0 mm, IQR 18.0–39.0 mm) in case only CT is available
in the testing group                                                     as a diagnostic tool.
                                                                            Radiological characteristics (nodule type, size, shape,
Both the radiologists and the CART model used three
                                                                         margin and location) and clinical information (age, gender,
thresholds to determine the solid tumor malignancy risk.
                                                                         cancer history, smoking history) have been used to develop
The classification performance of the CART models and
                                                                         classification models (such as the models developed by
radiologist’s diagnosis were evaluated using the testing
group. The sensitivity specificity, PPV, NPV, and diagnostic             Mayo Clinic, Brock University and Veterans Affairs)
accuracy to differentiate malignant from benign tumors                   to predict the probability of malignancy of pulmonary
were 98.5%, 58.1%, 80.6%, 98.6, and 79.8% for CART                       tumors (17-19). However, several previous studies showed
model and 90.4%, 54.7%, 82.4% 98.5% and 74.2% for                        that the performance of these models, especially in large
radiologist’s diagnosis, respectively (Table 3).                         tumors, is moderate (20-23). Our previous study (24),
                                                                         comparing classification models (Veterans Affairs, Mayo,
                                                                         and Brock model) to the diagnosis of the radiologist for
Discussion                                                               differentiation of lung nodules (median size: 17.0 mm, IQR
Three radiological CT characteristics of solid lung lesions              13.0–21.0 mm) into benign and malignant in a Chinese
were shown to have discriminatory ability for malignant                  population, showed a lower discriminatory power for the
and benign lung tumors. These characteristics were:                      three models compared with the radiologist’s diagnosis. In
subjective enhancement, margin and shape. The CART                       that study, less than 15.5% out of 207 malignancies were
model for solid tumors in our clinical population resulted               classified at and above the surgical threshold using the
in a higher diagnostic accuracy compared to radiologist’s                three classification models, while the remaining malignant
diagnosis. Our results suggest that our contrast-enhanced                nodules were considered indeterminate (VA model 44.9%,
CT based CART model can support radiologists in making                   Mayo model 85.5%; Brock model 93.7%). The radiologist’s
a diagnosis decision of solid lung tumors (median diameter               diagnosis showed higher performance contrast to the three

© Journal of Thoracic Disease. All rights reserved.                 J Thorac Dis 2021;13(7):4407-4417 | https://dx.doi.org/10.21037/jtd-21-588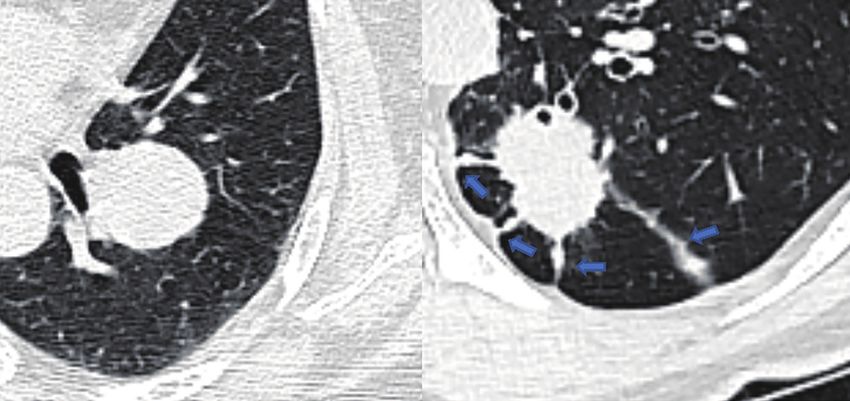
Journal of Thoracic Disease, Vol 13, No 7 July 2021                                                                                           4413

                                                                                          1=M 0=B

                                                                                        Node 0
                                                                                  Category   %          n
                                                                                  0.000     38.8       223
                                                                                  1.000     61.2       352
                                                                                  Total    100.0       575

                                                         0.000
                                                         1.000
                                                                                                           −
                                                                           0=No enhancement 1=Uniform
                                                                          enhancement 2=Heterogeneous
                                                                                  enhancement
                                                                               lmprovement=0.185

                                                                           2                                   1;   0

                                                                       Node 1                               Node 2
                                                                 Category   %      n                  Category   %    n
                                                                 0.000     21.9   96                  0.000     93.4 127
                                                                 1.000     78.1   343                 1.000      6.6 9
                                                                 Total     76.3   439                 Total     23.7 136

                                                                                      −
                                                       0=smooth; 1=Lobulate; 2=Spiculatc
                                                             lmprovement=0.025

                                                             0                              1;   2

                                                        Node 3                       Node 4
                                                  Category   %      n          Category   %           n
                                                  0.000      60.0   27         0.000      17.5       69
                                                  1.000      40.0   18         1.000      82.5       325
                                                  Total       7.8   45         Total     68.5        394

                                                                      −                               +
                                               o=roundioval 1 irregular
                                                lmprovement=0.014

                                              0                           1

                                         Node 5                        Node 6
                                   Category   %    n             Category   %     n
                                   0.000     75.0 27             0.000     0.0    0
                                   1.000     25.0 9              1.000    100.0   9
                                   Total    6.3 36               Total     1.6    9

Figure 1 CART model for the classifying the malignancy of pulmonary solid tumor in the training group. CART, classification and
regression tree.

© Journal of Thoracic Disease. All rights reserved.                       J Thorac Dis 2021;13(7):4407-4417 | https://dx.doi.org/10.21037/jtd-21-588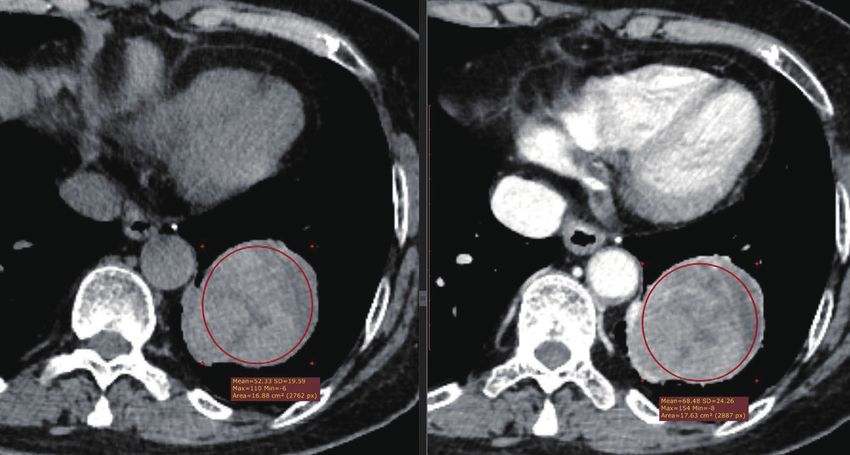
4414                                    Cui et al. A contrast-enhanced CT based classification tree model for classifying solid lung tumors

                                                                                          Heterogeneous enhancement
                                                      None/Uniform enhancement

                                 Shape                                                    Smooth      Lobulate/Spiculate

                               Round/oval               ST1             ST1                ST2               ST3

                                Irregular               ST1             ST1                ST3               ST3

Figure 2 The optimized classification diagram of CART model (ST1 = IF Malignant% ≤ 20%; ST2 = IF 20% < Malignant% < 80%; ST3 =
IF Malignant% ≥ 80). CART, classification and regression tree.

 Table 3 Decision analysis using the three thresholds in the testing group

                                                  Risk threshold for                Pathological results (No. %)              Predictive value
 Method                       Prediction
                                                     malignancy               Benign (n=117)         Malignant (n=135)          (NPV/PPV)

 Radiologist’s diagnosis      Observe                         1               64 (54.7)     T.N         1 (0.7)        F.N         98.5%

                              Indeterminate                2–4                27 (23.1)                12 (8.9)                       –

                              Surgery                         5               26 (22.2)     F.P       122 (90.4)       T.P         82.4%

 CART model                   ST1                         ≤20%                68 (58.1)     T.N         1 (0.7)        F.N         98.6%

                              ST2                        20–80%               17 (14.5)                 1 (0.7)                       –

                              ST3                         ≥80%                32 (27.4)     F.P       133 (98.5)       T.P         80.6%
 P, true positive; T.N, true negative; F.P, false-positive; F.N, false-negative; NPV, negative predictive value; PPV, positive predictive value; 1,
 benign; 2, probably benign; 3, undetermined; 4, probably malignant; 5, high suspicion of malignancy. ST1= IF Malignant% ≤20%; ST2= IF
 20%< Malignant%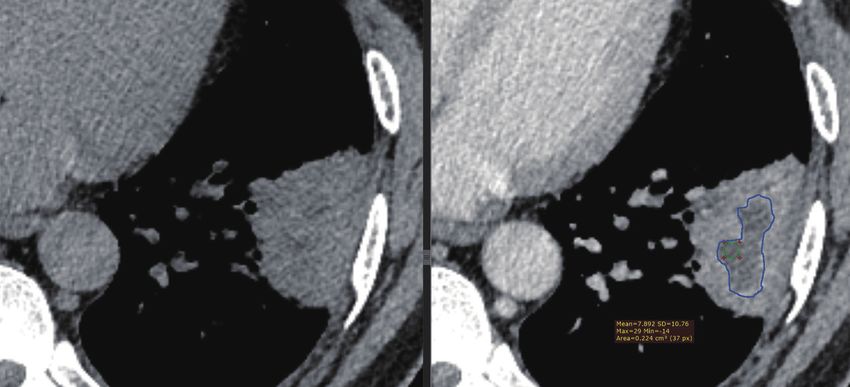
Journal of Thoracic Disease, Vol 13, No 7 July 2021                                                                                   4415

50–60% by using 15HU as enhancement cut-off (13).                     2018YFC1315600 and No. 2016YFE0103000), the Royal
In a study by Yi et al. (26) the sensitivity for malignant            Netherlands Academy of Arts and Sciences (grant number.
nodules was 99% with specificity of 57% by using 30 HU                PSA_SA_BD_01), and the University Medical Center
as the enhancement cut-off value. The authors concluded               Groningen PhD Scholarship program.
that contrast-enhanced CT is highly sensitive to detect
malignant tumors but has low specificity. The latter might
                                                                      Footnote
be explained by the fact that some benign nodules, such as
sclerosing hemangioma (27), can enhance as well. These                Reporting Checklist: The authors have completed the
findings are similar to our study’s training group, 93.7%             TRIPOD reporting checklist. Available at https://dx.doi.
(89/95) of the lesions with no enhancement (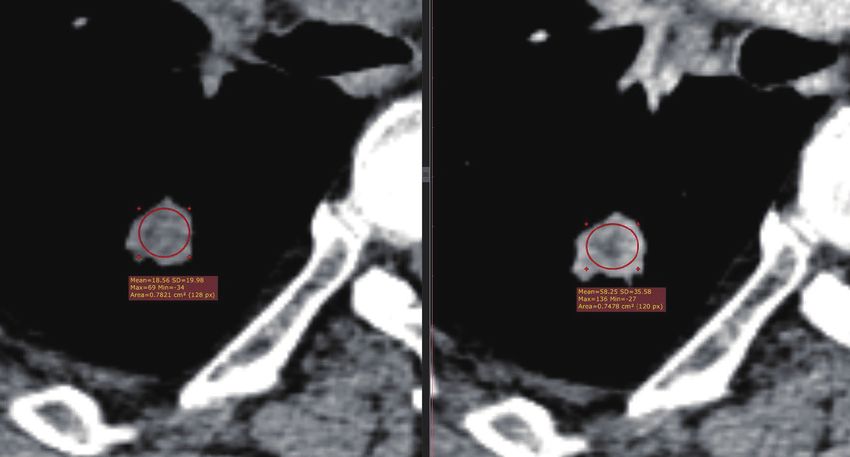
4416                                  Cui et al. A contrast-enhanced CT based classification tree model for classifying solid lung tumors

      DR, Adams AM, et al. Reduced lung-cancer mortality with                  Acute Pancreatitis Using a Decision Tree Model Based on
      low-dose computed tomographic screening. N Engl J Med                    the Revised Atlanta Classification of Acute Pancreatitis.
      2011;365:395-409.                                                        PLoS One 2015;10:e0143486.
3.    Zhou Q, Fan Y, Wang Y, et al. China National Guideline             15.   Kim YH, Kim MJ, Shin HJ, et al. MRI-based decision
      of Classification, Diagnosis and Treatment for Lung                      tree model for diagnosis of biliary atresia. Eur Radiol
      Nodules (2016 Version). Zhongguo Fei Ai Za Zhi                           2018;28:3422-31.
      2016;19:793-8.                                                     16.   Cui X, Heuvelmans MA, Fan S, et al. A Subsolid Nodules
4.    MacMahon H, Naidich DP, Goo JM, et al. Guidelines for                    Imaging Reporting System (SSN-IRS) for Classifying
      Management of Incidental Pulmonary Nodules Detected                      3 Subtypes of Pulmonary Adenocarcinoma. Clin Lung
      on CT Images: From the Fleischner Society 2017.                          Cancer 2020;21:314-325.e4.
      Radiology 2017;284:228-43.                                         17.   Swensen SJ, Silverstein MD, Ilstrup DM, et al. The
5.    Lung CT Screening Reporting & Data System (Lung-                         probability of malignancy in solitary pulmonary nodules.
      RADS). Available online: https://www.acr.org/Clinical-                   Application to small radiologically indeterminate nodules.
      Resources/Reporting-and-Data-Systems/Lung-Rads                           Arch Intern Med 1997;157:849-55.
6.    Callister ME, Baldwin DR, Akram AR, et al. British                 18.   McWilliams A, Tammemagi MC, Mayo JR, et al.
      Thoracic Society guidelines for the investigation and                    Probability of cancer in pulmonary nodules detected on
      management of pulmonary nodules. Thorax 2015;70 Suppl                    first screening CT. N Engl J Med 2013;369:910-9.
      2:ii1-ii54.                                                        19.   Gould MK, Ananth L, Barnett PG, et al. A clinical
7.    Travis WD, Brambilla E, Noguchi M, et al. International                  model to estimate the pretest probability of lung cancer
      association for the study of lung cancer/american thoracic               in patients with solitary pulmonary nodules. Chest
      society/european respiratory society international                       2007;131:383-8.
      multidisciplinary classification of lung adenocarcinoma. J         20.   Isbell JM, Deppen S, Putnam JB Jr, et al. Existing general
      Thorac Oncol 2011;6:244-85.                                              population models inaccurately predict lung cancer risk in
8.    Travis WD, Brambilla E, Nicholson AG, et al. The                         patients referred for surgical evaluation. Ann Thorac Surg
      2015 World Health Organization Classification of Lung                    2011;91:227-33; discussion 233.
      Tumors: Impact of Genetic, Clinical and Radiologic                 21.   Perandini S, Soardi GA, Motton M, et al. Limited
      Advances Since the 2004 Classification. J Thorac Oncol                   value of logistic regression analysis in solid solitary
      2015;10:1243-60.                                                         pulmonary nodules characterization: a single-center
9.    Ozeki N, Iwano S, Taniguchi T, et al. Therapeutic surgery                experience on 288 consecutive cases. J Surg Oncol
      without a definitive diagnosis can be an option in selected              2014;110:883-7.
      patients with suspected lung cancer. Interact Cardiovasc           22.   Iaccarino JM, Simmons J, Gould MK, et al. Clinical
      Thorac Surg 2014;19:830-7.                                               Equipoise and Shared Decision-making in Pulmonary
10.   Merritt RE, Shrager JB. Indications for surgery in patients              Nodule Management. A Survey of American Thoracic
      with localized pulmonary infection. Thorac Surg Clin                     Society Clinicians. Ann Am Thorac Soc 2017;14:968-75.
      2012;22:325-32.                                                    23.   Tanner NT, Porter A, Gould MK, et al. Physician
11.   Cui X, Han D, Heuvelmans MA, et al. Clinical                             Assessment of Pretest Probability of Malignancy and
      characteristics and work-up of small to intermediate-sized               Adherence With Guidelines for Pulmonary Nodule
      pulmonary nodules in a Chinese dedicated cancer hospital.                Evaluation. Chest 2017;152:263-70.
      Cancer Biol Med 2020;17:199-207.                                   24.   Cui X, Heuvelmans MA, Han D, et al. Comparison of
12.   Schillaci O, Travascio L, Bolacchi F, et al. Accuracy                    Veterans Affairs, Mayo, Brock classification models and
      of early and delayed FDG PET-CT and of contrast-                         radiologist diagnosis for classifying the malignancy of
      enhanced CT in the evaluation of lung nodules:                           pulmonary nodules in Chinese clinical population. Transl
      a preliminary study on 30 patients. Radiol Med                           Lung Cancer Res 2019;8:605-13.
      2009;114:890-906.                                                  25.   Choi Y, Gil BM, Chung MH, et al. Comparing
13.   Swensen SJ, Viggiano RW, Midthun DE, et al. Lung                         attenuations of malignant and benign solitary
      nodule enhancement at CT: multicenter study. Radiology                   pulmonary nodule using semi-automated region of
      2000;214:73-80.                                                          interest selection on contrast-enhanced CT. J Thorac
14.   Yang Z, Dong L, Zhang Y, et al. Prediction of Severe                     Dis 2019;11:2392-401.

© Journal of Thoracic Disease. All rights reserved.                 J Thorac Dis 2021;13(7):4407-4417 | https://dx.doi.org/10.21037/jtd-21-588
Journal of Thoracic Disease, Vol 13, No 7 July 2021 4417
26. Yi CA, Lee KS, Kim EA, et al. Solitary pulmonary 2004;233:191-9.
nodules: dynamic enhanced multi-detector row CT 27. Doyle DJ, Khalili K, Guindi M, et al. Imaging features
study and comparison with vascular endothelial of sclerosed hemangioma. AJR Am J Roentgenol
growth factor and microvessel density. Radiology 2007;189:67-72.
Cite this article as: Cui X, Heuvelmans MA, Sidorenkov
G, Zhao Y, Fan S, Groen HJM, Dorrius MD, Oudkerk M,
de Bock GH, Vliegenthart R, Ye Z. A contrast-enhanced-CT-
based classification tree model for classifying malignancy of
solid lung tumors in a Chinese clinical population. J Thorac Dis
2021;13(7):4407-4417. doi: 10.21037/jtd-21-588
© Journal of Thoracic Disease. All rights reserved. J Thorac Dis 2021;13(7):4407-4417 | https://dx.doi.org/10.21037/jtd-21-588Supplementary
Appendix 1 Evaluation of the CT characteristics
A B
Figure S1 Distance to costal pleura (peripheral/non-peripheral). (A) Peripheral nodules: The distance to costal pleural was
1/3 from total distance
hilum-costal pleura.
A B
Figure S2 Shapes (round/oval, irregular). (A) Round/Oval; (B) irregular.
A B C
Figure S3 Margins (smooth, lobulated, spiculated). (A) Smooth; (B) lobulated; (C) spiculated.
A B
Figure S4 Pleural indentation. (A) There is no pleural indentation; (B) nodules adhering to pleura or pleural indentation with
>1 stripe (blue arrows).
© Journal of Thoracic Disease. All rights reserved. https://dx.doi.org/10.21037/jtd-21-588A B
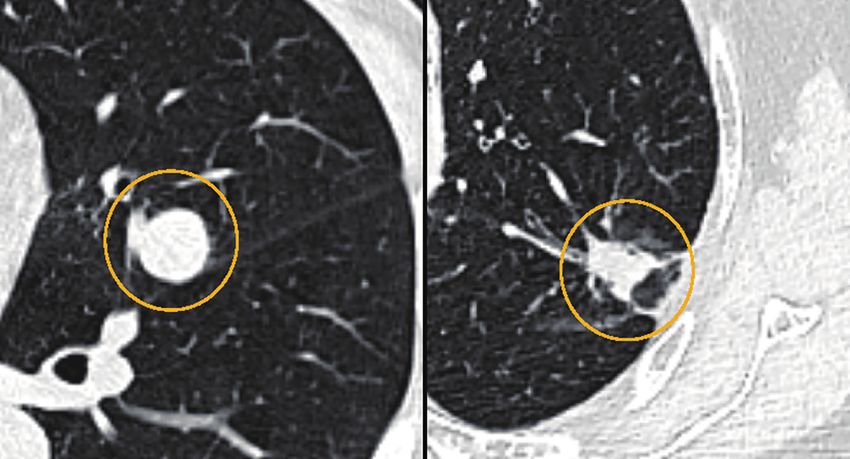
Figure S5 Vascular invasion. (A) There is no vascular invasion; (B) coexistence of irregular vascular dilation or vascular
convergence from multiple supplying vessels (blue arrow).
A B
Figure S6 Necrosis. Non-enhanced liquid area after enhancement (blue area).
A B
Figure S7 Satellite nodules. Satellite nodules appear around the tumor (blue arrow).
A B
Figure S8 Postobstructive pneumonia. Ground glass infiltration and atelectasis around tumor.
© Journal of Thoracic Disease. All rights reserved. https://dx.doi.org/10.21037/jtd-21-588A
B
C
Figure S9 Subjective enhancement (uniform/heterogeneous/no). (A) The tumor enhanced difference is large than 15 HU with
uniform enhancement; (B) the tumor enhanced difference is large than 15 HU with heterogeneous enhancement; (C) the
tumor enhanced difference is less than 15 HU.
© Journal of Thoracic Disease. All rights reserved. https://dx.doi.org/10.21037/jtd-21-588Appendix 2 Case examples Figure S10 A 42 years old male patient with a solid oval, slightly lobulated tumor (15×14 mm2) located in the left upper lobe. The mean density of the nodule was 38.8 Hounsfield Units on 5 CT without iodine contrast, and 39.1 Hounsfield Units after contrast (no enhancement). Radiologist’s diagnosis: Benign; CART model classification: ST1; Histology: hamartoma. Figure S11 A 53 years old female patient with a solid round, smooth tumor (22×21 mm2) located in the left lower lobe. The mean density of the nodule was 33.9 Hounsfield Units on CT without iodine contrast, and 94.1 Hounsfield Units after contrast (uniform-enhancement). Radiologist’s diagnosis: Benign; CART model classification: ST1; Histology: sclerosing pneumocytoma. Figure S12 A 60 years old male patient with a solid irregular, lobulated tumor (23×19 mm2) located in the right lower lobe. The mean density of the nodule 12 was 18.6 Hounsfield Units on CT without iodine contrast, and a density of 58.3 Hounsfield Units after contrast (uneven-enhancement). Radiologist’s diagnosis: malignant; CART model classification: ST3; Histology: squamous cell carcinoma. © Journal of Thoracic Disease. All rights reserved. https://dx.doi.org/10.21037/jtd-21-588
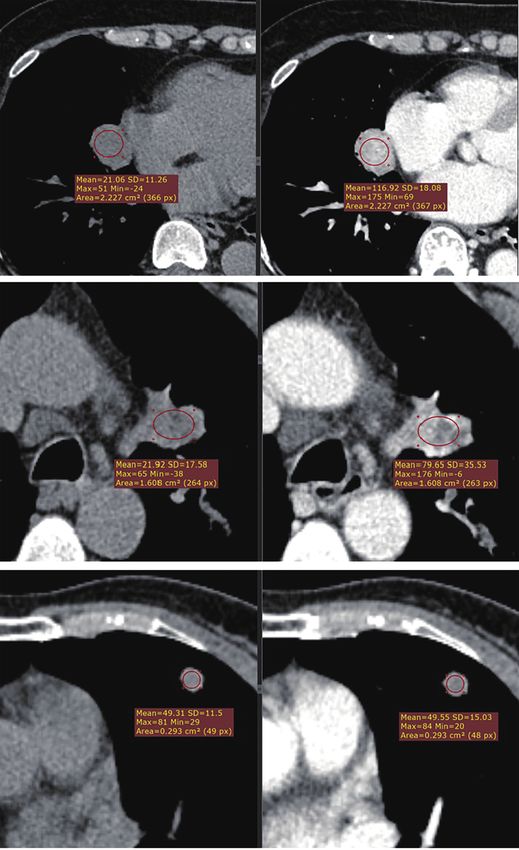
Figure S13 A 78 years old female patient with a solid round, smooth tumor (60×51 mm2) located in the left lower lobe. The
mean density of the nodule 16 was 52.3 Hounsfield Units on CT without iodine contrast, with uneven-enhancement 68.5
Hounsfield Units after contrast. Radiologist’s diagnosis: probably benign; CART model classification: ST2; Histology:
sclerosing.

Figure S14 A 56 years old female patient with a solid round, smooth tumor (18×16 mm2) located in the right lower lobe. The
mean density of the nodule 20 was 15.1 Hounsfield Units on CT without iodine contrast, and uneven-enhancement 61.7
Hounsfield Units after contrast. Radiologist’s diagnosis: Probably malignancy; CART model classification: ST2; Histology:
adenocarcinoma.

© Journal of Thoracic Disease. All rights reserved.                                      https://dx.doi.org/10.21037/jtd-21-588
You can also read


