Economic Sustainability Facts & Figures Update - Wokingham ...
←
→
Page content transcription
If your browser does not render page correctly, please read the page content below
Economic Sustainability Facts & Figures Update
October 2019 – March 2020
Key Changes
The COVID-19 Pandemic has led to lockdown in the UK with significant impacts on the
economy. A third of the UK’s workforce is likely to be unemployed or furloughed in the
immediate future.
The UK economy fell by 2% in the first quarter of 2020. This is rapid shrinkage not seen since
the financial crisis and reflects just one week of lockdown. GDP is set to fall by between 10%
and 35% in Q2.
The UK formally left the EU on 31st January 2020 and has entered an 11 month transition
period, during which trade deals will be negotiated. This will end on December 31st 2020 and
is currently not going to be extended. Economic uncertainty is set to return on the run up to
this date.
The UK saw volatile GDP growth over the course of 2019, largely due to uncertainty over
Brexit.
The Impact of the COVID-19 Outbreak on the UK Economy
The timeline of policy measures responding to COVID-19
Budget 11th March contained £12 billion package to tackle the coronavirus.
Further support measures worth £20 billion were announced on 17th March and government
announced guaranteed £330 billion of bank lending to businesses.
Coronavirus job retention scheme was introduced on 20th March1. Government is to pay
grants to companies to cover 80% of employees’ salary (up to £2,500 per month) for 3
months2. This scheme has now been extended to October with companies asked to share the
costs from August.
20th March the UK Government announced all pubs, bars, restaurants, gyms, theatres and
cinemas were to close.
23rd March it was announced that the UK was going into lockdown, enforcing social distancing,
self-isolation and previous restrictions were tightened on businesses to include all non-
essential shops3.
Help for the self-employed was announced 26th March in the form of a grant covering up to
80% of average monthly profits over previous three years, up to £2,500 a month. The scheme
is open to those trading profits up to £50,000.
10th May Boris Johnson announced a change in message from ‘Stay at Home’ to ‘Stay Alert’
and called for those who cannot work from home, namely in the construction and
manufacturing industries, to return to work whilst maintaining social distancing from 13th May
2020. This is the first stages of reopening the economy.
1 https://www.gov.uk/guidance/claim-for-wage-costs-through-the-coronavirus-job-retention-scheme
2 https://www.britishchambers.org.uk/news/2020/04/bcc-responds-to-extension-of-furlough-scheme
3 https://www.businessinsider.com/uk-pubs-restaurants-gyms-told-to-shut-down-to-fight-coronavirus-pandemic-2020-
3?r=US&IR=T
1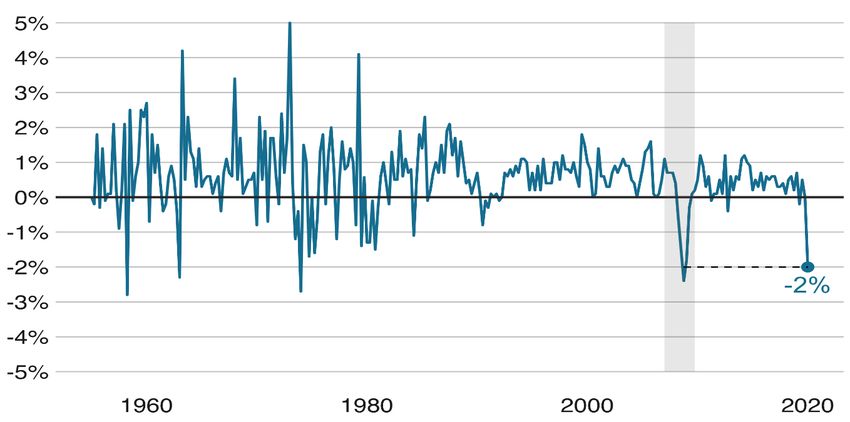
Berkshire Growth Hub has launched free coronavirus advice services to further support local
businesses, the Coronavirus Information & Resource Portal and free one-to-one advice
sessions.4
CODIV-19 Economic Statistics
Traditional ways of economic reporting, such as quarterly data used in this report, do not yet reflect
the current CODIV-19 situations significant impact on the economy. Below are some estimated
statistics from more timely data sources.
The economy fell by 2% in Q1 2020, reflecting just one week of lock down at the end of March.
The graph below shows that this is the fastest pace of economic shrinkage since the financial
crisis which is highlighted on the graph below5.
The economic shock currently looks to be double what was seen during the 2008 global
financial crisis6.
GDP is predicted to fall by between 10% and 35% this quarter (April-June)6.
Government borrowing is likely to be up by between 10% and 35% of GDP this year. This is
likely to reach 100% of GDP by the end of forecasted scenarios and lockdown measures7.
Likely that a third of the workforce will be unemployed or furloughed for the immediate future
and will have huge impact on the labour market (EY). 8 million are predicted to be on the
furlough scheme at some point7.
More than 1.5 million new claims have been made to Universal Credit since 1 March 2020
(DWP).
A survey by BCC revealed 71% of survey respondents have furloughed staff, up from 66% in a
week, as cash flow remains a significant concern for many businesses with 6 in 10 having less
than three months’ cash in reserve8.
Quarter-on-quarter percentage change in the UK economy over time
Source: ONS via BBC (2020)
4 https://www.berkshirebusinesshub.co.uk/uncategorised/berkshire-growth-hub-launches-free-coronavirus-advice-services-
support-local-businesses
5 https://www.bbc.co.uk/news/business-52641807
6 EY ITEM Club Spring 2020 Forecast
7 Resolution Foundation
8 https://www.britishchambers.org.uk/news/2020/04/bcc-coronavirus-business-impact-tracker-more-than-70-per-cent-of-
firms-surveyed-have-furloughed-staff-as-scheme-goes-live
2 Centre for Cities research suggests Reading is sixth least likely to suffer job losses and
furloughing due to COVID-19, a significant statistic due to the blurred geographies of business
activity in the Reading/Wokingham Borough area.
Brexit Monitoring
Brexit Timeline of Events
Boris Johnson won the general election on the 12th December 2019 by a significant majority,
securing much of the labour heartland seats. This election result secured the UK’s position in
regards to leaving the European Union at the start of 2020.
The UK formally left the EU as planned on the 31st January 2020. This will now be followed by
an 11 month transition period which will come to an end on the 31st December 2020 when
the UK will leave the single market and the customs union9.
During this period discussion will continue between the UK and the EU to negotiate a free
trade deal and the UK will continue its usual trade relationship with the EU.
While the certainty of the majority election result was expected to stabilise the economy
through business and consumer confidence, the continued uncertainty produced through the
transition period and upcoming negotiations are predicted to cause uncertainty later on in the
year, as the prospect of a no deal trade scenario becomes a reality again.
Brexit Statistics
Confidence for small businesses hit an 8 year low in the run up to the Christmas Elections with
worries over rising labour costs and uncertainty around global trade. The proportion of small
businesses reporting a fall in profits in the fourth quarter reached a five-year high of 42% while
the number enjoying an increase hit a five-year low of just 27%.10
Directly after the decisive election result, consumer confidence was high with a three-point
increase in the consumer confidence index compared to November, although it remains in the
negative territory.11
Although the economy received a boost post-election, there are fears that the confidence will
not translate to meaningful boost in growth, with uncertainty set to return as the transition
period comes to an end.12
Downing Street has said the UK will not extend the Brexit transition period due to COVID-19.
Although all in-person talks have been cancelled, negotiations with the EU are ongoing.13
National Economy
As mentioned above, the UK economy has contracted by 2% in Q1 2020 with more shrinkage forecast
for Q2. GDP growth was particularly volatile throughout 2019, as shown on the graph overleaf. This is
likely to be reflecting changes in the timing of activity related to the UK’s original planned exit dates
from the EU.
The UK economy saw no growth in the final quarter of 2019 with GDP remaining flat October
to December. When compared with the same quarter a year ago, UK GDP increased by 1.1%
in Quarter 4 201914.
9 https://www.bbc.co.uk/news/uk-politics-32810887
10 https://www.telegraph.co.uk/business/2019/12/30/small-business-confidence-plunges-eight-year-low/
11 https://www.marketingweek.com/consumer-confidence-december-2019/
12 EY ITEM Club Winter 2020 Forecast
13 https://www.bbc.co.uk/news/uk-politics-52313042
14https://www.ons.gov.uk/economy/grossdomesticproductgdp/bulletins/quarterlynationalaccounts/octobertodecember201
9#headline-gdp
3 The services sector provided a positive contribution to growth in the output approach to GDP
in Quarter 4 2019, however, this was offset by a negative contribution from the production
sector.
Government consumption and trade added to growth in the expenditure approach to GDP in
Quarter 4 2019, while private consumption and gross capital formation subtracted from
growth.
UK GDP increased by 1.4% between 2018 and 2019, unrevised from the first quarterly
estimate.
Services output increased by 0.2% in Quarter 4 (Oct to Dec) 2019. Production output fell by
0.7% in Quarter 4 2019, driven by declines in manufacturing, and mining and quarrying.
Meanwhile, construction output decreased by 0.1% in the fourth quarter.
Currently, due to COVID-19 output in the heavily impacted services sector is likely to have
fallen by 70% to 90%.
For the period December 2019 to February 2020, prior to the implementation of the
coronavirus (COVID-19) social distancing measures, the UK employment rate was estimated
at a record high of 76.6%, 0.4 percentage points higher than a year earlier and 0.2 percentage
points up on the previous quarter15.
The UK unemployment rate was estimated at 4.0%, largely unchanged compared with a year
earlier and 0.1 percentage point higher than the previous quarter.
Regional Economy
The South East economy is valued at over £240 billion GVA. The South-East is forecast to
deliver the highest economic growth among the 12 UK regions in 2019 after an already strong
performance in 2018.
Within the South East, Berkshire’s high performing economy is worth over £35 billion per
annum, making a net contribution to UK plc; a disproportionately large contribution of
economic value to the regional economy. 16
15https://www.ons.gov.uk/employmentandlabourmarket/peopleinwork/employmentandemployeetypes/bulletins/employm
entintheuk/latest
16 https://www.berkshirebusinesshub.co.uk/about/why-berkshire-is-best-for-business
4 The South East region is set for a period of continued growth over the next decade (Figure 3)
due to the regions key assets including high levels of manufacturing output, higher levels of
professional, technical and service growth. The region is also second to London in terms of the
highest education levels in the UK.17
In terms of reliance to the COVID-19 impact on the economy, Reading is resilient according to
Centre for Cities, due to the cities low share of exporting industries as a percentage of its
labour market.18
Local Economy
1. Employment
(1) Employment Summary
Wokingham had an unemployment rate of 2.1% and an employment rate of 81.1% (Dec 2019).
Wokingham’s ‘All Claimant Count’ has grown marginally but remains the lowest compared to
surrounding local authorities.
Full-time working residents of Wokingham take home a greater gross weekly pay than the
regional or national average but with a prominent gender pay gap.
Employment statistics did not see drastic changes since last reported in June 2019. Latest figures from
December 2019 saw that Wokingham Borough had a low unemployment rate of 2.1% compared with
the rest of the South East (3.0%) and nationwide (3.9%). Employment rates were 81.1% in Wokingham,
79.5% across the South East region and 75.9% nationwide19.
Employment by occupation has not changed hugely over 2019. The highest proportion of the
boroughs workforce is still employed in managerial, senior official, professional, associate professional
and technical roles, accounting for 63.8%. An average of 47.5% of Great Britain’s workforce are
employed in this sector. 8.3% of Wokingham Borough’s residents working as plant and machine
operatives or in Elementary Occupations (including door-to-door sales, cleaning, caretakers, delivery
staff and refuse collectors). This is significantly less than the regional (13.4%) and national averages
(16.5%).
Earnings for Wokingham Borough’s highly qualified population are high compared to the regional and
national averages. The gross weekly pay for full-time workers in Wokingham Borough (2019) was
£732.3. For the South East earnings were £636.0 and £587.0 in Great Britain, a comparison can be
seen in the graph overleaf. The gender pay gap of full-time workers remains particularly prominent in
the Wokingham Borough, compared to the regional and national averages, with men earning a gross
weekly average of £250 more than women last year.
17 https://www.pwc.co.uk/who-we-are/regional-sites/south-east/press-releases/south-east-forecast-as-uks-top-growth-
region-for-2019--pwc-econo.html
18 https://www.centreforcities.org/blog/what-does-the-covid-19-crisis-mean-for-the-economies-of-british-cities-and-large-
towns/#_ftnref1
19 https://www.nomisweb.co.uk/reports/lmp/la/1946157290/report.aspx?
5Full Time Weekly Earnings of Residents (£)
800
700
600
500
400
300
200
100
0
2006 2008 2010 2012 2014 2016 2018 2020
Wokingham South East Great Britain
Source: Nomisweb (2020)
The claimant count in Wokingham Borough is 1.1% (1,135 people) as of March 2020. This data is likely
not to be reflecting the suspected increase in claimants that is predicted to have occurred at the end
of March. Comparison to surrounding local authority as well as the region and country can be seen in
the graph below.
Claimants as a Percentage of Residents
Great Britain
Slough
Reading
South East
Bracknell Forest
West Berks
RBWM
Wokingham
0.00% 0.50% 1.00% 1.50% 2.00% 2.50% 3.00% 3.50%
Source: Nomisweb (2020)
The 50+ claimant count for Wokingham Borough has maintained at 0.9%. The South East currently
stands at 1.8%, and for Great Britain this is 2.5%. The graph overleaf shows the Wokingham Borough
50+ claimants since December 2017, compared with those in the South East and Great Britain.
6Claimant Count of 50+ Residents (%)
3
2.6
2.5
2.5 2.3 2.3
2.2
2.1 2.1
2
2 1.9
1.8
1.7
1.6 1.6
1.5 1.4
1.3 1.3 1.3
1.2
1 0.9 0.9 0.9
0.8 0.8
0.7
0.6 0.6
0.5
0.5
0
Mar-18
May-18
Nov-18
Mar-19
May-19
Nov-19
Mar-20
Oct-19
Jun-18
Jul-18
Oct-18
Jul-19
Jun-19
Dec-17
Jan-18
Feb-18
Apr-18
Sep-18
Dec-18
Jan-19
Feb-19
Apr-19
Sep-19
Dec-19
Jan-20
Feb-20
Aug-18
Aug-19
Wokingham South East Great Britain
Source: Nomisweb (2020)
NEET figures in Wokingham are low compared with both the South East and England. As of February
2019 (latest figures) only 1.1% of young people between the ages of 16-17 being NEET, well below
regional and national averages20. Wokingham has the lowest average NEET figures in the region, joint
with West Berkshire and Windsor and Maidenhead. The annual NEET briefing, concluded that the
NEET rate across the UK remained stable for the overall 16-24 and 18-24 age groups but increased
slightly for 16/17 year olds in 201921.
Table 1: The NEET Residents of Wokingham Borough and surrounding areas (2019)
Area 16-17 NEET (including Known 16-17 year olds
cohort unknown) NEET (%) not known (%)
England 1,119,100 61,830 2.6% 2.9%
South East 177,690 9,830 2.4% 3.2%
Bracknell Forest 2,180 210 2.5% 7.0%
Reading 2,960 220 4.2% 3.3%
Slough 3,720 150 3.1% 0.8%
West Berkshire 3,240 50 1.1% 0.6%
Windsor & Maidenhead 2,900 170 1.1% 4.8%
Wokingham 3,400 150 1.1% 3.4%
Source: nomis.web.uk (2019)
Qualification Levels of residents in Wokingham Borough are high compared to other areas, which can
be seen on the graph overleaf. Only 4.4% of the population do not hold any qualifications, compared
to the national average of 7.7%. 53.6% of residents have a NVQ Level 4 or above as of December
201919.
20 https://www.gov.uk/government/publications/neet-and-participation-local-authority-figures
21https://assets.publishing.service.gov.uk/government/uploads/system/uploads/attachment_data/file/869804/NEET_statisti
cs_annual_brief_2019_statistical_commentary.pdf
7Comparison of Qualification Levels as % of Residents
100
90
80
70
60
50
40
30
20
10
0
No Qualifications Other NVQ1 and above NVQ2 and above NVQ3 and above NVQ4 and above
Qualifications
RBWM Wokingham Reading West Berks South East Bracknell Slough Great Britain
Source: Nomisweb (2020)
2. Business
(2) Business Summary
Business confidence across the UK has seen its largest quarterly fall on record going into Q1 of
2020 after a rise in confidence at the end of 2019 following the general election.
This boost to confidence was not felt to a high degree in the Thames Valley where businesses saw
the second largest deterioration of confidence on record (report published January 2020).
Business specialisms in Wokingham Borough are as follows:
Information and Communication (16.3%)
Professional, Scientific and Technical (14%)
Administration and Support Service Activities (12.8%)22
The number of firms operating in the borough has increased in 2019 from the year before.
Wokingham Borough is part of the strong local economy within Berkshire and is home to many large,
well established transnational corporations. The table below shows how the borough is attracting
increasing numbers of enterprises year on year. Berkshire’s businesses are forecasted for continued
growth by the Thames Valley Berkshire Local Enterprise Plan.
The Number of Enterprises active in Wokingham Borough (2019)
Type of Business Number of Enterprises in Change since 2018
2019
Micro (0-9) 8,070 +210
Small (10-49) 620 +15
Medium (50-249) 125 +5
Large (250+) 50 +5
Source: Nomisweb (2020)
22 https://www.nomisweb.co.uk/reports/lmp/la/1946157290/printable.aspx
8Business Confidence is a key indicator as to the economic health of the UK in these unprecedented
times of government intervention during the COVID-19 pandemic as well as the uncertainty of the
Brexit transition period. Business confidence across the UK has seen its largest quarterly fall on record
from Q4 2019 to Q1 2020.23
Nationally, business confidence saw a rise in Q4 2019 after the decisive general election. 53%
of Chief Financial Officers said they were more optimistic about the financial prospects of their
company.
Q1 2020 has seen a drastic reversal in confidence as 84% of CFOs reported that they are less
optimistic about the prospects for their company than they were three months ago.
The Thames Valley Business Barometer report24 published in January 2020 saw the highest
deterioration in economic confidence during 2019 despite a slight increase during second half
of the year. Although improved, this is the second biggest deterioration of confidence levels
ever recorded.
In the Thames Valley, economic confidence among business leaders has dropped over the last
six months with 54% reporting confidence had deteriorated whilst only 6% stating it had
improved. The remaining 40% stated their confidence remained the same.
3. Housing
(3) Housing Summary
Lockdown measures have stalled the housing market after a promising start to the year, the best
since 2016. Therefore there is no current meaningful average housing prices available, an
estimate is below based on the small numbers of houses coming to market.
On 13th May, estate agents were advised to return to work and so the market should begin to
cover.
Economic forecasts do not predict a long term strain on the housing market due to lockdown
measures.
House Prices
National house prices had the best start to a year since 2016 in 2020 according to Rightmove’s Latest
House Price Index. However this has quickly moved on to new sales being almost impossible. The
lockdown measures have meant the housing market has halted. However estate agents have now
been given government advice to return to work on 13th May 2020 whilst maintaining social distancing
measures25.
Pre-lock down sales agreed prior to 23rd March were up 11% on the same period last year.
Existing sellers stay on the market, with total available stock for sale down just 2.6% since
lockdown.
The average asking price of the lessening number of properties coming to market in our
reporting period from 8th March to 11th April saw a monthly price fall of 0.2% to £311,950,
with the annual rate of increase from last April being 2.1%. Monthly and annual changes to
national average asking prices can be seen in the graph and table below, respectively. Please
note that there are not enough properties coming to the market to provide meaningful new
seller asking prices in April 2020 due to COVID-19.
23 https://www.insidermedia.com/news/national/record-fall-in-uk-business-confidence-deloitte
24 https://www.bdo.co.uk/getmedia/58494a7d-deb9-4764-8c4f-8a7925b9bdef/Thames-Valley-Business-Barometer-January-
2020.aspx
25 https://www.rightmove.co.uk/news/house-price-index/
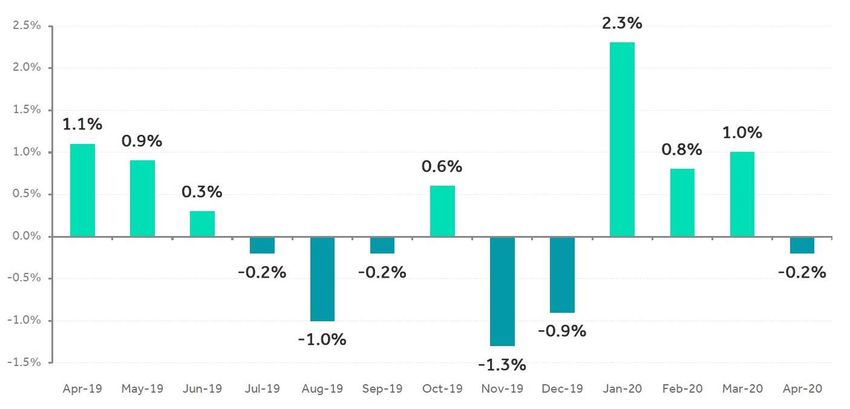
9Monthly Percentage Change in National Average Asking Prices April 2019 – April 2020
Source: Rightmove (2020)
Visits to the Rightmove webpage fell by around 40% at the time of the lockdown
announcement but has now started to recover slowly across the last week of April.
Savills UK Housing Market Update anticipates transactions in 2020 to fall to 20%-40% of the
five year average and recover to 60%-80% of this by January 2021.
The Savills Housing Market Update Report expects to see price falls of -5% to -10% in the short
term after house prices rose by 0.9% nationwide on average, reflecting pre-lockdown
confidence. This forecast depends on short sharp economic downturn and may change as the
economic outlook is constantly shifting.
Local
House prices in the borough have remaining steady over the last 12 months. Latest data from the HM
Land Registry shows that average price of all properties in Wokingham borough was £413,115 in
February 202026. This is a 1.8% (+£7,390) annual change from April 2019 when average house prices
were £405,725. The average house prices in Wokingham Borough remain significantly higher than the
national average at £209,399 in February 2020. The table below shows the average asking prices for
different property types since July 2016 in Wokingham Borough.
National Average Asking Prices July 2019 – April 2020
Month Average Asking price Annual Change
July 2019 £308,692 -0.2%
August 2019 £305,500 +1.2%
September 2019 £304,770 +0.2%
October 2019 £306,712 -0.2%
November 2019 £302,808 0.3%
December 2019 £300,025 0.8%
January 2020 £306,810 2.7%
February 2020 £209,399 2.9%
March 2020 £312,625 3.5%
April 2020 £311,950 2.1%
Source: Rightmove (2020)
26https://landregistry.data.gov.uk/app/ukhpi/browse?from=2019-04-
01&location=http%3A%2F%2Flandregistry.data.gov.uk%2Fid%2Fregion%2Fwokingham&to=2020-04-01
10Average Asking Prices in Wokingham Borough July 2016 – January 2020
Month Average price Average price Average price Average price Average price
All property Detached Semi-detached Terraced houses Flats and
types houses houses maisonettes
Jul 2016 £421,143 £627,274 £399,208 £315,401 £231,786
Jan 2017 £418,666 £626,513 £394,637 £311,217 £232,237
Jul 2017 £416,838 £621,954 £393,886 £309,259 £232,577
Jan 2018 £421,910 £630,923 £399,809 £312,388 £233,520
Jul 2018 £413,433 £620,235 £390,261 £306,780 £228,105
Jan 2019 £399,842 £601,993 £378,401 £295,430 £218,993
Feb 2019 £404,665 £608,508 £383,204 £298,804 £222,113
Mar 2019 £402,724 £605,585 £381,608 £297,806 £220,283
Apr 2019 £408,101 £612,392 £387,050 £302,971 £222,866
May 2019 £403,165 £604,657 £382,822 £300,130 £219,319
Jun 2019 £408,287 £612,329 £387,864 £303,952 £221,941
Jul 2019 £413,723 £621,270 £393,115 £307,755 £224,437
Aug 2019 £416,612 £627,204 £396,207 £310,106 £224,375
Jan 2020 £406,721 £611,883 £388,786 £302,505 £217,765
Source: Land Registry (2020)
Average rents across the UK rose by 1.8% in March 2020 according to the latest HomeLet Rental Index
when compared to the same month in 2019.
The average monthly rent (excluding London) was £793 in March 2020, up 1.4% from last
year.27
The average current asking rent in Wokingham is £1,210 per calendar month.28 The table
below gives a breakdown of asking rents for privately rented homes (as of April 2020)
together with the applicable Local Housing Allowance (LHA) and the shortfall between these
figures.
Average Asking Rents in Wokingham Borough (April 2020)
Property Type LHA (pcm) Average Asking Rent (pcm) Potential Shortfall (pcm)
1 Bed Flat £784.11 £809 £24.89
2 Bed Flat £936.98 £1,089 £152.02
2 Bed House £936.98 £1,121 £184.02
3 Bed House £1,134.26 £1,456 £321.74
4 Bed House £1,528.76 £1,710 £181.24
5 Bed House £1,528.76 £2,994 £1,465.24
Source: Zoopla.co.uk (2020)
27 https://homelet.co.uk/homelet-rental-index
28 https://www.zoopla.co.uk/market/wokingham/
11You can also read