A Cloud Native Machine Learning based Approach for Detection and Impact of Cyclone and Hurricanes on Coastal Areas of Pacific and Atlantic Ocean
←
→
Page content transcription
If your browser does not render page correctly, please read the page content below
Journal of University of Shanghai for Science and Technology                                      ISSN: 1007-6735

A Cloud Native Machine Learning based
Approach for Detection and Impact of Cyclone
and Hurricanes on Coastal Areas of Pacific and
Atlantic Ocean
Drumil Joshi
Dwarkadas J Sanghvi College of Engineering,
Student, Department of Electronics and Telecommunication
Mumbai, India
abcdrumil@gmail.com
Fawzan Sayed
Dwarkadas J Sanghvi College of Engineering,
Student, Department of Electronics and Telecommunication
Mumbai, India
fawzansayed@gmail.com
Harsh Jain
Dwarkadas J Sanghvi College of Engineering,
Student, Department of Electronics and Telecommunication
Mumbai, India
harshjain000011112@gmail.com
Jai Beri
Dwarkadas J Sanghvi College of Engineering,
Student, Department of Electronics and Telecommunication
Mumbai, India
jaiberi25@yahoo.co.in
Yukti Bandi
Dwarkadas J Sanghvi College of Engineering,
Faculty, Department of Electronics and Telecommunication
Mumbai, India
yukti.bandi@djsce.ac.in
Dr. Sunil Karamchandani
Dwarkadas J Sanghvi College of Engineering,
Faculty, Department of Electronics and Telecommunication
Mumbai, India
sunil.karamchandani @djsce.ac.in

Abstract – Tropical Storms are one of the most dangerous natural disasters known to man. The concept of predicting these has
been around for as long as they have existed. Improvements are made to reduce the error using newer techniques or better
processes. In this research paper, we are trying to predict the occurrence of storms from the Pacific and Atlantic Ocean on American
land. The data is used to train various machine learning models and comparison is drawn between them to conclude the best for our
application. The results are then shown on a map to get a visual representation using folium library. The entire project is also deployed
using Microsoft Machine Learning Azure to help with deployment over the web service. This paper hopes to present a system that
accurately predicts and efficiently presents everything regarding the real time occurrence of hurricanes and typhoons.

Keywords – natural disasters, occurrence, machine learning model, folium

         Volume 23, Issue 7, July - 2021                                                                           Page -394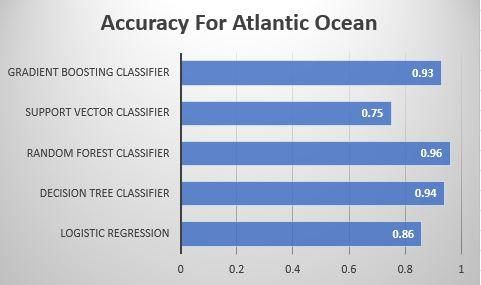
Journal of University of Shanghai for Science and Technology ISSN: 1007-6735
1. INTRODUCTION 3. METHODOLOGY
Hurricanes, typhoons and cyclones are nothing but 3.1. Data Acquisition and Exploratory Data
types of tropical storms. Tropical storm is a system Analysis
formed of rapidly flowing air in a circular formation, with
a low-pressure center and overall low-level pressures. The National Hurricane Centre (NHC) analyses the
This is also usually accompanied by spiral aftermath of each tropical storm in the Atlantic basin and
thunderclouds and strong winds which also leads to the North Pacific Ocean to obtain official storm surveys
heavy rains and squalls. The intensity of a storm is history. NHC publishes a hurricane database in a form
measured using various scales of classification known as HURDAT, short for Hurricane Database. In
depending on the agency keeping track of the storm. addition, the NHC conducts continuous reviews of any
For our application, the Saffir–Simpson scale is used retrospective storm analysis submitted and regularly
which categorizes the storms into five increasing updates the historical record to reflect changes made.
categories depending on their wind speeds. The First and foremost, we have two datasets comprising of
tracking and monitoring of these natural phenomenon is different types of hurricanes and typhoons in the
very important for the safety of people world-wide. And corresponding oceans. We will be operating on two
the use of machine learning to predict the behavior of different datasets simultaneously to find any similarities
these winds will provide a massive leap in the or differences. The first stage of any machine learning
preparedness in such events. The data used in pipeline is exploratory data analysis and here it is done
constructing the algorithms is taken from the Atlantic, by removing the null values and outliers present in both
Northeast and North Central Pacific hurricane the datasets. As date comes out to be the most
databases. Comparisons are made of the models important columns, we have to convert into HHMM
trained to determine the most appropriate model for our format for better forecasting. The target column in our
application. scenario is Status column comprises of Categorical
column as thus we change the type of column. The
below figures Fig 1 and 2 shows the top 10 hurricanes
and typhoons by frequency.
2. LITERATURE SURVEY
On average, every year ten storms enter land from the
sea across the globe. And about 4 of these storms are
classified as a potential threat to the safety of the
people. An estimated 60 billion dollars is lost every year
in damage to physical property and relief initiatives.
These numbers keep going up every year, majorly due
to climate change. The warming of the entire globe has
led to more storms forming and has also increased the
chance that the storm will grow in magnitude to become
a bigger phenomenon. The lasting damage that the
natural disaster leaves in its trail is something that
communities recover from too slowly. Hence, prediction Fig. 1. Pie Chart representing Top 10 Hurricanes by
systems are put into place to reduce the losses gained Frequency in Pacific Ocean
by us. Efforts are continuously made to improve these
systems, but errors are still made as we can never
predict the nature of these storms completely
accurately. This only means that the systems will
continue to be developed till they give negligible error.
The machine learning model built by us has a low bias-
variance trade-off and thus the problem of
multicollinearity is eradicated. The best performing
machine learning model is Random Forest and the
marqee point is that it is not affected whether the
categorical variables are oversampled and
undersampled leading to removal of overfitting and
underfitting. On Microsoft Azure ML Studio, we applied
2 class Decision Jungle algorithm which is a cherry on
cream as it is a noise resistance algorithm and a super
set of Random Forest leading to approximately 99% of Fig. 2. Pie Chart representing Top 10 Hurricanes by
accuracy without overfitting. The concept has been Frequency in Atlantic Ocean
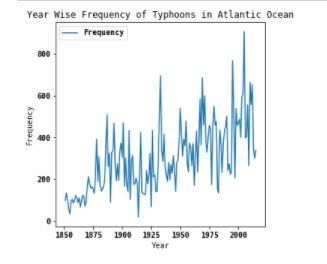
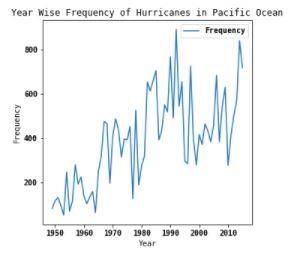
implemented in the past using image processing rather The next step is to use to converted date to see the
than using signal acquisition. And further, we see the trend over the last 100 years over the rise of hurricanes
superiority of our implementation over theirs. and typhoons which is depicted by figures Fig 3 and Fig
4.
Volume 23, Issue 7, July - 2021 Page -395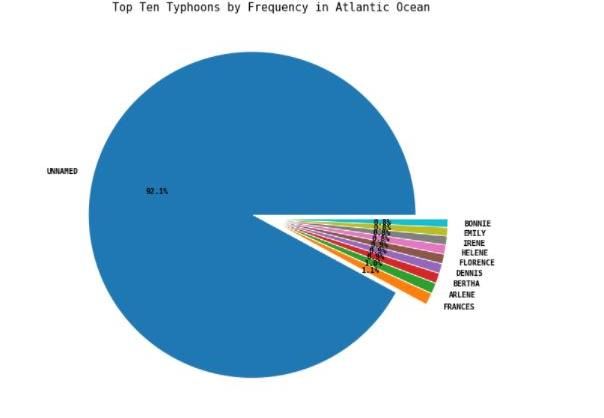
Journal of University of Shanghai for Science and Technology                       ISSN: 1007-6735

                                                               Fig. 5. Density Plot representing frequency of
                                                              hurricanes w.r.t Maximum Wind in Pacific Ocean

     Fig. 3. Line Chart representing Year Wise
     Frequency of Hurricanes in Pacific Ocean

                                                                Fig. 6. Density Plot representing frequency of
                                                              hurricanes w.r.t Maximum Wind in Atlantic Ocean

                                                                  •    Logistic Regression: Logistic Regression
                                                                       produces Results in a binary format that
                                                                       means it is used when value which need to
                                                                       be predicted is categorical. Sigmoid function
                                                                       (S-curve) is used to predict the output of the
                                                                       dataset. Sigmoid curve shrinks the value
                                                                       from (-infinity, +infinity) to discrete Values
                                                                       between 0 and 1 and a threshold Value is
                                                                       kept to differentiate it as 0 or 1. When we
     Fig. 4. Line Chart representing Year Wise                         applied logistic regression to both the
     Frequency of Hurricanes in Atlantic Ocean                         datasets, we got to know that Extratropical
                                                                       Cyclone is also a frequent in Atlantic Ocean.
                                                                       The Tropical Cyclone of tropical depression
   3.2. Feature Engineering and Application of                         intensity and tropical cyclone of hurricane
   Machine Learning Algorithms                                         intensity both goes hand in hand and has a
                                                                       precision, recall and f1 score the same for
   Feature engineering is the process of using domain                  Pacific Ocean and its approximately equal to
information to extract features (features, properties,
                                                                       1. When we come to Atlantic Ocean, there is
attributes) from raw data. A feature is an asset shared
                                                                       a slight dip in the accuracy metrics as there
by independent units in which analysis or forecasting
will be performed. Features are used for speculation                   is more presence of categorical columns that
models. The metric used to find the feature importance                 means different types of cyclones. The
in our scenario is done by concept of eigen value which                logistic regression gives best output for
is present in Principal Component Analysis. After doing                Tropical Cyclone of hurricane intensity (>64
feature selection, the major factor influencing the results            knots), its precision, recall and f1 score in
was Maximum wind and thus we have plotted the                          approximately near to 0.98.
density plot comprising of maximum wind and the
frequency of different types of cyclones using seaborn
library. The density plots are shown in figures Fig 5 and
Fig 6.

        Volume 23, Issue 7, July - 2021                                                           Page -396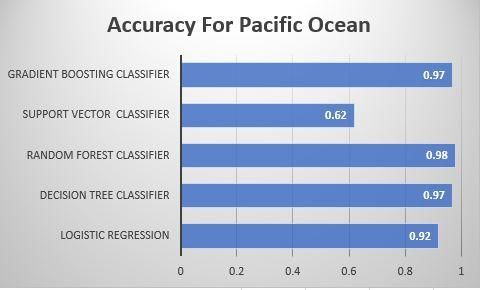
Journal of University of Shanghai for Science and Technology                        ISSN: 1007-6735
                                                                       missing date. The Random Forest classifier is
                                                                       the best performing algorithm in the entire
                                                                       scenario and it gives an accuracy of 0.98. All
                                                                       the hurricanes/typhoons are successfully
                                                                       classified for both the oceans especially
                                                                       Tropical Cyclone of tropical depression
                                                                       intensity (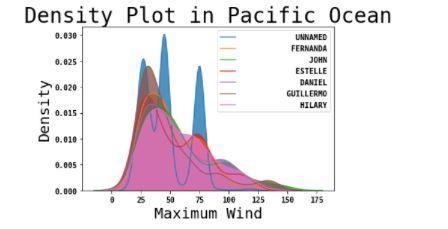
Journal of University of Shanghai for Science and Technology ISSN: 1007-6735
• Gradient Boosting Classifier: Gradient species that can govern the boundaries of off-line
boosting classifier creates a model that adds decisions. They make the selection and classification of
in a high-quality way; allows for the features integrated and are able to be strong when there
performance of lost and divisive functions. In are sound features. The accuracy achieved was
each phase the n_classess regression trees approximately 99% and to be precise the model is not
are equal to the negative gradient of the overfitting. The model was converted into a forecasting
binomial or multinomial loss function. Binary experiment which helps to deploy the model using
separation is a special case when a single webservice and thus it can be called by REST API and
regression tree is found. Features are always HTTP call. The below figure shows the demonstration
allowed at each break. Therefore, the best of entire web service on azure ML studio.
available divisions may differ, even with the
same training data and max_feature =
n_feature, if the improvement in
determination is similar to the several cracks
calculated during the search for the best
divisions. To get timely determination,
random_state must be configured. In our
circumstances the gradient boosting
algorithm performs excellently well as it gives
an accuracy of 97%. It keeps in the
computational power of the device at the back
of mind and produces the corresponding
results. The precision, recall and f1 score are
approximately near to 0.99 except for
Fig. 12. Flow Model of Microsoft ML Azure for Web
extratropical cyclone (of any intensity). The
Service
reason of not getting accurate results for
extratropical cyclone (of any intensity) is that 3.4. Real Time predicting the severity of natural
the occurrence of such cyclone is very rare as disaster using Folium library
shown in the density plot. Hence the
statistical measures fail for extratropical Folium library builds on the competing power of
cyclone (of any intensity). Python system data and the power of the leaflet.js
library map. It generates our data in Python, and
visualize it on a Leaflet map with folium. Folium makes
it easy to visualize data used in Python on a map of
interactive tracts. It enables data binding on choropleth
view map and transfers rich vector / raster / HTML views
as map markers. The library has many built-in tile-sets
from OpenStreetMap, Map-Box, and Stamen, and
supports custom tile-sets with Map-Box or Cloud-made
API keys. Folium supports both photo, video, GeoJSON
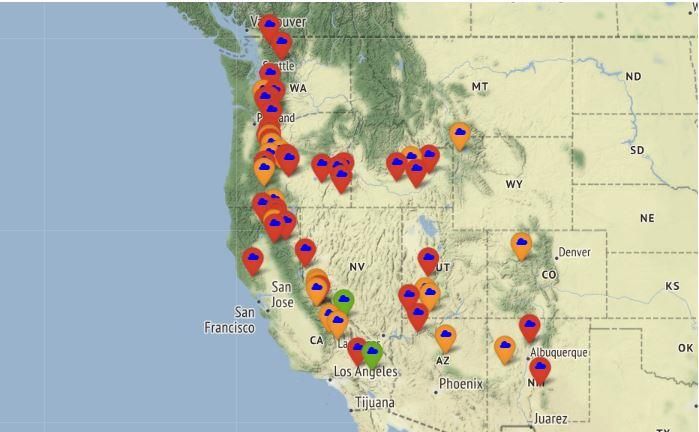
and TopoJSON overlay. In our scenario we created a
small subset with real time latitudes and longitudes of
costal area of United States of America. The frequency
Fig. 11. Output of Statistical Measures of Gradient
and severity of cyclones were crucial parts in that
Boosting Classifier of both Pacific and Atlantic
dataset. Seeing the severity, we marked the landfall
Ocean
areas according to the colour scheme as shown in
3.3. Computing the entire ML Model on below figure Fig 13.
Microsoft Azure for Web Service
Azure Machine Learning can be used for any type of
machine learning, from classical ml to in-depth,
supervised, and transfer learning. Whether we choose
to write code in Python or R with the SDK or work with
non-coded / low-coded studio options, we can create,
train, and track machine learning and in-depth learning
models in the Azure Machine Learning Workspace.
Azure Machine Learning Studio is a web site on Azure
Machine Learning for low-cost options and model
training codes, shipping, and asset management. The
studio merges with the Azure Machine Learning SDK
for a seamless experience. In studio we applied two Fig. 13. Live Map representing the severity of
class decision jungle machine learning algorithms. The cyclone
corresponding algorithm allows tree branches to come
together, the directed acyclic graphs (DAG) decision 3.5. Results and Discussions
often has lower memory and better performance to do
than a decision tree, even if it costs a certain amount of The entire research paper consists of an entire
training longer. Decision jungles are non-parasitic machine learning pipeline and it was implemented on
Volume 23, Issue 7, July - 2021 Page -398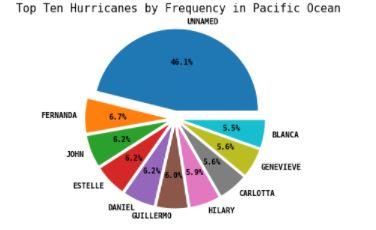
Journal of University of Shanghai for Science and Technology                        ISSN: 1007-6735
two different datasets of Hurricanes and Cyclone of          Forest Classifier. Then the entire pipeline was shifted to
Atlantic and Pacific Oceans. When we applied machine         Microsoft azure studio and then we applied two-class
learning algorithm on Atlantic Ocean the result came in      decision jungle and the accuracy increase by
favour of random forest algorithm with a whooping            approximately 1-1.5 %. To add further into the project,
accuracy of 96% and the least was obtained by Support        we used Folium library and its ability to mark the
Vector Machine of 75% as it considered all the               markers on real time map with latitudes and longitudes.
datapoints with the disturbances. The graphical              We marked the points of high severity of cyclone on a
representation is shown below in Fig 14. On the              small subset of dataset. The complete pipeline was
counterpart when we applied machine learning                 converted to a predictive webservice where it can be
algorithm to pacific ocean , the content here remains the    called by an API or REST API which eventually leads to
same and thus the performance is much or more related        deployment.
to Atlantic ocean and thus random forest becomes the
best performing algorithm with an accuracy of 98% and
lowest is given by Support Vector Machine by 62% as               5. REFERENCES:
shown in Fig 15.
                                                             [1] R. Berg, "Tropical cyclone report: Hurricane Ike
                                                             (AL092008) 1–14 September 2008", 2009

                                                             [2] R. Nateghi, S. D. Guikema and S. M. Quiring,
                                                             "Comparison and validation of statistical methods for
                                                             predicting power outage durations in the event of
                                                             hurricanes", Risk Anal., vol. 31, no. 12, pp. 1897-1906,
                                                             2011.
     Fig. 14. Horizontal Bar Graph representing
                                                             [3] S. Dreiseitl and L. Ohno-Machado, "Logistic
             Accuracy for Atlantic Ocean
                                                             regression and artificial neural network classification
                                                             models: A methodology review", J. Biomed. Informat.,
                                                             vol. 35, no. 5, pp. 352-359, 2002.

                                                             [4] T. Shelton, A. Poorthuis, M. Graham and M. Zook,
                                                             "Mapping the data shadows of Hurricane Sandy:
                                                             Uncovering the sociospatial dimensions of ‘big data’",
                                                             Geoforum, vol. 52, pp. 167-179, 2014.
     Fig. 15. Horizontal Bar Graph representing
             Accuracy for Pacific Ocean                      [5] Conoscenti C, Angileri S, Cappadonia C, Rotigliano
                                                             E,   Agnesi    V,   Märker   M (2014)     Gully    erosion
                                                             susceptibility assessment by means of GIS-based
    4. CONCLUSION
                                                             logistic   regression:   a   case    of   Sicily    (Italy).
  In the entire research paper, we have done machine         Geomorphology 204:399–411
learning classification on NHC’s Hurricanes and
Typhoons dataset, starting with exploratory data             [6] Dan Li, K. D. Wong, Yu Hen Hu and A. M. Sayeed,
analysis where we found out the pattern and frequency
                                                             "Detection classification and tracking of targets", IEEE
of occurrence of hurricanes and cyclones in the
respective oceans. Then we applied principal                 Signal Processing Magazine, vol. 19, no. 2, pp. 17-29,
component analysis and found the eigen values and the
                                                             Mar 2002.
most important factor influencing the results and we
plotted a density plot with respect to the number of         [7] S. Meckelnburg, A. Jurczyk, J. Szturc and K.
occurrences of the corresponding cyclone. The next
step was to apply machine learning algorithm to the          Osrodka, "Quantitative Precipitation Forecasts (QPF)
processed data and thus we applied five classification       Based on Radar Data for Hydrological Models", cost
supervised machine learning algorithms. The statistical
metrics we used to differentiate the five machine            action, 2002
learning algorithms were precision, recall, F1 score and
accuracy. The best performing algorithm was Random

        Volume 23, Issue 7, July - 2021                                                            Page -399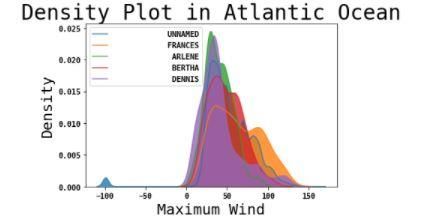
You can also read