2018 Athanassios Ganas, Varvara Tsironi and Sotirios Valkaniotis - A preliminary report on the 2018 Lombok region Indonesia earthquakes - EMSC
←
→
Page content transcription
If your browser does not render page correctly, please read the page content below
A preliminary
report on the 2018     August 9
Lombok region
Indonesia
                       2018
earthquakes

Athanassios Ganas,
Varvara Tsironi and
Sotirios Valkaniotis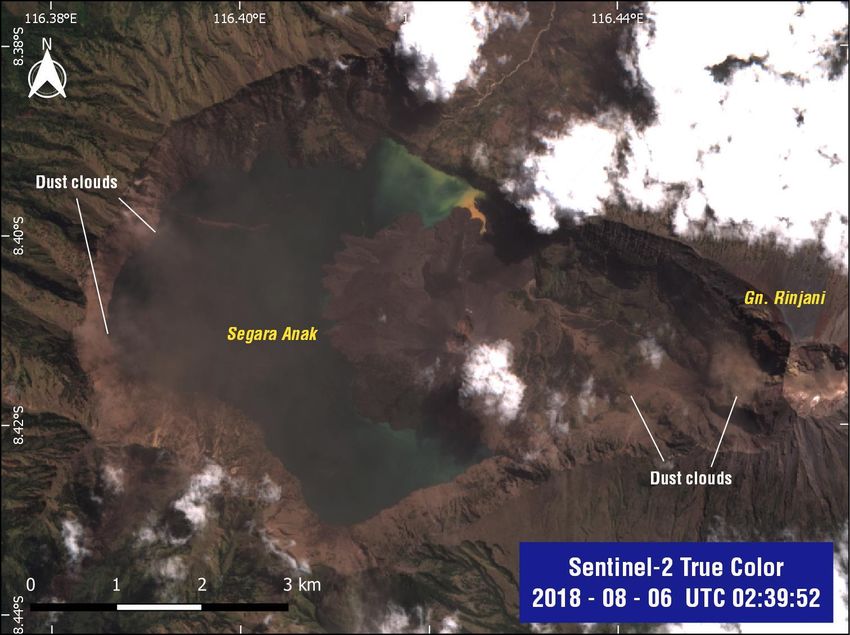
A preliminary report on the 2018 Lombok region - Indonesia earthquakes
                Athanassios Ganas1 Varvara Tsironi1 and Sotirios Valkaniotis2

1 National Observatory of Athens, Institute of Geodynamics, 11810 Athens, Greece
aganas@noa.gr barbara.tsir@gmail.com
2   9 Koronidos Str., 42131 Trikala, Greece valkaniotis@yahoo.com

                                          Abstract

Indonesia is considered as among the most active tectonic areas in the Asia – Pacific region.
The July 28 2018, 22:47:37 UTC earthquake (M6.4, EMSC – followed by a M5.4 aftershock
on 23:06 UTC) occurred on thrust fault which is part of the Flores fault zone of eastern
Indonesia. A second, stronger event (M6.9, EMSC) occurred on August 5, 2018 11:46 UTC
possibly on an adjacent segment of the fault zone towards the west (followed by a large
aftershock occurred on August 9th, 2018 M5.9, EMSC). The earthquakes affected the island
of Lombok in eastern Indonesia. Notably, a deep M6.0 earthquake had occurred several
hundred kilometres to the east at 17:07 UTC on the day of the 1st event.

Due to shallow depth of the earthquakes and considering their M6+ magnitude (USGS;
EMSC) significant ground deformation is expected. We investigated the surface earthquake
effects using the ESA Sentinel satellites. Regarding InSAR processing we used data from
Copernicus Sentinel-1 satellite constellation and ESA’s SNAP open source toolbox. Data
were downloaded from the Sentinel Open Access Hub. The differential interferogram
provides an estimation of the relative motion of the earth surface in the direction viewing
of the satellite (LOS). We obtained a maximum LOS displacement of +28 cm (towards the
satellite) due to the combined motions of both events. We note these are preliminary
results, as we did not analyse the contribution of the 2nd, stronger event. A 21-km long
seismic fault is inferred from the Sentinel-1 fringe pattern as activated during the first
event. We also detected numerous earthquake-induced landslides in Sentinel-2 imagery
acquired on August 6, 2018.

                                       Date of report

This report was released to EMSC-CSEM on August 9, 2018, 13:25 pm Greek time.

                                        Page 2 of 14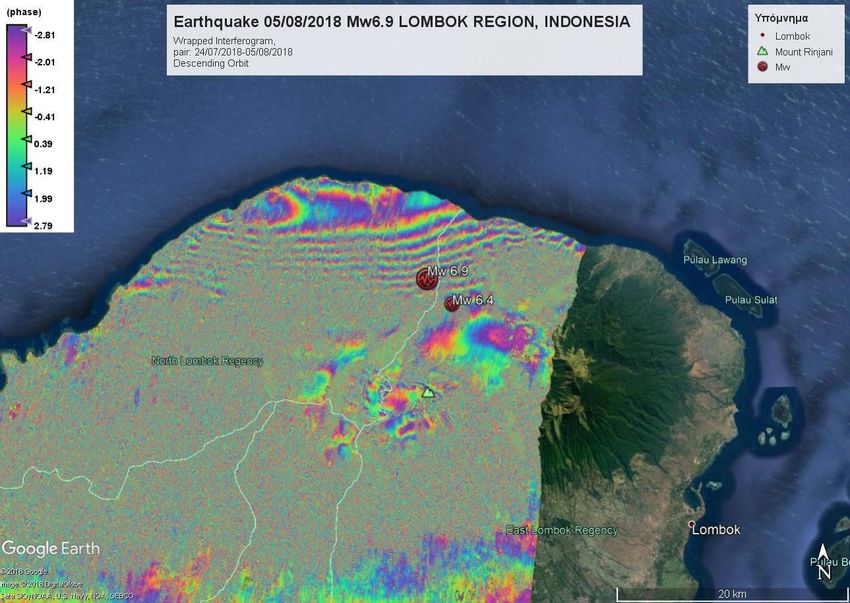
1. Geology and Tectonic setting

Indonesia is periodically affected by severe volcano eruptions and earthquakes, which are
geologically coupled to the convergence of the Australian tectonic plate beneath the Sunda
Plate. Global Positioning System (GPS) measurements of surface deformation (Kulali et al.,
2016) show that the convergence between the Australian Plate and Sunda Block in eastern
Indonesia is partitioned between the Java megathrust and a continuous zone of back-arc
thrusting extending 2000 km from east Java to north of Timor (Fig. 1). Deformation of the
upper plate is accommodated by slip partitioning, involving back-thrusting and strike-slip
faulting forming a pattern of crustal blocks, parallel to the orientation of the Java-Timor
trenches (Kulali et al. 2016; 2017).

Figure 1. Maps of eastern Indonesia showing elastic block modelling results from GPS data: back-
arc thrusting in the eastern Java trench area (incl. Lombok region; Flores thrust) is estimated
between 1 and 2 cm/yr (Koulali et al., 2016). Fault slip rate components: (top) fault normal
component (extension positive) and (b) fault parallel (right-lateral positive). The Lombok area is
indicated with capital letter L.

In the bac-arc region, the prominent tectonic feature is the Kendeng – Flores thrust fault
zone (Koulali et al., 2016, 2017; Fig. 1), a series of reverse fault segments spanning 2000

                                          Page 3 of 14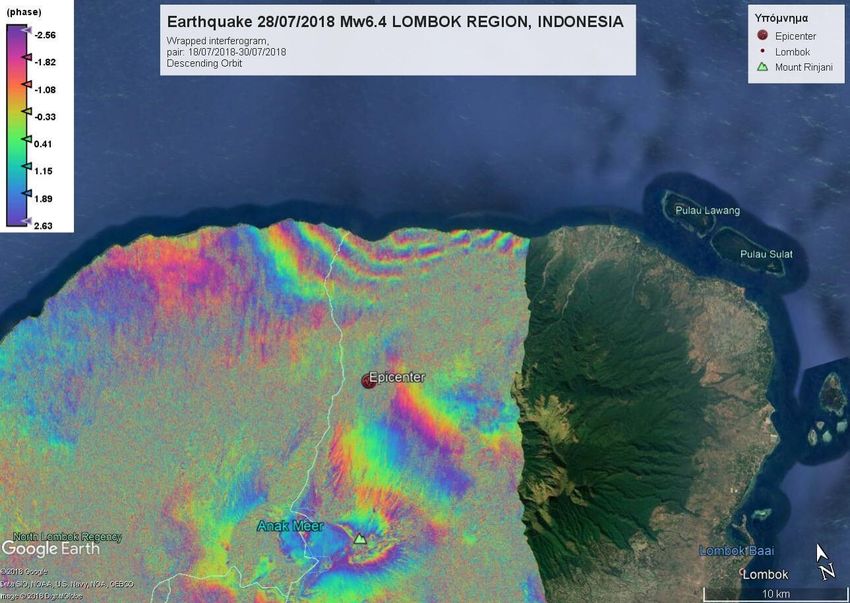
kilometres through the Indonesian archipelago. The fault zone accommodates a
component of shortening between 1 and 2 cm/yr, in the direction normal to the Java
megathrust (Fig. 1). The July-August 2018 shallow earthquakes occurred at the north
Lombok island in eastern Indonesia near the Flores fault zone (see L in Fig. 1). The focal
mechanisms of both events (solution summarized on the EMSC web site) indicate an almost
east-west orientation of the ruptures and reverse kinematics. In particular, the July 28
2018, 22:47:37 UTC earthquake (M6.4, EMSC – followed by a M5.4 aftershock on 23:06
UTC) occurred onshore Lombok according to locations provided by EMSC and USGS. Eight
days later, on 5 August 2018 (11:46 UTC) a stronger M6.9 event occurred in the same
region. The 2nd earthquake heavily impacted buildings and infrastructures on northern
Lombok1 claiming 300 lives (as of August 9, 2018 date of this report). Notably, a deep M6.0
earthquake had occurred 700 kilometres to the ENE of the island at 17:07 UTC on 28 July
2018 or approx. five hours before the 1st event2.

The rupture kinematics of both events was reverse as it was determined by the USGS
moment tensor inversion (Table 1) while the hypocentre depths were shallow, at 6-31 km.
The epicentre of the first event was located at 8.34°S, 116.48°E, according to EMSC, about
50 km to the NE of the capital Mataram. The epicentre of the 2nd event was determined by
EMSC at 8.32° S, 116.46° E. Both epicentres are characterized by formal errors in location
of about 4 km, however the actual errors are expected greater because of the lack of near-
field seismic data. A large aftershock (M5.9) on August 9, 2018 05:25 UTC was located by
EMSC at 8.42° S, 116.21° E.

Table 1. Nodal planes data from moment tensor inversion. Source: USGS.

      Event         Mag       Strike-1     Dip-1     Rake-1   Strike-2   Dip-2   Rake-2

    28/7/2018       6.4         276°        63°        96°       83°     28°      78°

     5/8/2018       6.9         269°        62°        88        93°     28°      93°

The geology of Lombok island is mostly made of volcanic rocks (mainly tuffs, lahar, lavas
and other volcanic deposits) due to the active Rinjani volcano (Fig. 2;
https://en.wikipedia.org/wiki/Mount_Rinjani ). The volcano rises to 3726 metres, making
it the second highest volcano in Indonesia. Its last eruption was during August 2016 that
generated an ash plume that rose to an altitude of 9.8 km
(http://volcano.si.edu/volcano.cfm?vn=264030). The bedrock is made of carbonate rocks.
It appears towards the south and southwest of the island (Fig. 2).

1
    https://www.bbc.com/news/topics/c34zx89q9wkt/lombok-earthquakes
2
    https://www.emsc-csem.org/Earthquake/earthquake.php?id=700918
                                            Page 4 of 14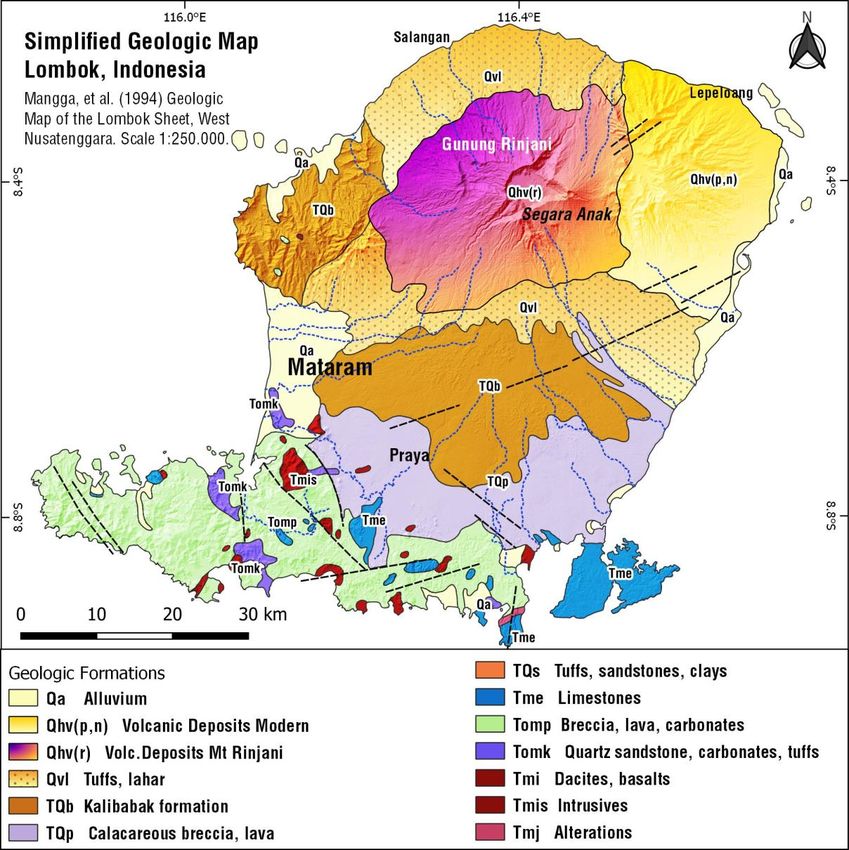
Figure 2. Simplified geological map of the Lombok island, Indonesia. Source: Mangga et al. (1994).

2. Satellite data

SAR interferometry (InSAR) is a geodetic technology based on RADAR sensors that can be
used to support studying and modeling of terrain movements such as tectonic motions
associated with faults and volcanic processes related to magma movements. The main
advantages of InSAR is the synoptic view of wide areas (see Fig. 3 for the study area), and
the periodic surveying that guarantees long-term monitoring and time series analysis. The
availability of multiple signals permits the differentiation of tectonic vs. anthropogenic
deformation, as well (e.g. Liu et al. 2016; Xu et al. 2017; Bovenga et al. 2018).

Here, we use Differential InSAR to capture the ground movements produced by the
28/07/2018 earthquake Mw=6.4 and the 05/08/2018 earthquake Mw=6.9 in the broader
area of Lombok, Indonesia (Fig. 3). For InSAR processing, we used ESA’s SNAP open source

                                          Page 5 of 14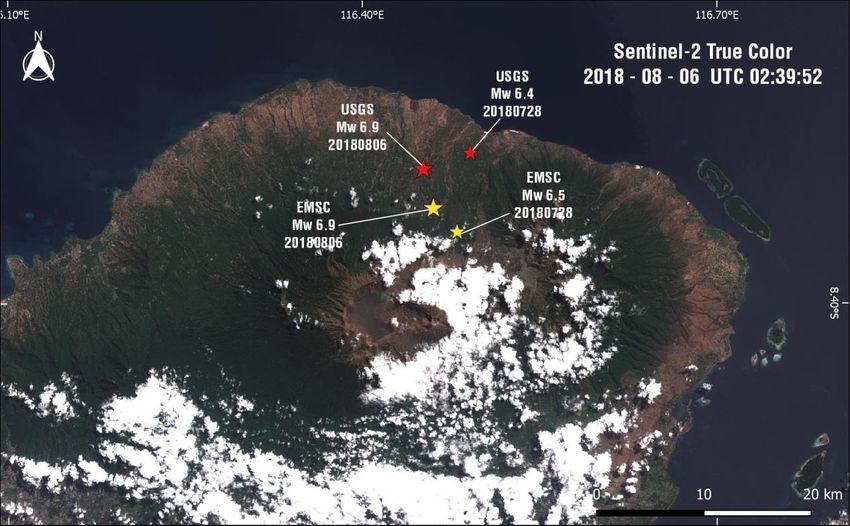
software. We construct interferograms by combining topographic information with SAR
images by the Sentinel-1 (both 1A and 1B; C-band) satellite before and after the
earthquakes. We used Sentinel-1 SLC images dated 18/07/2018 and 30/07/2018 for the
first event and 24/07/2018 and 05/08/2018 for both events (see Fig. 4 for a timeline of
acquisitions and events). The seismic events occurred on 28/07/2018 and 05/08/2018, so
we had the opportunity to mostly map the co-seismic part of the ground deformation (the
S1B August 5th image was acquired at 21:52 UTC or about 10 hours after the 2nd event).
Details of the interferometric pairs for both interferograms which are constructed in this
study are reported in Table 2. We also plan to process ascending orbit images when they
are fully available so we can differentiate the deformation due to the 2nd event and possibly
the deformation due to the large aftershock of August 9, 2018. The acquisition strategy of
Sentinels is suited well to the needs of the tectonics community as it provides frequent
images for mapping deformation due to earthquakes occurring closely in space and time
(e.g. Ganas et al. 2018).

The interferograms were flattened and topographic phase compensated for based on a
reference SRTM Digital Terrain Model (∼90 m resolution). In order to reduce the effects of
phase noise adaptive filtering (Goldstein & Werner, 1998) was applied, in addition to
multilooking operation using a factor of 10:2 (azimuth : range) obtaining approximately a
square pixel interferogram.

Figure 3. Google map showing the Sentinel frames (descending orbit) over the earthquake-struck
region.

                                         Page 6 of 14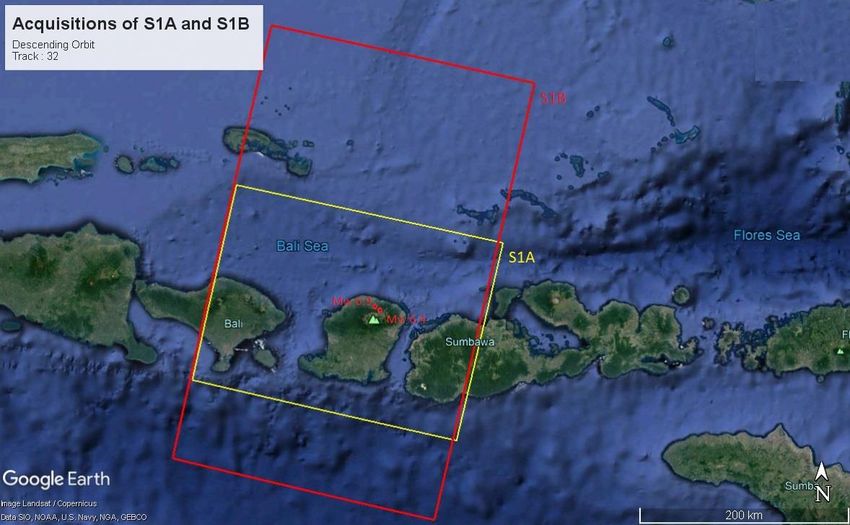
Table2. Characteristics of the interferometric pair used to study the 2018 Lombok
earthquakes. See Fig. 4 for a timeline.

    Orbit       Satellite   Track         Master            Slave         Bperp     Incidence
                                                                            (m)      Angle (°)
 Descending       S1A         32        2018-07-18     2018-07-30         -76.09       43.5
                                      T21:53:00.671Z T21:53:01.272Z
 Descending       S1B         32        2018-07-24     2018-08-05        -117.69       43.4
                                      T21:52:23.776Z T21:52:24.073Z

The wrapped interferograms show the fringe pattern associated with the earthquakes,
where each color cycle demonstrates a phase difference of [-π π], interpreted as ground
deformation equal to 2.8 cm in the LOS (Line Of Sight) direction to the satellite. The quality
of the interferograms was good but we obtained noisy areas which are the result of low
coherence. These areas have dense vegetation cover. The deformation was localized at the
north part of the island, near to the Mw=6.4 and Mw=6.9 epicentres.

We obtained a preliminary, maximum LOS displacement of +14 cm from the interferogram
of first event (Fig. 5; see five fringes of 28 mm motion each) and a preliminary, maximum
LOS displacement of +28 cm (towards) [and a minimum LOS Displacement -8.4 cm (away)]
from the interferogram which corresponds to both events (Fig. 6). Although the
interpretation is preliminary we note that the sign reversal in the InSAR data (Fig. 6) may
indicate that the activated fault during the 2nd event may actually outcrop near the NW
coast of Lombok.

Due to the reverse-slip kinematics of the earthquakes (determined by seismology; Table 1)
we infer that the motion towards the satellite indicates surface uplift (the fringe pattern
also indicates motion increasing towards the coast; Fig. 5), therefore the mapped fringes
indicate deformation of the hangingwall of the activated thrust faults. We note these are
preliminary results as no ascending orbit data were processed.

The deformation field after the occurrence of the 2nd event (image pair 24/7/2018 –
5/8/2018) can be visualized by the larger number of sub-parallel fringes as compared to
the fringe pattern of the 1st event (compare Fig. 5 vs. 6). The fringes also indicate ground
deformation towards the satellite (i.e. surface uplift). This pattern implies that the 2nd event
is affecting the coastal area to the west and northwest of the 1 st event so as it is inferred
that the 5/8/2018 rupture area comprises another segment to the west of the 28/7/2018
or it represents the western asperity of a large reverse fault beneath Lombok’s north coast.

                                         Page 7 of 14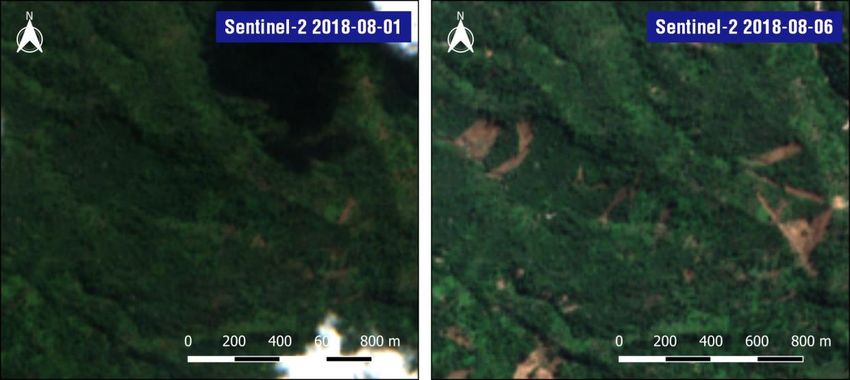
Figure 4. S1 Interferometric baselines from S1 descending track 32 (blue horizontal lines).
Acquisition dates are plotted over the line ends. The vertical red dashed lines show the seismic
events EQ1: 28/07/2018 earthquake Mw=6.4, EQ2: 05/08/2018 earthquake Mw=6.9.

Figure 5. Sentinel 1A wrapped interferogram (descending orbit) showing LOS deformation
onshore Lombok island, Indonesia due to the M6.4 28/7/2018 event. Five fringes are visible to
the north of the EMSC epicentre.

                                         Page 8 of 14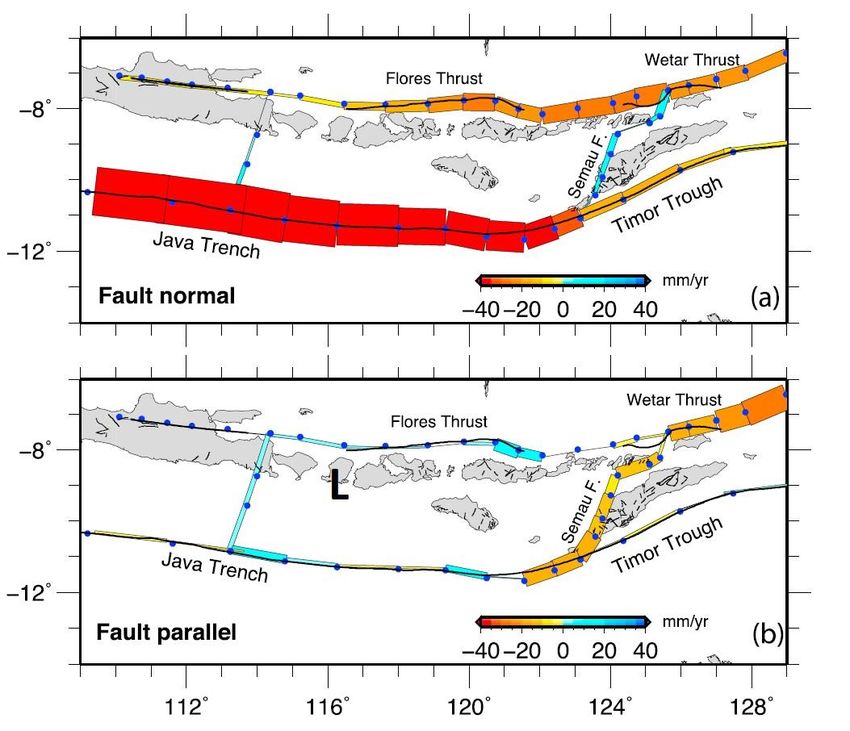
Figure 6. Sentinel 1B wrapped interferogram showing LOS deformation onshore Lombok island,
Indonesia due to the 28/7/2018 & 5/8/2018 earthquakes. A sign reversal (from positive to
negative LOS motion) is seen in the NW coastal area. Note the difference in scale bar at lower
right w.r.t Fig. 5.
3. Fault modeling
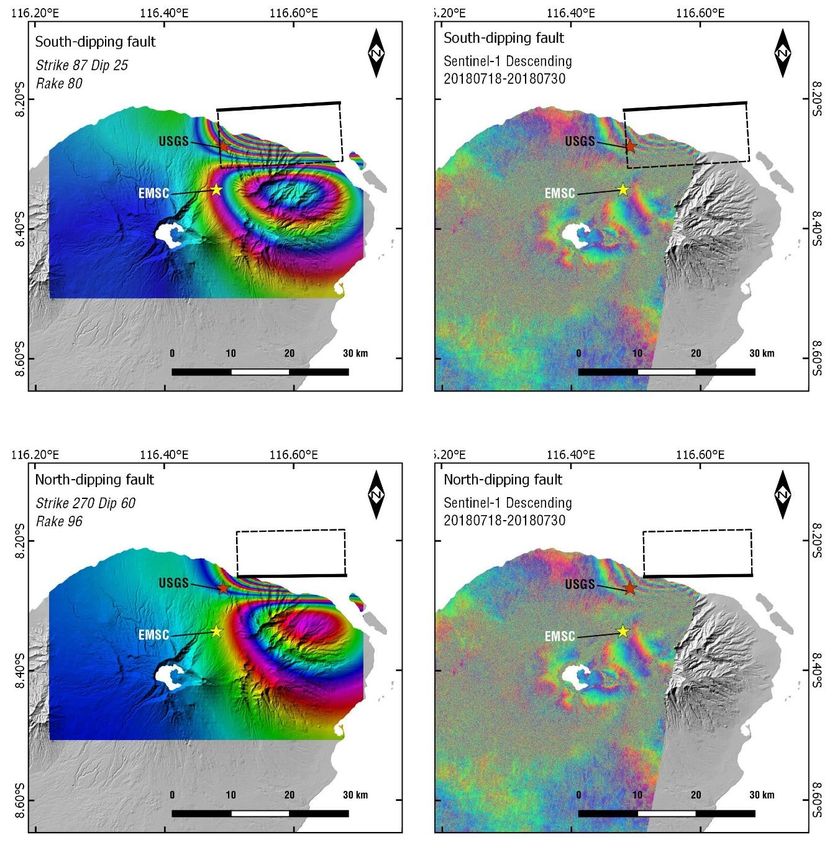
A preliminary elastic modeling3 of the co-seismic displacements together with LOS
displacements from SAR interferometry (Fig. 5) gives the following preliminary parameters
for the fault that ruptured during the 1st event (Table 3). The modelled fringe pattern is
almost similar for both dip-direction scenarios (north vs. south). Because of the onshore
location of the epicentre a south-dipping, low-angle plane (25°) is favored. The depth to
the top of the fault is 5 km, the depth to the fault bottom is 9.2 km. Half of the rupture is
modelled offshore (Fig. 7).
Table 3. Lombok 28 July 2018 earthquake fault parameters. See Fig. 7 for plots.
Fault length 21 km
Fault width 10 km
Fault Dip angle 25° south
Azimuth N87°E
Rake of slip vector 80°
Fault Slip 0.9 m
Centre of upper edge of the fault 116.58° E - 8.21° S
3
made with RNGCHN, Feigl and Dupre, 1999
Page 9 of 14
The seismic moment from this geodetic model is 5.67 × 10¹⁸ N-m (the USGS seismic
moment from radiated seismic waves4 is 5.639 × 10¹⁸ N-m or 1% less).

Our forward modeling shows that the reverse-slip rupture has an ENE-WSW orientation
and the plane dips to the south. The rupture extent is estimated at 20-21 km. Moreover, to
the east the rupture extent is ambiguous due to lack of data (end of satellite frame). It is
possible that the 5 August event (Mw=6.9) possibly ruptured a western extension of about
25-30 km length.

Figure 7. Preliminary fault models based on InSAR data (black rectangle indicates surface
projection of seismic fault). Left) models Right) S1 interferograms. Upper row shows the south-
dip (favoured) scenario, lower row the north-dip scenario, respectively.

4
    https://earthquake.usgs.gov/earthquakes/eventpage/us2000ggbs#moment-tensor
                                            Page 10 of 14
4. Geo-environmental Effects and surface ruptures
The August 5th Mw=6.9 earthquake caused widespread landslides at the northern part of
Lombok island. Although field reports are limited at this time, Sentinel-2 satellite imagery
from Copernicus, acquired few hours after the earthquake (2018-08-06 UTC 02:39; Fig. 8),
reveals numerous landslides. Although the August 6th acquisition has cloud patches that
mask parts of Mt Rinjani, thousands of estimated landslides are visible on the volcanic
slopes of Mt Rinjani, mostly on western, northern and eastern slopes. Landslides on the
low relief coastal areas are limited and are found mainly on the steep banks of rivers. The
Sentinel-2 pixel resolution limits the analysis on landslides to those with dimensions larger
than 10 m. Smaller landslides are probably widespread and numerous, and could be
verified by field mapping reports, commercial very high resolution satellite imagery and
UAVs (e.g. Valkaniotis et al. 2017).
The intensity of the shaking of the 2nd event possibly reached 0.4 g according to the USGS
shake map5 while the region seems heavily susceptible to landslides because of relatively-
incoherent volcanic deposits and reduced strength of materials due to past, strong
earthquakes. Accelerations up to 0.1 g may have occurred at distances up to 50 km from
the epicentre.
A Sentinel-2 acquisition of August 1st 2018, permits a limited separation of landslides from
the two main events. A larger percent of cloud cover on the August 1 st image limits the
analysis, but from a preliminary examination we conclude that landslides from the July 28 th
Mw=6.4 event are significantly fewer in number and are mostly limited on the eastern
slopes and near the summit area of Mt Rinjani volcano. Thus, comparing Sentinel-2 images
from July 12, August 1 and August 6, the majority of landslides occurred from the M w=6.9
earthquake.
Due to the close timing of the August 6th satellite acquisition (14+ hours after) with the
main Mw=6.9 event, Sentinel-2 has captured the magnitude of landslide and rockfall
occurrence around the crater lake Segara Anak, at the summit of Mt RInjani: high
resolution imagery shows the dust cloud still present around the steep cliffs from the main
shock and the first aftershocks6, along with recent landslide debris on the slopes and on
the lake (Figure 9). An example of earthquake-induced landslides is shown in Fig. 10.
5
https://earthquake.usgs.gov/earthquakes/eventpage/us1000g3ub#shakemap
6
A Mw=5.3 occurred on 6/8/2018 00:28 UTC https://www.emsc-
csem.org/Earthquake/earthquake.php?id=704921
Page 11 of 14Figure 8. Sentinel-2 image of Lombok island, August 6th 2018, 02:39 UTC. Epicentres of the two
main earthquakes (July 28th and August 5th) from USGS and EMSC shown as stars.
Figure 9. Sentinel-2 image showing widespread landslides, debris, dust clouds & sediment
aftermath of the August 5th earthquake and aftershock activity. Zoom at Segara Anak lake at Mt
Rinjani. Acquisition time is ~14 hrs after the Mw=6.9 event.
Page 12 of 14Figure 10. Examples of landslides from the August 5th Mw=6.9 earthquake, with comparison of
pre- and post- earthquake Sentinel-2 true colour imagery (August 1st on the left, August 6th on the
right). Location is at 116.300° E - 8.352° S.
5. Acknowledgments
We thank ESA and Copernicus for satellite (S1 & S2) acquisition imagery. We also thank
Pierre Briole for comments.
6. References
Bovenga F., A. Ganas, A. Refice, A. Belmonte, R. Nutricato, D. O. Nitti, M. T. Chiaradia, S.
Valkaniotis, S. Gkioni, C. Kosma, P. Manunta, E. Elizar, D. Darusman, and P. Bally, 2018.
Investigating ground instability in Indonesia by using multi temporal SAR interferometry,
Geophysical Research Abstracts Vol. 20, EGU2018-8488.
Feigl, Kurt L., Emmeline Dupre, 1999. RNGCHN: a program to calculate displacement
components from dislocations in an elastic half-space with applications for modeling
geodetic measurements of crustal deformation. Computers & Geosciences, 25, 695-704.
Ganas, A, Kourkouli, P, Briole, P, Moshou, A, Elias, P, Parcharidis, I, 2018. Coseismic
Displacements from Moderate-Size Earthquakes Mapped by Sentinel-1 Differential
Interferometry: The Case of February 2017 Gulpinar Earthquake Sequence (Biga Peninsula,
Turkey). Remote Sens., 10, 1089, http://www.mdpi.com/2072-4292/10/7/1089
Goldstein, R., Werner, C., 1998. Radar interferogram filtering for geophysical applications.
Geophys. Res. Lett. 25, 4035–4038.
Koulali, A., S. Susilo, S. McClusky, I. Meilano, P. Cummins, P. Tregoning, G. Lister, J. Efendi,
and M. A. Syafi’I, 2016. Crustal strain partitioning and the associated earthquake hazard in
Page 13 of 14the eastern Sunda-Banda Arc. Geophys. Res. Lett., 43, 1943–1949,
doi:10.1002/2016GL067941.
Koulali, A., et al. 2017. The kinematics of crustal deformation in Java from GPS
observations: Implications for fault slip partitioning, Earth and Planetary Science Letters,
Volume 458, Pages 69-79, https://doi.org/10.1016/j.epsl.2016.10.039 .
Liu, P.; Li, Q.; Li, Z.; Hoey, T.; Liu, G.; Wang, C.; Hu, Z.; Zhou, Z.; Singleton, A., 2016. Anatomy
of Subsidence in Tianjin from Time Series InSAR. Remote Sens., 8, 266.
Mangga, S.A., et al. 1994. Geological map of the Lombok sheet, west Nusatenggara. Scale
1:250.000.
Valkaniotis S., A. Ganas, and G. Papathanassiou, 2017. Using a UAV for collecting
information about a deep-seated landslide in the island of Lefkada following the 17
November 2015 strike-slip earthquake (M=6.5), Geophysical Research Abstracts Vol. 19,
EGU2017-9376, 2017.
Xu, X., D. T. Sandwell, E. Tymofyeyeva, A. González-Ortega and X. Tong, 2017. Tectonic and
Anthropogenic Deformation at the Cerro Prieto Geothermal Step-Over Revealed by
Sentinel-1A InSAR. IEEE Transactions on Geoscience and Remote Sensing, vol. 55, no. 9, pp.
5284-5292, doi: 10.1109/TGRS.2017.2704593.
web sites (last accessed August 9, 2018)
https://www.emsc-csem.org/Earthquake/earthquake.php?id=704824
https://www.emsc-csem.org/Earthquake/earthquake.php?id=701004
https://www.emsc-csem.org/Earthquake/earthquake.php?id=705531
https://earthquake.usgs.gov/earthquakes/eventpage/us1000g3ub#executive
https://earthquake.usgs.gov/earthquakes/eventpage/us2000ggbs#executive
END of REPORT
Page 14 of 14You can also read