Fashion & Luxury Private Equity and Investors Survey 2018 - Global report - Deloitte
←
→
Page content transcription
If your browser does not render page correctly, please read the page content below

Fashion & Luxury Private Equity
and Investors Survey 2018
Global report

Contents

Preface and methodology                    4

Key takeaways		                            7

M&A Deal Monitor 2017                      9

Private Equity and Investors Survey 2018   17

Glossary and contacts		                    37

Fashion & Luxury Private Equity and Investors Survey 2018 | Preface and methodology

Preface
2017 oversaw a global economic growth mainly
driven by emerging markets. Nonetheless, there is a
substantial amount of uncertainty mainly driven by a
globalisation slowdown, a rise of populism in developed
nations and prominent geo-political instabilities
affecting the global scenario.
The 2018 unstable global trading environments,
however, provide a major challenge for Fashion &
Luxury players, which could be reviewing their pricing
strategies against significant fluctuation in exchange
rates.
In such a context, rising global political tensions,
taxation reforms and new trade policies are expected
to deeply influence the industry. The repercussions
of this changing global landscape, along with the
increasing presence of disruptive technologies and the
digitalisation of the business and luxury worlds, are now
setting the bases for changes in the industry market
trends, thereby affecting its key players and their
business models.
In order to analyse and measure market trends and
expectations on M&A activities, Deloitte has launched
the third edition of the “Global Fashion & Luxury
Private Equity and Investors Survey”.

4

Fashion & Luxury Private Equity and Investors Survey 2018 | Preface and methodology

Methodology and contents
The study considers ten sectors of the F&L industry, of which three are Personal Luxury Goods.

               M&A Deal Monitor 2017                          Private Equity and                                          Sectors covered                                           Market segmentation
                                                              Investors Survey 2018
                                                                                                                       Personal Luxury Goods

                                                                                                                                                                                                          Price point analysis

                                                                                                                                                                                                                                 Consumers’ perception
               • Size of M&A deals by F&L                     • F&L market outlook
 Contents

                 sector                                       • Exit and investment
               • Target company profiles                        strategies in 2018
               • Investor profiles                            • Investors’ current                                                                                       Absolute
               • Analysis of global deals                       portfolio of F&L assets

                                                                                                                                                                                               Absolute
scope

                                                                                                           Apparel &          Cosmetics &        Watches &
 Geo

                                         Global                                           Global           Accessories         Fragrances         Jewellery              Aspirational

               •   News and reports
                                                 Primary
                                                              • Online survey based
                                                                                            Primary                                                                                         Aspirational
                   from major media
 Data source

                                                 data level     on Computer Assisted        data level
                   providers                                    Web Interviewing
               •   Investor press                               (CAWI)
                   releases                                   • Interviews with Private                                                                                  Accessible
               •   Company press                                Equity funds top
                   releases                                     management
                                                                                                           Furniture     Private Jets   Yachts    Luxury Cars
               •   The study has been conducted with the support of Deloitte offices in: China,
 Remarks

                   France, Germany, Hong Kong, Italy, Luxembourg, Singapore, Spain, Switzerland,
                   United Kingdom, United States.
                   The survey targeted senior members within investment funds, with a                                                                                    Fashion
               •
                   substantial knowledge of the F&L industry.                                                                                                                                   Fashion

       Full secondary data   Full primary data                                                           Luxury Hotels       Luxury Cruises       Digital Luxury

                                                                                                                                                                                                                                                         5
Fashion & Luxury Private Equity and Investors Survey 2018 | Key takeaways

Key takeaways
M&A Deal Monitor 2017

2017 Global M&A deal overview                              Top deals in 2017                                              M&A features and strategies
The Fashion & Luxury industry proved to be fertile         Acquisitions of Apparel & Accessories drove numbers            Of the M&A deals completed, 47 per cent were carried
soil for M&A activities with 217 deals registered in       in 2017:                                                       out by strategic investors, a decrease of 43 deals
2017, presenting an increase of 6 deals compared           • LVMH gained control of Christian Dior through its            compared to 2016. Financial investors, on the other
to the previous year. Personal Luxury Goods deals            acquisition by Bernard Arnault (~13.7B$ for 26 per cent).    hand, carried out more deals compared to 2016 (+44
have increased (+5 deals versus 2016) with Apparel                                                                        deals).
                                                           • Belle International by Hillhouse Capital Group (~4.7B$
& Accessories (36 per cent of total), and Cosmetics &
                                                             for 100 per cent).                                           Strategic sellers were involved in 64 per cent of
Fragrances (13 per cent of total) increasing by 8 and 6
                                                           • Kate Spade & Co by Coach Inc (~2.4B$ for 100 per             transactions (-13 percentage points versus 2016).
deals respectively. Watches & Jewellery (13 per cent of
                                                             cent).                                                       Generally, bidders’ investments focused on a buyout
total) was the only PLG presenting a decrease of 9 deals
                                                                                                                          strategy (+55 deals versus 2016).
compared to the previous year. M&A deals volumes           • Jimmy Choo by Jag Acquisitions for (~1.2 B$ for 100 per
in other sectors increased, with activity in Furniture       cent).
(+6 deals) and Cars (+2 deals) growing compared to
                                                           Other relevant acquisitions in 2017 involved Cosmetics
the previous year. The average deal value has shown
                                                           & Fragrances and Hotel companies:
a relevant downsize, from $449M to $230M in 2017
                                                           • Carver Korea Co by Unilever (~2.4B$ for 95 per cent).
(-49 per cent), nonetheless presenting an increase in
achieved multiples.                                        • The Body Shop International by Natura Brasil (~1.1B$
                                                             for 100 per cent).
M&A deals in Europe strongly increased (+14 deals),
                                                           • Playa Hotels & Resorts by Pace Holdings (~1.8B$ for
while North America and Asia-Pacific remained flat.
                                                             100 per cent).
Luxury hotel deals were present in all major regions
                                                           • Hilton Garden Inn by Pandox AB (~1.0B$ for 100 per
except for Japan and the Middle East and were notable
                                                             cent).
drivers of M&A globally in 2017.

                                                                                                                                                                                                7
Fashion & Luxury Private Equity and Investors Survey 2018 | Key takeaways
Private Equity and Investors Survey 2018
Fashion & Luxury market outlook Investors’ positive consensus regarding 2018 investment strategy Luxury), newcomers prefer consolidated
both Asia and the Middle East has sectors within the F&L industry (e.g.
Within its Private Equity Survey, Deloitte During 2017, 89 per cent of funds are
continued in 2017 as the forecast Cosmetics & Fragrances) where market
focused on understanding investors’ considering investing in a F&L asset,
continues to see these sectors knowledge is widespread.
perceptions of the potential growth in with notable interest rising in: Apparel &
stimulating the growth of the F&L
the F&L market in coming years. The Accessories (where 73 per cent intend to With respect to 2017, the continuous
industry. Expectations for North America
consensus view is that major players invest), Cosmetics & Fragrances (60 per consolidation of the F&L industry is
are positive (5-10 per cent annual
in Personal Luxury Goods (PLG) are cent), Furniture (45 per cent), Watches & moving investments towards smaller-
growth), but sentiment has decreased
projected to achieve 1.2 times their 2016 Jewellery (19 per cent) and Digital Luxury sized companies (+10 percentage
compared to 2017. Latin America
sales index by 2020 (~ +3 per cent CAGR (16 per cent), Selective Retailing (10 per points), where investors plan to
will remain stable. Finally, sentiment
FY 2016-20), while other luxury sectors cent). boost performance by implementing
regarding Japan beat expectations
are expected to achieve 1.3 times their internationalisation, performance
compared to the previous year, with Even though interest is declining
value (~ +4 per cent CAGR FY 2016-20). improvement and change management
investors foreseeing a consolidated compared to the previous year, Watches
strategies.
Within the next three years, investors growth (5-10 per cent). & Jewellery and Digital Luxury remain
forecast that the F&L industry will remarkably attractive to investors. The consensus is that forecasted returns
continue to grow by 5-10 per cent Virtualization trends in the consumer will range from 21 to 30 per cent, with
2018 exit strategy
annually. Digital Luxury and Cosmetics purchasing process are leading to Cosmetics & Fragrances and Furniture
& Fragrances are projected to The report considers potential strategies the creation of a new cluster of firms representing the top performers (>30
outperform strongly, growing by more investors will undertake in 2018 to focusing on Digital Luxury, mostly within per cent); EMEA investors expect higher
than 10 per cent per year. Apparel & enhance or disinvest their Fashion & the Cosmetics & Fragrances segment. internal rates of return (IRR) compared to
Accessories, Watches & Jewellery, Luxury portfolios. About 35 per cent of the US and China.
Despite a slowdown in the Asian market,
Hotels and Furniture are consolidating funds are considering divesting an F&L
investors’ attraction to Watches & According to respondents in 2017, 63 per
(with expected annual growth of 5-10 per asset in 2018, a slight decrease from the
Jewellery remains stable due to their cent will invest in disruptive technologies
cent), while Private Jets are projected previous year (-2 percentage points).
appeal as less volatile assets. in order to benefit from potential
to remain stable (0-5 per cent annual Generally, an investor’s exit is motivated
synergies. The Internet of Things and
growth). A decrease in Cars, Yachts and by an opportunity for high returns, the While current investors, mainly in the
Artificial intelligence will have the largest
Selective Retailing is expected. closing of the investment period, market EMEA area, are more attracted to
impact on investors’ portfolios.
trends mismatches or concerns related innovative segments (such as Digital
to the shrinking of multiples.
8Fashion & Luxury Private Equity and Investors Survey 2018 | M&A Deal Monitor 2017
M&A Deal Monitor 2017
Fashion & Luxury M&A deals
Overview of deals in 2017 by sector
211 217 +6 Top luxury deals of 2017
Value
Deals in 2016 Deals in 2017 Deals
Month Target Bidder ($m)
Sector Personal Luxury Goods 2016 2017 Growth Arnault
Jun. Christian Dior 13,673
Family
Apparel & Accessories
69 77 +8
Jul.
Belle
International
Hillhouse 4,745
Hotels
53 46 -7 Nov. Carver Korea Unilever 2,420
38 29
Kate Spade
Watches & Jewellery -9 Jul. Coach Inc. 2,380
& Co
Playa Hotels Pace
22 28
Mar. 1,863
+6 & Resorts Holdings
Cosmetics & Fragrances
Jag
Nov. Jimmy Choo 1,167
Acquisitions
Furniture
11 17 +6
Sep. The Body Shop
Natura (Brazil)
International
1,130
Private Jets
10 10 - Dec.
Hilton Garden
Hinn
Pandox AB 1,026
7 7
Sinoer Men’s Gunaghzou
Yachts - Jul. 973
Wear Cedar
Schustermann Permira
0 2
Jan. 761
& Borenstein Advisers
Cars +2
Grosvenor
Jun. GH Equity UK 740
1 1
House Hotel
Cruises -
Note: the analysis considers both closed and announced deals during 2017 | Source: Elaboration on Deloitte intelligence data
9Fashion & Luxury Private Equity and Investors Survey 2018 | M&A Deal Monitor 2017
M&A deals by region and sector
Overview of deals in 2017 by region
(number of deals)
Europe North America Key findings
+14 81 95 109 - 35 59 59 - 14 36 36
11 8 3 Europe was the only region which saw an
15 18 6 2 6
18 4 increase in Fashion & Luxury deals in
5 14 10
10 6 4
5 15 16 10 5 10 2 2017, with 14 more deals.
4 10
19 21 8 12 North America and Asia-Pacific presented
24
16 11 the same amount of deals as the previous
15 9
38 47 7 year.
27 15 14 12
4 8
Luxury hotel deals were present in all
2015 2016 2017 major regions except for Japan and the
2015 2016 2017 2015 2016 2017
Middle East and were notable drivers of
M&A globally in 2017.
Japan Middle East Rest of World Japan presented a slight decrease in F&L
-4 6 8 4 -2 2 5 3 -2 3 8 6
deals since 2016 with 75 per cent of its
1 1 deals driven by Watches & Jewellery.
1
2 1 1
1 2 1 Although deals in Fashion and Luxury in the
3 5 Middle East decreased, the region saw an
2 1 4 increase in deals relative to the Apparel &
5 2 2 Accessories sector.
1 2
2 3
1 1
2015 2016 2017 2015 2016 2017 2015 2016 2017
Cosmetics & Fragrances Hotels Other Private Jets
Watches & Jewellery Apparel & Accessories Yachts # Variance 2016-17
Source: Elaboration on Deloitte intelligence data
10Fashion & Luxury Private Equity and Investors Survey 2018 | M&A Deal Monitor 2017
Size of main M&A deals
The F&L soil has been fertile with 217 M&A deals in 2017, showing a 2.8 per cent increase from 2016. Personal Luxury Goods
(+3.8 per cent YoY) represent 62 per cent of all deals.
Number of deals in 2017 - Breakdown by sector
(number of deals, percentage)
7 2 1 217 Key findings
10
PLG YoY 2016 -17 +5 17
83
Other Watches & Jewellery
luxury
( 38%) registered 9 deals less
markets
46
compared to 2016.
Apparel & Accessories and
28
Cosmetics & Fragrances
29 deals increased by 8 and 6
Personal deals respectively.
134
Luxury
( 62%) Furniture, and Cars have
Goods
77 become more attractive to
investors during 2017.
Apparel & Watches Cosmetics & Hotels Furniture Private Jets Yachts Cars Cruises Total Fashion
Accessories & Jewellery Fragrances & Luxury
Sector
breakdown 35.5% 13.4% 12.9% 21.2% 7.8% 4.6% 3.2% 0.9% 0.5% 100%
Var. #
deals +8 -9 +6 -7 +6 - - +2 - +6
2016-17
Source: Elaboration on Deloitte intelligence data
11Fashion & Luxury Private Equity and Investors Survey 2018 | M&A Deal Monitor 2017
Average value of main deals by sector
Deals related to the Cosmetics & Fragrances industry were the largest in 2017 with an average value of $390m.
The average deal value of PLG’s in 2017 was $293m.
Average value per deal in 2017 – Breakdown by sector
($m, percentage)
697
Personal Luxury Goods Other luxury sectors F&L average Key findings
The deal value of Christian Dior’s
acquisition by LVMH is not
considered in the perimeter
of the analysis Hotels and Watches & Jewellery
341 saw the average deal value fall in
2017.
Apparel & Accessories, Cosmetics
390 & Fragrances, Furniture, Yachts
and Private Jets recorded increases
(+9 per cent, +26 per cent, +102 per
Avg. PLG
$293m cent, +513 per cent and +64 per
230
cent respectively).
163
356 133 119
62
55 44
N/A
Apparel & Cosmetics F&L Hotels Watches Furniture Cars Yachts Private Jets Cruises
Accessories & Fragrances Average & Jewellery
513%
102%
64%
9% 26% N/A N/A
YoY 2016/17
(%)
-49% -37%
-80%
Notes: The average deal value has been calculated based upon data of disclosed transactions | Source: Elaboration on Deloitte intelligence data
12Fashion & Luxury Private Equity and Investors Survey 2018 | M&A Deal Monitor 2017
Target company features
Compared to the previous year, funds increased the number of deals related to smaller sized firms, delivering on
average higher multiples (41 per cent of deals with a >15x EV/EBITDA multiple). The increase in acquisitions of smaller
firms positively correlates with a higher average multiplier, showing how the F&L industry can be profitable even for
mid-sized investors.
Target company features - Sales class and multiples
(percentage, enterprise value - EV/EBITDA multiples)
Key findings
TARGET COMPANIES SALES CLASS CAGR Deal EV/EBITDA multiple CAGR
15-17 15-17 In 2017, investors were mostly oriented
100% 100% 100% 100% 100% 100% towards lower-sized firms ($0-$50m)
which accounted for 55 per cent of deals
Big Size
21% 16% (> $250m) -13% in the year, compared to 40 per cent in
28% % 2016.
42% 37% 41% > 15x -1%
There was a marked decrease in deals
Medium Size
29% -1% involving players of sizes larger than
($51-$250m)
30% $250m (-13 per cent CAGR 2015-17).
32% % Deals involving multiples superior to 15
34% times EBITDA increased, while there was
31% 31% 11 - 15x - a decline in deals positioned on EBITDA
multiples of 11–15 times.
Small size
55% +5%
49% ($0-$50 m)
40% % 20%
19% 17% 5 - 10x -5%
8% 9% 10% < 5x +16%
2015 2016 2017 2015 2016 2017
Notes: The target sales class has been calculated for all companies with financial data which is publicly available | Source: Elaboration on Deloitte intelligence data
13Fashion & Luxury Private Equity and Investors Survey 2018 | M&A Deal Monitor 2017
Investor profiles
Financial investors were 53 per cent of total bidders with Private Equity/Venture Capital representing 55 per cent of
them. 45 per cent of Strategic investors were involved in an Apparel & Accessories or Hotels related deal in 2017.
Main bidders’ profile
(percentage, number of deals)
Key findings
Financial investors +44 -43 Strategic investors Change in
number of Deals conducted by strategic investors,
100% 100% deals YoY
2016-17 mainly operating in the Apparel &
+24 Other Accessories, Hotels and Cosmetics &
26% 23% industries +6
O ther investors Fragrances sectors, represent 58 per
Yachts -1 cent of total deals. Nonetheless, there
4%
4% Furniture -3
+18 Watches was a notable decrease in deals driven
Financial Services 19% 10% -3
& Jewellery by strategic investors compared to the
47% 13% Cosmetics -13 previous year (-43 deals).
53% & Fragrances
There was a relevant increase in deals
Apparel conducted by financial investors (+44
+2 21%
& Accessories
-15
Private Equity/ 55% deals compared to 2016).
Venture Capital
24% Hotels -14
Breakdown by Breakdown by investor
investor type core industry
Source: Elaboration on Deloitte intelligence data
14Fashion & Luxury Private Equity and Investors Survey 2018 | M&A Deal Monitor 2017
Portfolio exit strategies
In 2017 there has been an increase in financial sellers (36 per cent vs 23 per cent of 2016), with the majority of
acquisitions carried out through buyouts (+55 YoY 2016-17).
Exit types vs investment strategies
(percentage, number of deals)
Exit types patterns Investment strategy by bidder type YoY 2016-17
Key findings
(deals)
100% 100% 100% 100% 100% 1% 100% Other -24
3% 2% 2% Turnarounds There was a slight decrease in M&A
Sponsor 7% 4% 3% -41
13% operations carried out by "strategic"
to sponsor 3% 10% 6% Consolidations -10
25% sellers in 2017 (64 per cent). In 2016 77
16% 10% 10% Acquisition
Financial 9% -9
Sponsor capital per cent of investors were "strategic".
20% Seller
to strategic
11% 36% 29%
19% 24%
Growth
capital
+1
Furthermore, the exit patterns of
25% financial investors increased from 23 per
cent in 2016 to 36 per cent in 2017.
Strategic
to sponsor
38% There was a strong growth in
39%
investments through a buyout (+55
Strategic deals). Strategic turnaround oriented
Seller 59%
52% 51% 54% Buyouts +55 deals, decreased sharply.
Strategic
64%
29% 25%
to strategic
2015 2016 2017 Financial Strategic Total
investor investor
Notes: The deal strategy analysis has been performed based upon data of disclosed transactions | Source: Elaboration on Deloitte intelligence data
15Fashion & Luxury Private Equity and Investors Survey 2018 | M&A Deal Monitor 2017
Bidders’ investment stake
Deals in the Personal Luxury Goods segments decreased by 11 percentage points, up front a general
reduction of majority stake deals, which account on average for 66 per cent of M&A activities in the F&L
sector.
Investment stakes by sector
(percentage)
76 28 25 17 11 9 7 1 1 175
21% 18% 18% 14%
34% Minority
36% 33%
45%
100% 100%
79% 82% 82% 86%
67% 66% Majority
64%
55%
Apparel & Watches Cosmetics & Furniture Hotels Private Jets Yachts Cruises Cars Total F&L
Accessories & Jewellery Fragrances
PERSONAL LUXURY GOODS OTHER LUXURY SECTORS
62% Majority 76% Majority
-11% pts Decrease -1 % pts Decrease
Notes: Undisclosed investment stakes deals have been excluded from the analysis | Source: Elaboration on Deloitte intelligence data
16Fashion & Luxury Private Equity and Investors Survey 2018 | Private Equity and Investors Survey 2018
Private Equity and Investors Survey 2018
Fashion & Luxury market outlook
Market outlook: FY2017-20 F&L sales index outlook
(index on sales 2010=100)
rising sales forecast Index
280
PLG idx growth: 1.2x
Investors expect PLG top players to achieve 1.2 260
Other lux idx growth: 1.3x
times the 2016 sales index by 2020, (~ 3 per cent
240
16-20 CAGR). Other luxury sectors are expected to 230
be at 1.3 times the 2016 value (~ 4 per cent 16-20 220 216
CAGR). 200
180 177
180
CAGR
160 2016-20F
140 Personal
Luxury Goods
~2.7%
120 Other luxury
sectors ~3.6%
100 Forecast
80
2010 2011 2012 2013 2014 2015 2016 2017 2020F
Notes: Values reported at constant exchange rates | Source: Elaboration on Company Financial Report data and Deloitte survey
17Fashion & Luxury Private Equity and Investors Survey 2018 | Private Equity and Investors Survey 2018
Market outlook: trend by F&L sector
In the next three years investors expect a sound growth in the Cosmetics & Fragrances and Digital Luxury
industries, confirming last years trend. A solid, but limited growth is also expected in the Apparel &
Accessories, Watches & Jewellery, Hotels and Furniture industries, while investors forecast Cars, Yachts and
Retailing as shrinking.
Expected F&L market trends for the next 3 years – Breakdown by sector
(index on responses)
Key findings
Strong Private Equity funds expect the F&L industry to grow by
Increase around 5-10 per cent annually in the next three years,
(>10% per
year) confirming last year’s sentiment.
The main sectors that will drive this growth are
Cosmetics & Fragrances and Digital Luxury, with growth
Increase
(5-10% per rates higher than 10 per cent and a continuously
year) improving sentiment. A slower trend is predicted for
Apparel & Accessories, Watches & Jewellery, Hotels
Stable
and Furniture (between 5-10 per cent annually), while
Decrease Private Jets will remain stable.
(< 0% per App&Acc Wat&Jew Cos&Fra Cars Hotels Yachts Private Furniture Retailing Digital Total
year) Jets Luxury F&L Forecasts are less favourable for Cars, Yachts and
Selective Retailing, where the growth rates might be
Personal Luxury Goods Other luxury sectors
negative and Private Equity sentiment is weakening
2017-18 change markedly.
in sentiment
Source: Elaboration on Deloitte survey
18Fashion & Luxury Private Equity and Investors Survey 2018 | Private Equity and Investors Survey 2018
Market outlook: trend by geographical area
Investors expect the Asian and the Middle Eastern areas to stimulate growth of the F&L industry, also
affecting the expectations on Japan, which has notably increased since the previous year. Latin America is
expected to consolidate even though sentiment has improved.
Expected F&L market trends for the next 3 years – Breakdown by region
(index on responses)
Key findings
Strong
increase
(> 10%
per year) Asia and the Middle East Fashion and Luxury markets
will drive the industry’s growth in the coming three
Increase years, with growth rates which might exceed 10 per
(5-10%
per year)
cent on an annual base.
Latin America is expected to consolidate even though
Stable
investor sentiment has seen a slight improve since the
Decrease previous year.
(< 0%
per year) Sentiment towards Japan has notably improved with
Europe North Latin Japan Asia Middle Rest of Total positive trends expected for the next 3 years.
America America East the world F&L
2017-18
change in
sentiment
Source: Elaboration on Deloitte survey
19Fashion & Luxury Private Equity and Investors Survey 2018 | Private Equity and Investors Survey 2018
2018 Exit and Investment Strategy
Funds’ F&L exit strategy for 2018
Funds considering divesting an F&L asset in 2018 are decreasing in number. The main drivers of exit are the
prospect of high returns, closing of the investment period and market trend mismatches, which are affecting
smaller multiples expected by investors.
Funds that are going to divest at least one asset in 2018
(percentage of respondents)
Key findings
-2%
pts 35 per cent of funds participating in the
35% survey project at least one disinvestment
within their F&L portfolio, a slight decrease
compared to the results of the survey
Exit drivers Exit strategies Exit multiple carried out last year (-2 percentage points).
(percentage of respondents) (percentage of respondents) (percentage of respondents)
The main drivers that will influence exits
100% 100% 100%
Other drivers
100% 100% 100% 100% 100% 100% will be: High Returns Opportunities (35 per
11% 6%
13% Other
18% Closing of the 20% cent), Market trends mismatches (35 per
24% investment 38% > 10x
26% 19% Second 44% (EV/EBITDA) cent) and Closing of the investment period
period 55%
29% 20% buyout
11%
Market trends
8% 19%
73% (24 per cent).
35% mismatch IPO
12% expectations In 50 per cent of cases, the exit will be
54% 60% Trade 56%
< 10x completed through operations of trade
52% High returns 50% 45% (EV/EBITDA)
41% 35% sale
sales, in which 44 per cent of investors will
opportunity 27%
pay an EBITDA multiple higher than 10x,
2016 2017 2018 2016 2017 2018 2016 2017 2018 a strong decrease compared to 2017’s
expectations when 55 per cent expected
multiples greater than 10x.
Source: Elaboration on Deloitte survey
20Fashion & Luxury Private Equity and Investors Survey 2018 | Preface and methodology
Expected new investments in 2018
Personal Luxury Goods remain the most attractive sectors for investors, with Apparel & Accessories and Cosmetics &
Fragrances becoming even more prominent. The relevant trend of Digital Luxury is stabilising.
100%
11% No
Most attractive sectors for investors Change in 2017-18
(percentage of respondents) (percentage points) Key findings
A pparel &
73% 5
Accessories The sectors considered to be most
Cosmetics & attractive based on survey respondents
60% 11
89 % Fragrances are: Apparel & Accessories (73 per cent),
of PE Yes Cosmetics & Fragrances (60 per cent),
Furniture 45% 18
funds Furniture (45 per cent) and Watches &
Watches Jewellery (19 per cent).
& Jewellery 19% -2
Interest in Watches & Jewellery is
Digital however slightly declining compared to
Luxury 16% -1
the 2017, with 2 percentage points less.
Selective Digital Luxury attracted 16 per cent of
Retailing 10% -21
Will your fund investors.
acquire an F&L Personal Luxury Goods Other F&L sectors
asset in 2018?
Source: Elaboration on Deloitte survey
21Fashion & Luxury Private Equity and Investors Survey 2018 | Private Equity and Investors Survey 2018
F&L sector attractiveness
Both Apparel & Accessories and Cosmetics & Fragrances are remarkably attractive to
investors. Furniture has shown a notable increase since 2017, becoming a star sector for
potential investment in the coming year.
Map of investor attraction in F&L sectors
25
Key findings
20
Virtualization trends in the consumer purchasing process are
15 Furniture leading to the creation of a new cluster of firms focusing on
Digital Luxury, mainly in the Cosmetics & Fragrances sector.
10 Cosmetics
& Fragrances The attraction towards the Watches & Jewellery and Digital
luxury sectors remains stable. Investors are attracted to less
Change in 2017-18
5
(percentage points)
Apparel volatile assets.
& Accessories
0 The appeal of Apparel & Accessories has fallen, yet the sector
Digital Watches remains the primary choice for investors, attracted by higher
-5
& Jewellery margin performances.
-10
-15
Personal Luxury Goods
Selective
-20 Other General investor propensity
Retailing
-25
0 10 % 20 % 30 % 40 % 50 % 60% 70% 80%
Investment propensity 2018
(percentage of respondents)
Source: Elaboration on Deloitte survey
22Fashion & Luxury Private Equity and Investors Survey 2018 | Private Equity and Investors Survey 2018
Sector attractiveness: current vs potential investors
While current investors are more attracted to diversify their investments towards innovative
segments such as Digital Luxury, newcomers prefer to invest in more traditional and
established F&L sectors.
Map of investor attraction in F&L sectors – Current vs potential investors
100 %
Attractive sectors for Key findings
90 % new investors
80 % Apparel As the most established sector, Apparel & Accessories remains
& Accessories the main target for all investors.
New F&L investors’ propensity
70 %
Funds with higher specialization in the industry tend to be more
Cosmetics
(percentage of respondents)
60 % & Fragrances attracted to innovative sectors such as Digital Luxury.
New potential investors focus on more traditional sectors such
50 % as Apparel & Accessories and Cosmetics & Fragrances.
Furniture has become an extremely attractive sector for
40 %
potential investors in 2018.
Furniture
30 %
Selective
Retailing
20 %
Watches
10 % & Jewellery
Attractive sectors for Personal Luxury Goods
0% Digital
current investors General investor propensity
-10 %
0% 10% 20% 30% 40% 50% 60% 70% 80% 90%
Current F&L investors’ propensity
(percentage of respondents)
Source: Elaboration on Deloitte survey
23Fashion & Luxury Private Equity and Investors Survey 2018 | Private Equity and Investors Survey 2018
Growth strategies for the F&L portfolio
Performance improvement and change management are becoming important drivers of F&L portfolios
growth strategies, combined with Internationalisation that is less accounted for as a strategy.
Main adopted strategic drivers for the F&L portfolio
(percentage of respondents)
44% Key findings
41%
38%
Internationalisation is now the main strategic lever (44 per
cent) adopted by F&L investors to grow their asset value.
89%
25% Even though it’s adoption has weakened since the previous
22% year, investors still see Digital Strategy Design (16 per
cent) as a relevant topic for F&L companies seeking faster
16%
growth.
Frequently, funds acquire underperforming companies,
aiming to bring sales growth and margins up to the average
sector performance.
International. Performance Change New distribution New production Digital strategy
improvement management channel development design
Change
in % points -23 +16 +19 -5 -2 -6
2017-18
Source: Elaboration on Deloitte survey
24Fashion & Luxury Private Equity and Investors Survey 2018 | Private Equity and Investors Survey 2018
Size of potential investment in F&L
The F&L industry is polarizing on investors looking to acquire small sized firms and industry giants,
through the acquisition of minority stakes.
Average sales of potential target companies
(percentage of respondents)
Key findings
100% 100% 100% 100% 100% 100% 100%
Investors are typically attracted to small (52 per cent)
16% 17% 18% 14% 18% +6 and medium-sized (30 per cent) businesses.
21%
89% 26%
Investments in 2017 oriented towards larger
21% companies has remained stable due to the continuous
9% 25% 30% -2
33% 35% 43% consolidation of the F&L industry.
Target companies in Apparel & Accessories, Cosmetics
& Fragrances, Watches & Jewellery and Furniture tend
65% 63% to be smaller ( $250m) Medium ($50-$250m) Small (< $50m) Change in 2017-18 (% points)
Source: Elaboration on Deloitte survey
25Fashion & Luxury Private Equity and Investors Survey 2018 | Private Equity and Investors Survey 2018
Main features of the M&A deal
The preferred deal strategies are Leveraged Buyout (LBO), Expansion Capital and Management Buyout (MBO), financed
mostly through senior debt, aimed at acquiring a majority stake in the targeted companies.
Structure of the new F&L investment deals
(percentage of respondents)
Key findings
Deal type Funding Stake
The main deal strategies adopted by
89% investors in 2017 are: LBO/Replacement
100% 100% 100% 100% 100% 100% 100% 100% 100%
(28 per cent), Expansion Capital (26 per
18% 13%
22% Other cent) and Support to the MBO (24 per
32% 30% Other
39% cent).
26% 29% Support
24% to MBO/MB Operations financed through senior
73%
23% Shareholders’ 81% 83% Majority debt have been increasing (47 per cent).
24% 15% loan
Shareholder’s loan has become one of
28% 25% Expansion
26% capital the most used sources.
Most deals focus on acquisitions of
46% 47% Senior debt
44% majority stakes.
33% LBO/
28% 28% Replacement 27%
19% 17% Minority
2016 2017 2018 2016 2017 2018 2016 2017 2018
Source: Elaboration on Deloitte survey
26Fashion & Luxury Private Equity and Investors Survey 2018 | Private Equity and Investors Survey 2018
Return expected from new investments
Investors forecast rates of return from their assets ranging from 21 per cent to 30 per cent, with Selective
Retailing and Apparel & Accessories expected as top performers (>30 per cent).
Internal Rate of Return (IRR) expected from new F&L investments
(percentage of respondents)
Key findings
100% 100% 100% 100% 100% 100%
5% 7%
14% 13% +3%
On average, funds expect an IRR from their investments
20%
89% ranging from 21 per cent to 30 per cent, while 13 per
cent forecast a higher performance (>30 per cent).
60% Lower expected rates of return for Watches & Jewellery
59% 74% 71% 59% -10%
do not play a major role in investors’ strategies, due to
57%
the lower volatility of this segment.
Selective Retailing and Apparel & Accessories are
expected to guarantee investors a higher IRR.
27% 40% 28%
21% 23% 22% +6%
App & Acc Cos & Fra Wat & Jew Retailing Furniture Total F&L
> 30% 21-30% 10-20% Change in 2017-18 (% points)
Source: Elaboration on Deloitte survey
27Fashion & Luxury Private Equity and Investors Survey 2018 | Private Equity and Investors Survey 2018
Return from new investments: small yields more
Respondents confirm the existence of a correlation between a target firm’s size and the expected rate of
return from investment. A return greater than 20 per cent is more likely from mid-sized and small firms, in
line with the investment plans of the surveyed investors.
IRR expected from new F&L investments – Breakdown by target company size
(percentage)
72% 28%
Big company
23% (> $250m)
30%
Target Turnover Size
Medium company
13% 29%
(percentage)
($50-$250m )
57%
48%
Small company
(< $50m)
< 20% > 20%
Expected IRR
(percentage)
Source: Elaboration on Deloitte survey
28Fashion & Luxury Private Equity and Investors Survey 2018 | Private Equity and Investors Survey 2018
Disruptive technologies in Fashion & Luxury
63 per cent of respondents will invest in disruptive technologies in order to benefit from potential synergies.
Internet of Things and Artificial Intelligence will have the largest impact on investors’ portfolios according to
respondents in 2017.
Fund likelihood Impact of disruptive technology based on portfolio type
of Investment (percentage)
in disruptive
technologies firms Key findings
(percentage)
Personal Luxury Goods (PLG)
13% 100%
9% The disruptive technologies considered to be of most
10%
19% impact on portfolios relevant to Personal Luxury
22% Goods are: Internet of Things (27 per cent), Big Data
27% & Analytics (22 per cent), Artificial Intelligence (19 per
cent), Healthtech (10 per cent) and Robotics (9 per
Internet of Big Data & Artificial Health Robotics Other Total PLG
cent) .
37% Things Analytics Intelligence Tech Considering other luxury sectors, the main disruptive
technologies perceived by F&L investors are: Internet
63% of Things (26 per cent), Artificial Intelligence (24 per
Other luxury sectors
10% 100% cent), Big Data & Analytics (22 per cent), Blockchain (11
11%
7% per cent) and Robotics (7 per cent).
22%
24%
Will probably invest 26%
in disruptive technologies
Internet of Artificial Big Data & Blockchain Robotics Other Other luxury
Things Intelligence Analytics sectors
Source: Elaboration on Deloitte survey
29Fashion & Luxury Private Equity and Investors Survey 2018 | Private Equity and Investors Survey 2018
Profile of survey respondents
Funds’ key features Fund strategy 100%
The main strategic 19% Other Fund core industries
approach of the involved
28% Growth
83 per cent of survey participants are medium-large funds is: buyout (53 per The main industries
cent) and growth (28 per represented in investors’
Private Equity Funds. In 22 per cent of cases, they
cent) strategies portfolios are: F&L (23 per
hold a portfolio of net assets greater than $1bn. 53% Buyout cent), Retail & Consumer
(21 per cent), Industrial (19
% of
per cent), and Healthcare
respondents (14 per cent)
Investor type
% of respondents
100%
Other types
Fund net assets 23% Other
17% 14% Healthcare
31 per cent of funds
participating in the 100% 19% Industrial
survey have net assets 83% Retail, Consumer
22% > $1bn 21%
ranging from $100-500m, & Leisure
while 22 per cent have 19% $501m -$1bn 23% Fashion&Luxury
full net assets greater Private Equity Fund
than $1bn 31% $100m - $500m % of
repondents
28% < $100m
% of
respondents
Note: (1) Other investors: Family offices, Luxury Holdings and Sovereign Wealth funds | Source: Elaboration on Deloitte survey
31Fashion & Luxury Private Equity and Investors Survey 2018 | Private Equity and Investors Survey 2018
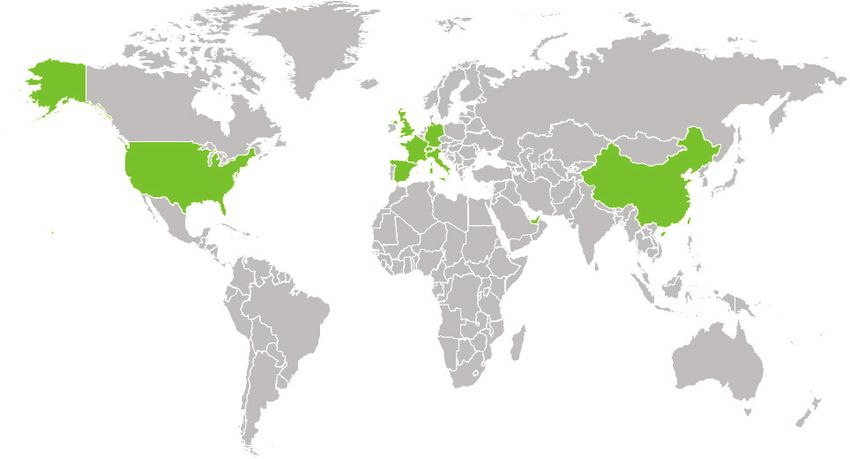
Profile of survey respondents
Respondents are senior members of their funds, with an in-depth knowledge of F&L industry.
RESPONDENTS’ LOCATIONS RESPONDENTS’ ROLES
(percentage of respondents)
Other
Director
and/or
Principal 6%
13%
Investment 16%
66%
manager
GLOBAL Managing Director
and/ or Partner
Main countries
Source: Elaboration on Deloitte survey
32Fashion & Luxury Private Equity and Investors Survey 2018 | Private Equity and Investors Survey 2018
Funds’ current F&L portfolio: main sectors
Investors mainly manage assets in Apparel & Accessories (66 per cent) and Cosmetics & Fragrances (28
per cent), Watches & Jewellery (25 per cent), Furniture (25 per cent) and Selective Retailing (16 per cent).
Main F&L assets managed by investors
(percentage of respondents)
66% 78% of investors have a Fashion & Luxury asset in their portfolio
56%
28%
25% 25%
16%
Apparel Cosmetics Watches Furniture Selective Other
& Accessories & Fragrances & Jewellery Retailing F&L sectors 1
Note: (1) “Other F&L Sectors” includes mainly: Digital Luxury (16 per cent), Hotels (16 per cent), Yachts (9 per cent), Cars (6 per cent) | Source: Elaboration on Deloitte survey
33Fashion & Luxury Private Equity and Investors Survey 2018 | Private Equity and Investors Survey 2018
Funds’ current F&L portfolio: structure
77 per cent of current F&L investors focus 25 per cent or less of their overall portfolio on the F&L industry. Investors usually hold
their F&L assets for less than 5 years, mostly with a majority stake (71 per cent).
Portfolio focus in F&L industry Portfolio equity stake and duration
(percentage of respondents) (percentage of respondents)
High focus
(>25% of AuM)
Minority > 5 years
+13
23% Medium focus 29%
(5 - 25% of AuM)
Equity 39%
-14 Duration
54% stake
61%
71%
23%
Low focus
(< 5% of AuM)
Majority < 5 years
+1
Change in 2017-18
(% points)
78% of investors have a Fashion & Luxury asset in their portfolio
Source: Elaboration on Deloitte survey
34Fashion & Luxury Private Equity and Investors Survey 2018 | Private Equity and Investors Survey 2018
Funds’ current F&L portfolio: average asset size
40 per cent of respondents have assets with an average turnover which is less than $50m. Large-sized assets (>$250m)
represent 30 per cent of the average portfolio.
Average turnover of F&L assets in investors’ portfolio
(percentage of respondents)
100%
10%
Large
30% assets
20%
17%
30% Medium
assets
13%
25%
40%
Small
assets
15%
< $25m $25-$50m $51-$100m $101-$250m $251m-$500m $501m-$1B Total F&L
investors
Source: Elaboration on Deloitte survey
35Fashion & Luxury Private Equity and Investors Survey 2018 | Glossary
Glossary
Main terms and abbreviations
Personal Luxury Goods Personal Luxury Goods include the following
sectors: Apparel & Accessories, Cosmetics &
Fragrances and Watches & Jewellery
App&Acc Abbreviation for Apparel & Accessories
AuM Acronym for Assets Under Management
CAGR Acronym for Compound Annual Growth Rate
Cos&Fra Abbreviation for Cosmetics & Fragrances
F&L Abbreviation for Fashion & Luxury
IRR Acronym for Internal Rate of Return
PE Acronym for Private Equity
PLG Acronym for Personal Luxury Goods
RoW Acronym for Rest of the World
Wat&Jew Abbreviation for Watches & Jewellery
37Fashion & Luxury Private Equity and Investors Survey 2018 | Glossary
Contacts
Deloitte Fashion & Luxury Leaders Deloitte Financial Advisory & Corporate Finance contacts
EMEA Fashion & Spain EMEA Corporate Italy Switzerland
Luxury Leader Juan José Peso Finance Consumer Elio Milantoni Stephan Bruecher
Patrizia Arienti Jpeso@deloitte.es Business Leader emilantoni@deloitte.it sbruecher@deloitte.ch
parienti@deloitte.it Elio Milantoni Tommaso Nastasi Howard Da Silva
Switzerland emilantoni@deloitte.it tnastasi@deloitte.it hdasilva@deloitte.ch
France Karine Szegedi
Benedicte Sabadie kszegedi@deloitte.ch China Japan UK
bsabadiefaure@deloitte.fr Ivan Man Kit Wong Satoshi Yokota Phillip Lane
Turkey ivawong@deloitte.com.hk satoshi.yokota@tohmatsu.co.jp plane@deloitte.co.uk
Germany Hakan Gol Ryukichi Sakuta Richard Lloyd-Owen
Philip Beil hgol@deloitte.com France rysakuta@deloitte.co.uk rlloydowen@deloitte.co.uk
pbeil@deloitte.de Claire Deguerry
UK cdeguerry@deloitte.fr Singapore USA
Italy Sundeep Khanna Lucile Regnault Jiak See Ng Lorin DeMordaunt
sundeepkhanna@deloitte.co.uk lregnault@deloitte.fr jsng@deloitte.com ldemordaunt@deloitte.com
Patrizia Arienti
parienti@deloitte.it
Germany Spain
Alexander Bielig Tomas De Heredia
abielig@deloitte.de tdeheredia@deloitte.es
Karsten Hollasch
Khollasch@deloitte.de
38This communication contains general information only, and none of Deloitte Touche Tohmatsu Limited, its member firms, or their related entities (collectively, the “Deloitte Network”) is, by means of this communication, rendering professional advice or services. Before making any decision or taking any action that may affect your finances or your business, you should consult a qualified professional adviser. No entity in the Deloitte Network shall be responsible for any loss whatsoever sustained by any person who relies on this communication. Deloitte refers to one or more of Deloitte Touche Tohmatsu Limited, a UK private company limited by guarantee (“DTTL”), its network of member firms, and their related entities. DTTL and each of its member firms are legally separate and independent entities. DTTL (also referred to as “Deloitte Global”) does not provide services to clients. Please see www.deloitte.com/about for a more detailed description of DTTL and its member firms. © 2018 Deloitte Italy S.p.A. Graphic Department - Italy | SG.065.18
You can also read