Intraocular Lens power calculation after laser refractive surgery: A Meta-Analysis - Nature
←
→
Page content transcription
If your browser does not render page correctly, please read the page content below
www.nature.com/scientificreports

            OPEN           Intraocular Lens power calculation
                           after laser refractive surgery: A
                           Meta-Analysis
                           Hui Chen1,2,3,4, Xinyi Chen1,2,4, Hanle Wang1,2, Zhi Fang1,2 & Ke Yao               1,2*

                           There are an increasing number of people who have had refractive surgery now developing cataract.
                           To compare the accuracy of different intraocular lens (IOL) power calculation formulas after laser
                           refractive surgery (photorefractive keratectomy or laser in situ keratomileusis), a comprehensive
                           literature search of PubMed and EMBASE was conducted to identify comparative cohort studies and
                           case series comparing different formulas: Haigis-L, Shammas-PL, SRK/T, Holladay 1 and Hoffer Q.
                           Seven cohort studies and three observational studies including 260 eyes were identified. There were
                           significant differences when Hoffer Q formula compared with SRK/T, Holladay 1. Holladay 1 formula
                           produced less prediction error than SRK/T formula in double-K method. Hoffer Q formula performed
                           best among SRK/T and Holladay 1 formulas in total and single-K method. In eyes with previous data,
                           it is recommended to choose double-K formula except SRK/T formula. In eyes with no previous data,
                           Haigis-L formula is recommended if available, if the fourth formula is unavailable, single-k Hoffer Q is a
                           good choice.

                           According to the latest assessment, cataracts account for 51% of the world’s blindness, that is about 20 million
                           people. Thus, cataract is still the main cause of blindness1. It only can be removed by surgery. In the past few
                           decades, the surgical technique has gone earth-shaking changes, from ICCE, ECCE to phacoemulsification and
                           femtosecond laser-assisted cataract surgery2. With the development of intraocular lenses (IOL), from unfoldable
                           IOL to foldable IOL, until now there are a number of functional IOLs such as Toric IOL, multifocal IOL, Symfony
                           IOL and adjustable IOL, resulting in more precise and comfortable postoperative refractive outcomes2, symbolize
                           cataract surgery coming into refractive times. Thus, patients hope not only clear, comfortable but also up to ideal
                           refractive status.
                               However, lens calculations are not perfect. Residual postoperative refractive error can be common, especially
                           in patients who undergone refractive corneal surgery before and are now developing cataracts3–6. In spite of a
                           good many of methods for IOL power calculation, the postoperative refractive errors are unpredictable in these
                           patients compared to those who have no refractive surgery experience. There are three kinds of reasons respon-
                           sible for the prediction error in intraocular lens calculation after refractive surgery: instrument error, refractive
                           index error and formula error7.
                               The first-generation formula is derived from the principle of geometric optics and using the thin lens
                           imaging formula, represented by the Binkhorst8, Colenbrander and regression formula SRK I formula9. The
                           second-generation formula are the regression formula SRKII formula that introduced after the improvement of
                           SRK I formula and the Binkhorst II formula based on the correction of the axial axis and the anterior chamber
                           depth (ACD)10. Soon after, the third-generation formulas came out. Holladay et al.11 introduced the corneal cur-
                           vature into the ACD calculation formula. Retzlaf et al.12 based on the SRK II formula, summed up the analysis of
                           1677 cases of the eye and came up with theoretical formula SRK/T. There is also the Hoffer Q formula, relying on a
                           personalized ACD, corneal curvature, and axial length13. The fourth-generation formulas include Holladay II for-
                           mula and the Haigis formula14. Compared with the previous three generations of formulas, the fourth-generation
                           formula takes the effective IOL position (ELP) into account, and to some extent realizes the individualization of
                           the IOL calculation. Recently, the fifth-generation formula Barrett Universal II has been applied to the clinic15.

                           1
                            Eye Center, Second Affiliated Hospital, School of Medicine, Zhejiang University, Hangzhou, Zhejiang, P.R. China.
                           2
                            Key Laboratory of Ophthalmology of Zhejiang Province, Hangzhou, Zhejiang, P.R. China. 3The Eye Hospital,
                           Wenzhou Medical University, Wenzhou, Zhejiang, P.R. China. 4These authors contributed equally: Hui Chen and Xinyi
                           Chen. *email: xlren@zju.edu.cn

Scientific Reports |   (2020) 10:2645 | https://doi.org/10.1038/s41598-020-59487-1                                                            1
www.nature.com/scientificreports/                                                               www.nature.com/scientificreports

                           Figure 1. Flow diagram of the literature search in this meta-analysis.

                               Refractive surgery is increasingly accepted and welcomed by the public. Over the past couple of years, refrac-
                           tive surgery technique has been developing rapidly, including radial keratotomy (RK), photorefractive keratec-
                           tomy (PRK), laser in situ keratomileusis (LASIK) and small-incision lenticule extraction (SMILE) etc. There
                           is no any formula has been universally acknowledged as having high accuracy in various eyes16 and the eye
                           features after refractive surgery are more complicated. Utilizing the erroneous K-reading in post-operative eyes
                           into standard IOL power calculation formulas leads to overestimation of keratometry diopters, then resulting in
                           underestimated power of IOL for hyperopia after cataract surgery17–19. Patients undergoing refractive surgery
                           usually have higher requirements for vision. Thus, they also hope to get perfect visual acuity after cataract surgery,
                           so the surgeon needs to find proper formula to ensure the accuracy of the intraocular lens power calculation.
                           For this subset of patients, a meta-analysis comparing different formulas to calculate IOL power was performed.

                           Results
                           Literature search. The flowchart (Fig. 1) shows the literature search process. After removing the duplicates,
                           there are 3,992 articles in total. Among them, 3936 records were excluded because of irrelevance or retrospective
                           research. 48 articles were read full text and then assessed. 22 of them had the irrelevant data to our outcomes
                           of interest, 12 of them were excluded because of only one target IOL calculation formula and the formulas in
                           2 studies were not included. Finally, 10 articles3,19–27 meeting all of the screening criteria were included in this
                           meta-analysis.

Scientific Reports |   (2020) 10:2645 | https://doi.org/10.1038/s41598-020-59487-1                                                             2
www.nature.com/scientificreports/ www.nature.com/scientificreports
Formula
Study No. of Shammas- Holladay Holladay Within Follow-
Study ID Country design Mean age eyes Surgery AL (mm) Haigis-L PL formula 1 SRK/T Hoffer Q 2 ME MAE percentage(D) up
Wu Prospective 3
China 50.3 ± 9.0 10 phaco 30.06 ± 2.87 ✓ ✓ ✓ NA ±0.5,1.0,1.5
201720 cohort months
Helaly Prospective 4
Egypt 51.27 ± 7.31 45 phaco 28.66 ± 2.78 ✓ ✓ Double-K ✓ ✓ ±0.5,1.0,2.0
201619 cohort months
Huang Prospective 1
America 61.5 ± 8.0 46 phaco NA ✓ ✓ ✓ NA ±0.5,1.0
201321 cohort month
Savini Prospective 1
America 52.5 ± 9.6 28 phaco 27.84 ± 1.90 Double-K Double-K ✓ ✓ NA
201022 cohort month
Prospective
Jin 201023 Germany 31.81 ± 7.49 28 phaco 24.94 ± 1.08 ✓ ✓ ✓ NA ✓ NA 1 year
cohort
Arce Prospective
America NA 32 phaco NA ✓ ✓ ✓ ✓ ✓ ✓ NA 2 years
200924 cohort
Shammas Prospective 12
America 28 to 67 15 phaco 27.19 ± 2.52 ✓ ✓ Double-K Double-K Double-K Double-K ✓ ✓ ±1.0,
20073 cohort weeks
Savini Prospective
Italy 56.4 ± 8.3 22 phaco 26.7 ± 1.7 Double-K Double-K ✓ NA ±0.5,0.75,1.0 NA
201825 case series
Savini Prospective
America 50.1 ± 9.2 30 phaco 27.06 ± 2.05 Double-K Double-K Double-K ✓ NA ±0.5 NA
201526 case series
Wang Prospective
America 50 11 phaco 25.99 ✓ ✓ ✓ ✓ ✓ ✓ NA 1 year
200427 case series
Table 1. Characteristics of included studies. AL, axial length; ME, mean error; MAE, mean absolute error; NA,
not available.
Characteristics of included studies. In the present meta-analysis, ten studies were included, seven of
which were comparative cohort studies and three of which were prospective case series. Table 1 shows the char-
acteristics of the ten studies. The quality assessment(NOS scale) of the comparative cohort studies and case series
studies is shown in Table 1. Overall, 267 eyes having refractive surgery history were analyzed. The mean age of
the patients in these included studies ranged from 28 to 61 years and the mean axial length(AL) ranged from 25
to 30 mm. Six studies were completed in America, one in China, one in Egypt, and the remaining two in Europe.
The follow-up duration ranged from 1 month to 2 years.
Outcomes. Haigis-L vs Shammas-PL. There were four studies comparing Haigis-L and Shammas-PL for-
mulas, two of which reported MAE(Fig. 2a) and all four studies reported ME(Fig. 2b). There was no significant
difference both in MAE (WMD: 0.16, 95% CI: −0.02 to 0.35, P = 0.09) and ME (WMD: −0.11, 95% CI: −0.30 to
0.09, P = 0.53) between Haigis-L and Shammas-PL formulas. Similarly, the percentage of eyes within ±1.00D of
prediction error showed no significant difference between these two formulas.(Fig. 2c)
Haigis-L vs SRK/T. There were four studies reporting Haigis-L and SRK/T formulas in MAE, showing no signifi-
cant difference between two formulas in total. Then two subgroups (Single-K and Double-K) were added to analyze
as shown in Fig. 3. Neither single-K group nor double-K group had significant difference between two formulas.
Haigis-L vs Hoffer Q. Three studies compare Haigis-L and Hoffer Q formulas. There was no significant difference
in MAE (WMD: −0.11, 95% CI: −0.41 to 0.20, P = 0.50) (Fig. 4). Similar outcome in ME was shown in Fig. S1.
Haigis-L vs Holladay 1. No significant difference was found in MAE(WMD: 0.09, 95% CI: −0.18 to 0.36,
P = 0.52) and ME(WMD: −0.62, 95% CI: −1.45 to 0.21, P = 0.14)when comparing Haigis-L and Holladya1 for-
mulas of two articles, as shown in Figs. 5 and S2 respectively.
SRK/T vs Holladay 1. There were six studies comparing SRK/T and Holladay 1 formulas, four of which reported
MAE(Fig. 6) and all six studies reported ME(Fig. S3). The forest plot of the comparison in Fig. 6 showed no sig-
nificant difference between SRK/T and Holladay1 formulas in the MAE in total. Then two subgroups (Single-K
and Double-K) were considered to estimate. The MAE in the double-K subgroup of Holladay1 was significantly
lower than that of SRK/T(WMD: 0.22, 95% CI: 0.03 to 0.42, P = 0.03) while there was no significant difference in
the single-k subgroup. As for ME, no significant difference was found.
SRK/T vs Hoffer Q. The MAE was compared between SRK/T and Hoffer Q formulas in four studies. As shown in
Fig. 7, the MAE of Hoffer Q was significantly lower than that of SRK/T in total(WMD: 0.26, 95% CI: 0.03 to 0.50,
P = 0.03). Two subgroups (Single-K and Double-K) were added to access MAE of SRK/T and Hoffer Q formulas.
It was significantly different between them in the single-K group (WMD: 0.59, 95% CI: 0.25 to 0.93, P = 0.0006)
based on a random-effects model. However, no significant difference in the double-K group was found.
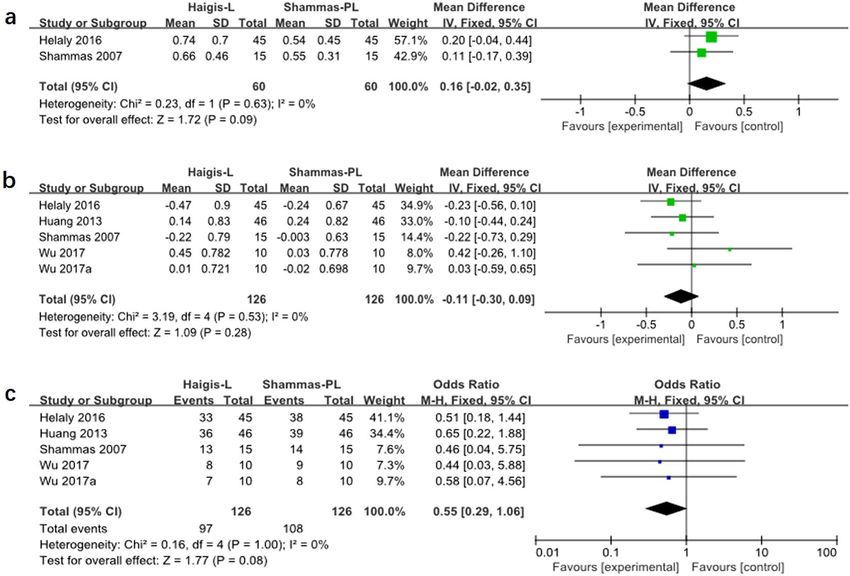
Holladay 1 vs Hoffer Q. As shown in Fig. 8, the MAE of Hoffer Q was significantly lower than that of Holladay
1 in single-K group(WMD: 0.26, 95% CI: 0.01 to 0.51, P = 0.04). And there was no significant difference between
these two formulas in double-K group and in total. Similarly, the ME of Hoffer Q was significantly lower than that
of Holladay 1 in single-K group (WMD: 0.26, 95% CI: 0.01 to 0.51, P = 0.04) (Fig. S4).
Scientific Reports | (2020) 10:2645 | https://doi.org/10.1038/s41598-020-59487-1 3
www.nature.com/scientificreports/                                                           www.nature.com/scientificreports

                           Figure 2. Forest plots comparing the MAE(a), ME(b) between Haigis-L and Shammas-PL. and the percentage
                           of eyes within ±1.00D of prediction error between Haigis-L and Shammas-PL (c).

                           Figure 3. Forest plots comparing the MAE between Haigis-L and SRK/T.

                           Figure 4. Forest plots comparing the MAE between Haigis-L and Hoffer Q.

                           Heterogeneity and publication bias. Some of the outcomes displayed great heterogeneity and then used
                           random‐effect model. The sensitivity analysis showed that I2 significantly decreased by omitting Jin 2010 in the
                           comparison between Haigis-L and SRK/T and between SRK/T and Hoffer Q.

Scientific Reports |   (2020) 10:2645 | https://doi.org/10.1038/s41598-020-59487-1                                                       4
www.nature.com/scientificreports/                                                        www.nature.com/scientificreports

                           Figure 5. Forest plots comparing the MAE between Haigis-L and Holladay 1.

                           Figure 6. Forest plots comparing the MAE between SRK/T and Holladay 1.

                           Figure 7. Forest plots comparing the MAE between SRK/T and Hoffer Q.

                           Discussion
                           The results of the present meta-analysis demonstrated that Holladay1 formula produced less prediction error
                           than SRK/T formula in double-K method. Hoffer Q formula performed best among SRK/T and Holladay1 for-
                           mulas in single-K method. While there was no significant difference between double-K Hoffer Q and double-K

Scientific Reports |   (2020) 10:2645 | https://doi.org/10.1038/s41598-020-59487-1                                                  5
www.nature.com/scientificreports/ www.nature.com/scientificreports
Figure 8. Forest plots comparing the MAE between Holladay 1 and Hoffer Q.
SRK/T formulas or double-K Hoffer Q and double-K Holladay1 formulas. The MAE was no significant difference
when Haigis-L formula compared with Shammas-PL, Hoffer Q, SRK/T or Holladay 1 formulas. While the ME of
Haigis-L formula performed better than Hoffer Q formula.
Aramberri17 introduced that there are two main challenges in intraocular lens power calculation after refrac-
tive surgery: inaccurate estimation of corneal power and inaccurate calculation formula. In clinic, current
topography can only measure anterior corneal power. It is inaccurate to measure the net corneal power in eyes
undergone keratorefractive surgery. Because the relationship between the anterior and posterior corneal radius
of curvature has been changed, it means that it is no longer 7.5/6.3. This will make the values of different corneal
refractive indices meaningless (standardized index of refraction = 1.3375; SRK/T = 1.3333).
In addition, K value is applied in 2 ways in third-generation IOL calculation formulas: (1) to compute the
effective lens position (ELP) and (2) to calculate the IOL power28. The first step is considered to estimate the
anterior chamber depth (ACD). That means assuming the ACD is constant after refractive surgery, then using a
lower than original K-value due to keratorefractive surgery will lead to an underestimation of the ELP and then
an underestimation of IOL power, eventually a postoperative hyperopia drift. To solve this problem, Aramberri17
proposed the “double-K method”, in which K value before operation was used to calculate the ELP, and K value
after surgery was used to calculate IOL power. It made it possible to obtain more accurate IOL power. In the pres-
ent meta-analysis, for single formula, mean value of double-k method was lower than single-k method. There was
no significant difference between Hoffer Q and SRK/T, Hoffer Q and Holladay 1 in double-k method. To a certain
extent, actually, we believed accuracy of above formulas was improved in double-k method so that obvious dif-
ference was cannot be detected. However, the MAE of Hoffer Q was significantly lower than SRK/T or Holladay
1 in single-k method.
Haigis-L formula is commonly applied to calculate IOL power in the clinic. Together with Shammas-PL for-
mula3 are belong to no-history method. Unlike most formulas, Shammas-PL and Haigis-L can determine ELP
without knowing the central corneal refraction. The results of the present study are consistent with previous
studies. Chen et al.29 found it was similarly accurate when the Shammas-PL formula was compared with the
Haigis-L method in eyes after laser refractive surgery. And it was consistent with our result. While Saiki et al.30
reported that Shammas-PL performed better than Haigis-L formula due to relatively few calculation parameters
and fewer measurement errors. In the present study, additionally, the MAE of Haigis-L formula was not signif-
icantly different with Hoffer Q, SRK/T or Holladay 1 formulas. The comparison between Shammas-PL and the
third-generation formulas did not be analyzed because of too little study. Recent years, Barrett True-K formula
has been proposed for IOL power calculation in post- keratorefractive surgery. The refractive prediction error of
the Barrett True-K formula is comparable to that of Haigis-L or Shammas formula, and even better than that of
Haigis-L or Shammas formula31,32. Future more studies are needed to explore it.
Unavoidably, there are several limitations in this meta‐analysis. First, only a small set of researches were
enrolled in this meta-analysis, resulting in some comparison available in only 1 combination. Second, the ante-
rior corneal surfaces in studies were obtained by different instruments (Scheimpflug imaging, Partial coherence
interferometry, PCI, Optical coherence tomography) rather than the same topography device. We believe that the
instruments used in different hospitals are not the same, which is more in line with the actual situation.
To conclusion, the methods fall into two categories: clinical history and no history. Double-k formulas are
recommended for IOL power calculation in eyes with pre-keratorefractive surgery data due to their improved
accuracy, while double-k SRK/T is not recommended. Haigis-L formula, if available, is recommended in eyes
with no history data. Single-K Hoffer Q formula would be a good choice if there is no fourth-generation formula.
Haigis-L is not significantly different with Shammas-PL formula, thus it is no need to introduce Shammas-PL
formula into instruments, after all, Haigis-L formula has been widely used.
Scientific Reports | (2020) 10:2645 | https://doi.org/10.1038/s41598-020-59487-1 6www.nature.com/scientificreports/ www.nature.com/scientificreports
Methods
Literature search. PubMed and EMBASE were searched for articles dated up to March 2019, using the
following terms: (PRK OR LASIK) AND (cataract OR IOL OR intraocular lens). There is no restriction on the
language of the publication. Two independent reviewers (H.C and XY.C) first conducted a preliminary review
of titles and abstracts, and then analyzed the full articles to select the studies that met our predefined criteria.
Disagreement between two reviewers was resolved through careful discussion—involving a third reviewer when
necessary—until a consensus was reached.
Inclusion and exclusion criteria. Included articles met the following inclusion criteria: (1) focused on
individuals with corneal refractive surgery history; (2) eyes undergone uncomplicated cataract surgery with in‐
the‐bag fixated IOL implantation; (3) used at least two of the selected IOL power calculation formulas (Haigis-L,
Shammas-post LASIK, SRK/T, Holladay 1, Hoffer Q). Articles were excluded when they: (1) eyes with other
disorders e.g., glaucoma, uveitis, or macular degeneration; (2) using toric, multifocal or piggyback IOL; (3) were
review articles or discussion papers, conference abstracts, retrospective studies or studies done on animals.
Quality assessment. Two reviewers evaluated the quality assessment of the cohort study and case series
independently by the Newcastle-Ottawa Scale (NOS)33. This scale uses a total of nine stars: four in patient selec-
tion, two in comparability, and three in outcome assessment. A score ≥6 indicates good quality.
Data extraction. A standard form was used to extract the data, including authors, country and year of pub-
lication, study design, numbers, age and sex of patients, eye sample size, left-right eye proportion, mean absolute
errors (MAE), mean arithmetic error(ME) and the percentage of eyes within ±1.00D of prediction error data. A
second researchers double-checked all data.
Statistical analysis. Using RevMan software (version 5.3; Cochrane Collaboration, Oxford, United
Kingdom) to perform all statistical analyses. The weighted mean difference (WMD) with a 95% CI was calculated
for the continuous outcomes. A p-value less than 0.05 was considered statistically significant. The odds ratio (OR)
was calculated to estimate the percentage of eyes within ± 1.00D of prediction error. The I2 value was used to test
the statistical heterogeneity. A random-effect meta-regression model was used when significant heterogeneity
(I2 > 50%) were found. Otherwise, a fixed-effect meta-regression model was chosen. Using a Beg funnel plot
to test Publication bias. A sensitivity analysis was conducted to assess whether the results were affected by the
excessive weight of a single study.
Received: 22 July 2019; Accepted: 23 January 2020;
Published: xx xx xxxx
References
1. Hamdi, I. M., Artola, A. & Alio, J. L. New frontiers for the perioperative data method for iol calculation following corneal refractive
surgeries. European journal of ophthalmology. 16, 809–815 (2006).
2. Davis, G. The evolution of cataract surgery. Mo Med. 113, 58–62 (2016).
3. Shammas, H. J. & Shammas, M. C. No-history method of intraocular lens power calculation for cataract surgery after myopic laser
in situ keratomileusis. Journal of cataract and refractive surgery. 33, 31–36, https://doi.org/10.1016/j.jcrs.2006.08.045 (2007).
4. Borasio, E., Stevens, J. & Smith, G. T. Estimation of true corneal power after keratorefractive surgery in eyes requiring cataract
surgery: Besst formula. Journal of cataract and refractive surgery. 32, 2004–2014, https://doi.org/10.1016/j.jcrs.2006.08.037 (2006).
5. Masket, S. & Masket, S. E. Simple regression formula for intraocular lens power adjustment in eyes requiring cataract surgery after
excimer laser photoablation. Journal of cataract and refractive surgery. 32, 430–434, https://doi.org/10.1016/j.jcrs.2005.12.106 (2006).
6. Haigis, W. Intraocular lens calculation after refractive surgery for myopia: Haigis-l formula. Journal of cataract and refractive surgery.
34, 1658–1663, https://doi.org/10.1016/j.jcrs.2008.06.029 (2008).
7. McCarthy, M., Gavanski, G. M., Paton, K. E. & Holland, S. P. Intraocular lens power calculations after myopic laser refractive
surgery: A comparison of methods in 173 eyes. Ophthalmology. 118, 940–944, https://doi.org/10.1016/j.ophtha.2010.08.048 (2011).
8. Binkhorst, R. D. The optical design of intraocular lens implants. Ophthalmic Surgery. 6, 17–31 (1975).
9. Sanders, D., Retzlaff, J. & Kraff, M. Comparison of the accuracy of the binkhorst, colenbrander, and srk(tm) implant power
prediction formulas. American Intra-Ocular Implant Society Journal. 7, 337–340 (1981).
10. Sanders, D. R., Retzlaff, J. & Kraff, M. C. Comparison of the srk iiρ formula and othr second generation formulas. Journal of cataract
and refractive surgery. 14, 136–141 (1988).
11. Holladay, J. T. et al. A three-part system for refining intraocular lens power calculations. Journal of cataract and refractive surgery. 14,
17–24 (1988).
12. Retzlaff, J. A., Sanders, D. R. & Kraff, M. C. Development of the srk/t intraocular lens implant power calculation formula. Journal of
cataract and refractive surgery. 16, 333–340 (1990).
13. Hoffer, K. J. The hoffer q formula: A comparison of theoretic and regression formulas. Journal of cataract and refractive surgery. 19,
700–712 (1993).
14. Haigis, W., Lege, B., Miller, N. & Schneider, B. Comparison of immersion ultrasound biometry and partial coherence interferometry
for intraocular lens calculation according to haigis. Graefe’s Archive for Clinical and Experimental Ophthalmology. 238, 765–773
(2000).
15. Zhang, Y. et al. Accuracy of intraocular lens power calculation formulas for highly myopic eyes. Journal of ophthalmology. 2016,
1917268, https://doi.org/10.1155/2016/1917268 (2016).
16. Melles, R. B., Holladay, J. T. & Chang, W. J. Accuracy of intraocular lens calculation formulas. Ophthalmology. 125, 169–178, https://
doi.org/10.1016/j.ophtha.2017.08.027 (2018).
17. Aramberri, J. Intraocular lens power calculation after corneal refractive surgery: Double-k method. Journal of cataract and refractive
surgery 29, 2063–2068 (2003).
18. Seitz, B., Langenbucher, A., Nguyen, N. X., Kus, M. M. & Kuchle, M. Underestimation of intraocular lens power for cataract surgery
after myopic photorefractive keratectomy. Ophthalmology. 106, 693–702, https://doi.org/10.1016/s0161-6420(99)90153-7 (1999).
19. Helaly, H. A., El-Hifnawy, M. A. M., Shaheen, M. S. & Abou El-Kheir, A. F. Accuracy of corneal power measurements for intraocular
lens power calculation after myopic laser in situ keratomileusis. Middle East African journal of ophthalmology. 23, 122–128, https://
doi.org/10.4103/0974-9233.171755 (2016).
Scientific Reports | (2020) 10:2645 | https://doi.org/10.1038/s41598-020-59487-1 7www.nature.com/scientificreports/ www.nature.com/scientificreports
20. Wu, Y., Liu, S. & Liao, R. Prediction accuracy of intraocular lens power calculation methods after laser refractive surgery. BMC
ophthalmology. 17, 44, https://doi.org/10.1186/s12886-017-0439-x (2017).
21. Huang, D. et al. Optical coherence tomography-based corneal power measurement and intraocular lens power calculation following
laser vision correction (an american ophthalmological society thesis). Transactions of the American Ophthalmological Society. 111,
34–45 (2013).
22. Savini, G., Hoffer, K. J., Carbonelli, M. & Barboni, P. Intraocular lens power calculation after myopic excimer laser surgery: Clinical
comparison of published methods. Journal of cataract and refractive surgery. 36, 1455–1465, https://doi.org/10.1016/j.
jcrs.2010.02.029 (2010).
23. Jin, H. et al. Intraocular lens power calculation after laser refractive surgery: Corrective algorithm for corneal power estimation.
Journal of cataract and refractive surgery. 36, 87–96, https://doi.org/10.1016/j.jcrs.2009.07.011 (2010).
24. Arce, C. G. et al. Calculation of intraocular lens power using orbscan ii quantitative area topography after corneal refractive surgery.
Journal of refractive surgery (Thorofare, N. J.: 1995) 25, 1061–1074, https://doi.org/10.3928/1081597x-20091117-05 (2009).
25. Savini, G., Hoffer, K. J., Schiano-Lomoriello, D. & Barboni, P. Intraocular lens power calculation using a placido disk–scheimpflug
tomographer in eyes that had previous myopic corneal excimer laser surgery. Journal of cataract and refractive surgery. 44, 935–941,
https://doi.org/10.1016/j.jcrs.2018.05.018 (2018).
26. Savini, G., Barboni, P., Carbonelli, M., Ducoli, P. & Hoffer, K. J. Intraocular lens power calculation after myopic excimer laser
surgery: Selecting the best method using available clinical data. Journal of cataract and refractive surgery. 41, 1880–1888, https://doi.
org/10.1016/j.jcrs.2015.10.026 (2015).
27. Wang L., Booth M. A. & Koch D. D. Comparison of intraocular lens power calculation methods in eyes that have undergone laser-
assisted in-situ keratomileusis. Transactions of the American Ophthalmological Society. 102, 189–196; discussion 196–187; (2004).
28. Koch, D. D. & Wang, L. Calculating iol power in eyes that have had refractive surgery. Journal of Cataract & Refractive Surgery. 29,
2039–2042 (2003).
29. Chen, X., Yuan, F. & Wu, L. Metaanalysis of intraocular lens power calculation after laser refractive surgery in myopic eyes. Journal
of cataract and refractive surgery. 42, 163–170, https://doi.org/10.1016/j.jcrs.2015.12.005 (2016).
30. Saiki, M. et al. Ray tracing software for intraocular lens power calculation after corneal excimer laser surgery. Japanese journal of
ophthalmology. 58, 276–281, https://doi.org/10.1007/s10384-014-0304-x (2014).
31. Abulafia, A., Hill, W. E., Koch, D. D., Wang, L. & Barrett, G. D. Accuracy of the barrett true-k formula for intraocular lens power
prediction after laser in situ keratomileusis or photorefractive keratectomy for myopia. Journal of cataract and refractive surgery. 42,
363–369, https://doi.org/10.1016/j.jcrs.2015.11.039 (2016).
32. Wang, L., Tang, M., Huang, D., Weikert, M. P. & Koch, D. D. Comparison of newer intraocular lens power calculation methods for
eyes after corneal refractive surgery. Ophthalmology. 122, 2443–2449, https://doi.org/10.1016/j.ophtha.2015.08.037 (2015).
33. Stang, A. Critical evaluation of the newcastle-ottawa scale for the assessment of the quality of nonrandomized studies in meta-
analyses. Eur. J. Epidemiol. 25, 603–605, https://doi.org/10.1007/s10654-010-9491-z (2010).
Acknowledgements
This study was supported by Program of National Natural Science Foundation (No. 81570822, No. 81870641) and
Zhejiang Key Laboratory Fund of China (No. 2011E10006).
Author contributions
K.Y., H.C. and X.Y.C. designed this study. H.C., X.Y.C., H.L.W. and Z.F. collected and double checked the data.
H.C. and X.Y.C. analyzed the data. H.C. wrote the paper. K.Y. and X.Y.C. provided critical revision to the article.
All authors participated in revision and approved the final version for submission.
Competing interests
The authors declare no competing interests.
Additional information
Supplementary information is available for this paper at https://doi.org/10.1038/s41598-020-59487-1.
Correspondence and requests for materials should be addressed to K.Y.
Reprints and permissions information is available at www.nature.com/reprints.
Publisher’s note Springer Nature remains neutral with regard to jurisdictional claims in published maps and
institutional affiliations.
Open Access This article is licensed under a Creative Commons Attribution 4.0 International
License, which permits use, sharing, adaptation, distribution and reproduction in any medium or
format, as long as you give appropriate credit to the original author(s) and the source, provide a link to the Cre-
ative Commons license, and indicate if changes were made. The images or other third party material in this
article are included in the article’s Creative Commons license, unless indicated otherwise in a credit line to the
material. If material is not included in the article’s Creative Commons license and your intended use is not per-
mitted by statutory regulation or exceeds the permitted use, you will need to obtain permission directly from the
copyright holder. To view a copy of this license, visit http://creativecommons.org/licenses/by/4.0/.
© The Author(s) 2020
Scientific Reports | (2020) 10:2645 | https://doi.org/10.1038/s41598-020-59487-1 8You can also read