Consultation on assessing and addressing the market impact of MSCI Index Reviews - August 2020
←
→
Page content transcription
If your browser does not render page correctly, please read the page content below
Consultation on assessing and
addressing the market impact of
MSCI Index Reviews
August 2020

                                                © 2020 MSCI Inc. All rights reserved.
                          Please refer to the disclaimer at the end of this document.
Background
➢ Continued growth in index linked product AUM and index based investing over the last
decade have led MSCI to conduct a focused examination around potential index methodology
changes that may better address the overall market impact of Index Reviews
➢ MSCI opens a consultation around the following proposals which can potentially ease
replication and related index review implementation challenges:
▪ ‘Staggering’ the implementation of all Semi-Annual (SAIR) and Quarterly Index Reviews
(QIR) for both Global Investable Market Indexes (GIMI) and Non-Market Cap Weighted
Indexes
▪ Switch a Semi-Annual Index Review to a “light” rebalancing scenario under conditions of
market stress as introduced by the MSCI Market Monitoring Framework*
➢ MSCI may additionally launch a subsequent consultation on selected technical aspects of the
topics covered herein
➢ MSCI welcomes feedback from the investment community on these topics until December 15,
2020. MSCI will announce the results of this consultation on or before January 31, 2021
*The MSCI Market Monitoring Framework aims to continually assess the potential impact of market
conditions on regular Index Reviews along three key dimensions: Market Functioning, Market Liquidity 2
and Data Availability.Proposal Summary
Market Conditions Proposal/Recommendation Rationale
❑ Employ a staggered ▪ Increased market impact due the AUM growth
implementation* of rebalancing
▪ Significant growth in Daily Traded Values on IR
for GIMI and Non-Market cap
‘Normal’ weighted Indexes to ease
implementation dates
potential market impact around ▪ Efficient way to manage the size of the IR ‘trade’
index review implementation ▪ Market participant feedback
❑ Additionally opt for a “light” (QIR) ▪ Material increase in market impact (bid/offer size)
rebalancing to replace a SAIR in and transaction costs
‘Market Stress’ times of extreme market volatility ▪ Potential increase in migrations due to extreme
to reduce the rebalancing impact volatility
*A staggered implementation refers to an Index Review that will be implemented over a
period of time leading into the effective date (i.e. approximately 33% of overall ‘trade’ each day for 3
days)
3Index Review Implementation
under Normal Market Conditions
Proposal
© 2020 MSCI Inc. All rights reserved.
Please refer to the disclaimer at the end of this document.Proposal: Staggered Implementation as a More Efficient
Way to Manage the Index Review
➢In addition to the substantial growth in index linked product AUM and index
based investing already noted, we have also observed significant growth in
Daily Traded Values on Index Review implementation dates (T-1)
➢Based on historical analysis, using a ‘staggered’ implementation approach
may have been beneficial in managing overall transaction costs
➢ MSCI proposes to implement a staggered approach across the
implementation of MSCI Index Reviews
▪ Staggering an index review implementation involves the conversion
from ‘current’ index to ‘pro forma’ index over an implementation period
that would commence 3 days prior to the Index Review effective date
▪ MSCI proposes to apply a staggered implementation
consistently across the MSCI Global Investable Market Indexes
(GIMI) and all Non-Market Cap Weighted Indexes
5Staggered Implementation: Illustration
• During an Index Review, the index changes are defined in terms of the ‘number of
shares changes in the index*’ (NOS)
‒ Staggering the NOS changes allows the index review implementation to be
determined ahead and helps avoid potential reverse turnover in the staggering
period
• With the current single day implementation, the NOS changes are expected to change
as follows:
Current T-3 T-2 T-1 Effective Date
Company A - add 0 0 0 7,500 7,500
NOS Change 7,500
Company B – delete 5,100 5,100 5,100 0 0
NOS Change -5,100
Company C – FIF/NOS 6,000 6,000 6,000 6,300 6,300
NOS Change 300
• With the proposed staggered 3-day implementation, the NOS changes will be linearly
spread across 3 days, thereby reducing the number of shares to be traded per day to
replicate
Current Stagger day1 Stagger day2 Stagger day3 Effective
Company A - add 0 2,500 5,000 7,500 7,500
NOS Change 2,500 2,500 2,500
Company B – delete 5,100 3,400 1,700 0 0
NOS Change -1,700 -1,700 -1,700
Company C – FIF/NOS 6,000 6,100 6,200 6,300 6,300
NOS Change 100 100 100
* Number of shares changes in the index for the MSCI GIMI is calculated as the index number of shares
multiplied by the Foreign Inclusion Factor (FIF) 6Impact of Staggered Implementation on Corporate Events
Various corporate events that impact MSCI Indexes around the implementation dates
can be grouped into 3 broad categories:
Event Event
Impact
confirmation date effective date
Post Rebalance Ann Before staggering
Case 1 No impact to staggered values
Date period
Prior to Rebalance Within staggering No staggering until the effective date of the event,
Case 2
Ann Date period followed by relatively larger changes
Post Rebalance Ann Within staggering Maintain the NOS announced on t-9 until the effective
Case 3
Date period date of the event, re-evaluate staggering post that
Timeline
May 18 May 19 May 20 May 21 May 22 May 25 May 26 May 27 May 28 May 29 Jun 1
From T-8 to T-4 From T-3 to T-1
T-9 T-8 (Pro-forma period prior to T-4 T-3 (Staggering T-1 T
staggering) Period) Effective
Rebalance Ann
Date Date
7Potential Impact of a Staggered Rebalancing
➢ A staggered rebalancing approach aims to split the implementation of rebalancing
changes into several steps until it is fully implemented in the index
➢ Three days could provide a good balance between transaction cost reduction and
sufficient time for implementation
Potential Marginal benefit of staggering
600 30 bln 6 bln 1.2 bln 1 bln 200 mln 40 mln
Transaction Cost (bps)
500
While the marginal benefit
400
may decrease with trade
size, a staggered approach 300
could allow for lower
200
transaction costs
100
0
Staggering rebal of ACWI May-20 SAIR change portfolio, if implemented on 15-May-20
Source: MSCI, Virtu
*For this analysis, a model (by Virtu) was used which measures trading costs using the difference between the
average execution price and the prevailing price at the start of the order execution. This measure includes both the bid-
ask spread as well as the price impact cost of the order. For market impact, Viirtu uses a 60 business day historical
volatility as main input to liquidity model. These historical examples are not indicative of future results or potential
costs.
Announcement
of Results
T-7 1st day 2nd day 3rd day Effective date
9 days to
T-8 T-6 T-5 T-4
stagger stagger stagger
effective date
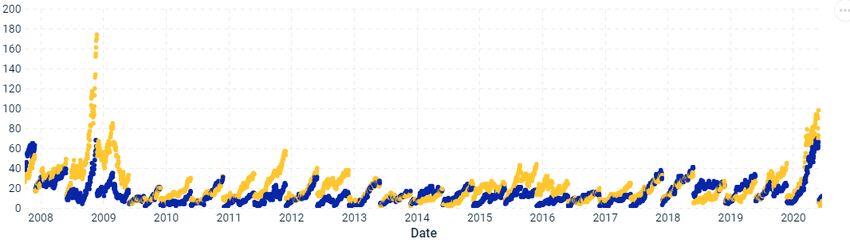
^Currently, MSCI calculates a variant of the MSCI USA Momentum Index that is staggered across three days 8Daily Traded Values for rebalancing are on the rise
An increasing trend in terms of Daily Traded Value for the rebalancing portfolio* around
the index review implementation date is observed
DM DTV for rebalancing portfolio EM DTV for rebalancing portfolio
0.7 1
Billions
Billions
0.9
0.6
0.8
0.5 0.7
0.6
0.4
0.5
0.3 0.4
0.2 0.3
0.2
0.1
0.1
0 0
Dec-07 Jun-10 Dec-12 Jun-15 Dec-17 Jun-20 Dec-07 Jun-10 Dec-12 Jun-15 Dec-17 Jun-20
World (t-1) World (t-2) World (t-3) EM (t-1) EM (t-2) EM (t-3)
*Rebalancing portfolio can be defined as the portfolio (related to a given index) which reflect additions, deletions, and other maintenance changes required to
fully replicate a given Index Review (effectively the full ‘pro-forma’ portfolio)
9Consideration of Alternative Measures
➢ MSCI also considered and examined these alternatives related to mitigation of the
impact of Index Reviews
Considered Alternatives Reasons for Not Adopting
▪ Wider buffers may deteriorate index
❑ Applying wider buffers
representativeness
❑ Applying SAIR rules in place of QIRs to ▪ More frequent SAIRs could increase annual
spread the index review changes turnover
▪ Rebalancing turnover has been generally stable and
within acceptable range
❑ Setting ‘hard’ IR turnover constraints
▪ No observed increase in bid/ask spreads or other
illiquidity measures outside volatile periods
▪ Disconnecting GIMI and non-market cap weighted
❑ Split GIMI and non-market cap
indexes may result in unnecessary methodology
weighted index implementation
complexities for investors
10Discussion Points
➢ Does the increased market impact of MSCI index review implementations now
warrant MSCI to address the rebalancing related issues as noted?
➢ Do you agree with the proposal to stagger the implementation of index reviews across
the MSCI GIMI and Non-Market Cap Weighted Indexes?
▪ Do you agree with the proposed 3 days to stagger such implementation?
▪ Should MSCI employ consistency of the staggered approach to all indexes as
proposed or only the MSCI GIMI?
▪ Should MSCI consider moving the announcement date of the index review
results to provide greater time to process the rebalancing?
➢ Should MSCI consider other alternatives which could potentially ease market impact
and facilitate implementation of index reviews? (i.e. a combination of staggering
approach with other alternatives)
11Index Review Implementation
under Market Stress
Proposal
© 2020 MSCI Inc. All rights reserved.
Please refer to the disclaimer at the end of this document.Proposal: Switch to a ‘Light’ Rebalancing during
Market Stress conditions
➢ Historically, there have been noticeable spikes in liquidity and transaction cost metrics
during times of market stress. While turnover and number of additions and deletions in
‘normal’ market conditions have generally been stable, increases are noticeably
observed in periods where volatility is higher
➢ In times of market stress, in addition to the staggered implementation, MSCI
proposes to switch to a ‘light’ rebalancing
▪ A ‘light’ rebalancing generally focuses on replacing a scheduled SAIR with a QIR
(if such QIR is defined by a methodology)
▪ Employment of these measures would not be preceded by any public
consultation
▪ If the upcoming scheduled rebalance is already a QIR, then no change to the
process would occur
➢ To determine market stress, MSCI would consider dimensions that are part of the
MSCI Market Monitoring Framework as well as additional measures of market
volatility
13‘Light’ Rebalancing for Various Methodologies
➢ Differentiation of ‘normal’ rebalancing schedules are present across index
methodologies
➢ As noted, under market stress conditions, a QIR rebalancing would generally be
applied if defined by a methodology
➢ For methodologies which rebalance annually or where QIRs are not defined, MSCI
would proceed as per the normal rebalancing schedule
Proposed Rebalancing schedules for various methodologies
Proposed
Rebalancing
‘Normal’ Rebalancing Schedule Index Methodology Example
schedule during
market stress
MSCI Global Investable Market Indexes;
Semi Annual + QIR QIR
MSCI ESG Universal Indexes
Annual only Annual MSCI GDP Weighted Indexes
Annual + QIR Annual MSCI Top 50 Dividend Indexes
Semi-Annual only Semi-Annual MSCI Minimum Volatility Indexes
QIR only QIR MSCI Equal Weighted Indexes
Monthly Monthly MSCI Hedged Indexes
14How should Market Stress be determined?
➢ The primary means to determine market stress will focus on the MSCI Market Monitoring
Framework which looks at:
▪ Market Functioning
▪ Market Liquidity
▪ Data Availability
➢ MSCI may also consider other measures which:
▪ Appropriately capture market risk
▪ Are sufficiently reactive to allow for prompt and timely decisions
▪ Provide enough stability to consistently capture only ‘extreme’ events
As example, the Global Total Market Trading (GEMTRD) risk model could be considered as a measure of
market stress/volatility. Note the peaks which show the 2008 GFC and COVID-19 crises
GEMTRD Forecasted Risk
80
70
60
50
40
30
20
10
0
15Applying QIR thresholds led to a reduced number of index changes
Historical Average of Index Review Changes (2007-
2020)
DM add/dels / DM turnover
160 3.50%
EM add/dels / EM turnover
140 3.00% ACWI add/dels / ACWI turnover
120
2.50%
100
2.00%
80 Historically, QIRs had
60
1.50% significantly lower number of
40
1.00% changes and turnover than
20 0.50% SAIRs
- 0.00%
Feb QIR May SAIR Aug QIR Nov SAIR
Simulated May 2020 SAIR for ACWI using QIR thresholds
Turnover 1.687% 1.344%
Based on simulation of the
May 2020 SAIR, applying QIR
thresholds led to lower
number of index review
changes and turnover
Based on simulation of May 2020 SAIR using QIR thresholds, if FIF/NOS changes are not
considered, turnover would be approximately 0.66%
16Impact Substantially Rose during Market Stress
Simulated Market Impact of May 2020 SAIR on different dates
600 20
18
500
Transaction Cost (bps)
Bid-Ask Spread (bps)
16
400
14
300 12
10
200
8
100
6
0 4
2020-01-03 2020-02-03 2020-03-03 2020-04-03 2020-05-03 2020-06-03
ACWI IMI (Transaction Cost) ACWI (Transaction Cost)
ACWI IMI (Bid-Ask Spread) ACWI (Bid-Ask Spread)
*Source: MSCI, Virtu
While we do not see a substantial dislocation in terms of turnover and numbers
of additions and deletions during ‘normal’ times, there are noticeable spikes in
liquidity and transaction cost* metrics observed during times of market stress
*Transaction costs are based on a model (Virtu) which measures trading costs using the difference between the average execution price and the prevailing price at
the start of the order execution. This measure includes both the bid-ask spread as well as the price impact cost of the order. For market impact, Virtu uses a 60
business day historical volatility as main input to liquidity model.
17Discussion Points
➢ Do you agree with the proposal to implement a ‘light’ rebalancing in times of
significant market stress?
▪ Is it appropriate to apply QIR thresholds in place of SAIR rules for the MSCI GIMI
in times of defined market stress?
▪ Do you agree with the proposal to apply ‘light’ rebalancing for the Non-Market
Cap Weighted Indexes, if QIR is defined by the relevant index methodologies?
▪ Is it appropriate to proceed with the normal rebalancing schedule for the Non-
Market Cap Weighted Indexes, if a QIR is not defined by the relevant index
methodology (i.e. Semi-Annual only)?
▪ What is the appropriate advance notice period to inform market participants of
moving to a ‘light’ rebalancing?
▪ Is the evaluation of market stress through the three dimensions of the MSCI
Market Monitoring Framework sufficient ? What other/different measures
should potentially be employed?
18Appendix
© 2020 MSCI Inc. All rights reserved.
Please refer to the disclaimer at the end of this document.AUM in Equity ETFs linked to MSCI
AUM in Equity ETFs
$1,000
$900
$800
$700
$600
Billions
$500
$400
$300
$200
$100
$0
Feb'09
Feb'10
Feb'11
Feb'12
Feb'13
Feb'14
Feb'15
Feb'16
Feb'17
Feb'18
Feb'19
Jun’19
Feb'20
Jun'09
Oct'09
Jun'10
Oct'10
Jun'11
Oct'11
Jun'12
Oct'12
Jun'13
Oct'13
Jun'14
Oct'14
Jun'15
Oct'15
Jun'16
Oct'16
Jun'17
Oct'17
Jun'18
Oct'18
Oct'19
Jun'20
• AUMs have increased over the past decade
SOURCE https://ir.msci.com/aum-etfs-linked-msci-indexes
1 For periods prior to April 2019, estimates were based on data from Bloomberg and MSCI.
2 For April 2019, a) the Month-End Balance is an estimate based on data from Refinitiv and MSCI, b) the Monthly Average Balance is an
estimate based on data from Bloomberg and MSCI for the period from April 1 through April 25 and on data from Refinitiv and MSCI for the
period from April 26 through April 30; provided that de minimis amounts of AUM for the Month-End Balance and Monthly Average Balance
were based on data as of April 25, 2019 from Bloomberg.
3 For May 2019 and later months, the Month-End Balance and the Monthly Average Balance are estimates based on data from Refinitiv and
MSCI, which may include de minimis amounts of delayed data.
The AUM in Equity ETFs also includes AUM in Exchange Traded Notes, the value of which is less than 1.0% of AUM amounts presented.
20Simulated May 2020 SAIR using different thresholds
Simulated May 2020 SAIR using different thresholds
2.0% 200
150
1.5% 100
50
138 104 53
1.0% 0
-180 -157 -35
-50
0.5% -100
-150
0.0% -200
Actual May 2020 SAIR May 2020 SAIR w/ May 2020 QIR
wider buffers
ACWI Adds ACWI Dels Turnover
Applying QIR thresholds leads to significantly lower number of index review changes and
turnover, including SAIR with widened buffers
21Simulated 2019 Index Reviews using SAIR thresholds
Turnover- MSCI World Index
1.1% 1.00%
• Rebalancing using SAIR 1.0%
Annual Actual
rules at each review would 0.9% Turnover:
0.8% 0.77% 0.74% 2.52%
even out the quarterly 0.86%
0.7% 0.62%
turnovers, but would result 0.6% Annual Sim.
in a slightly higher total 0.59%
0.5%
0.43% Turnover:
0.4%
annual turnover 0.3%
2.84%
0.36%
0.2%
0.1%
0.0%
Feb-19 May-19 Aug-19 Nov-19
Index Movements- MSCI World Index
50 50
40
40 40
37 35
• This would result in 28
30 3024 23 Actual Adds
preponing some SAIR
20 20
movements to the previous Actual Dels
10 10 4 4
QIR (i.e. more timely Sim. Adds
0 0
market representation)
-10 -10 -1 -3 Sim. Dels
-20 -20 Preponed
• The full-year 2019 -17
-30 -30
-15
-23 -23 -22 movements in
simulation did not result sim. vs actual
-40 -40 -35
in reverse turnovers Feb-19
Feb-19 May-19
May-19 Aug-19
Aug-19 Nov-19
Nov-19
Pulled-Up Adds Other Adds AddsPulled-Up
Dels Dels Other Dels
22GEMTRD Forecasted Risk
GEMTRD Forecasted Risk (2008)
70
60
50
40
30
20
10
0
GEMTRD Forecasted Risk (2020)
80
70
60
50
40
30
20
10
0
1/1/2020 2/1/2020 3/1/2020 4/1/2020 5/1/2020 6/1/2020 7/1/2020
23GEMTRD Forecasted Risk
• The GEMTRD Forecasted Risk exhibit high correlation with other indicators such
as VIX (0.88) and Credit Spread (0.72)
GEMTRD vs VIX and Credit Spread
70 9
8
60
7
50
6
40 5
30 4
3
20
2
10
1
0 0
VIX GEMTRD CREDIT_SPREAD
*Source: MSCI, Chicago Board Options Exchange (CBOE) Volatility Index, ICE BofAML Fixed Income indices
24Historical number of index review changes
Number of ACWI securities in Buffer Zones (SAIR buffers)
Small above upper buffer
Standard below lower buffer
Historical Breakdown of ACWI Add-Deletes
450 Additions (newly eligible)
400
Upward migrations • Higher number of migrations
350
Deletions are observed during volatile
300
250 Downward migrations markets
200
150
100
50
0
Qtr1
Qtr2
Qtr3
Qtr4
Qtr1
Qtr2
Qtr3
Qtr4
Qtr1
Qtr2
Qtr3
Qtr4
Qtr1
Qtr2
Qtr3
Qtr4
Qtr1
Qtr2
Qtr3
Qtr4
Qtr1
Qtr2
Qtr3
Qtr4
Qtr1
Qtr2
Qtr3
Qtr4
Qtr1
Qtr2
Qtr3
Qtr4
Qtr1
Qtr2
Qtr3
Qtr4
Qtr1
Qtr2
Qtr3
Qtr4
Qtr1
Qtr2
Qtr3
Qtr4
Qtr1
Qtr2
Qtr3
Qtr4
Qtr1
Qtr2
2008 2009 2010 2011 2012 2013 2014 2015 2016 2017 2018 2019 2020
25Historical Index Turnover
GIMI Turnover on SAIRs
5
4.5
4
3.5 EM May SAIR
avg: 3.23
3
2.5
2
1.5
World May
1 SAIR avg: 1.12
0.5
0
Qtr4 Qtr2 Qtr4 Qtr2 Qtr4 Qtr2 Qtr4 Qtr2 Qtr4 Qtr2 Qtr4 Qtr2 Qtr4 Qtr2 Qtr4 Qtr2 Qtr4 Qtr2 Qtr4 Qtr2 Qtr4 Qtr2 Qtr4 Qtr2 Qtr4 Qtr2
2007 2008 2009 2010 2011 2012 2013 2014 2015 2016 2017 2018 2019 2020
ACWI EM (EMERGING MARKETS) WORLD
• The turnover at the ACWI level generally remained stable since the inception of the
GIMI
– Some increase was observed as part of the May 2008 and May 2020 SAIRs, where
volatility is higher
*Turnover for Q4 2007 and Q2 2008 are based on the turnovers calculated for provisional indexes at the time of the methodology transition MSCI Standard
Indexes Methodology to MSCI GIMI Methodology
26About MSCI
MSCI is a leading provider of critical decision support tools and
services for the global investment community. With over 45 years of
expertise in research, data and technology, we power better investment
decisions by enabling clients to understand and analyze key drivers of
risk and return and confidently build more effective portfolios. We
create industry-leading research-enhanced solutions that clients use to
gain insight into and improve transparency across the investment
process. To learn more, please visit www.msci.com.
27Contact us
AMERICAS EUROPE, MIDDLE EAST ASIA PACIFIC
& AFRICA
Americas +1 888 588 4567 * Cape Town + 27 21 673 0100 China North 10800 852 1032 *
Atlanta + 1 404 551 3212 Frankfurt + 49 69 133 859 00 China South 10800 152 1032 *
Boston + 1 617 532 0920 Geneva + 41 22 817 9777 Hong Kong + 852 2844 9333
Chicago + 1 312 675 0545 London + 44 20 7618 2222 Mumbai + 91 22 6784 9160
Monterrey + 52 81 1253 4020 Milan + 39 02 5849 0415 Seoul 00798 8521 3392 *
New York + 1 212 804 3901 Paris 0800 91 59 17 * Singapore 800 852 3749 *
San Francisco + 1 415 836 8800 Sydney + 61 2 9033 9333
Sã o Paulo + 55 11 3706 1360 Taipei 008 0112 7513 *
Toronto + 1 416 628 1007 Thailand 0018 0015 6207 7181 *
Tokyo +81 3 5290 1555
* = toll free
msci.com
clientservice@msci.com
The process for submitting a formal index complaint can be found on the index regulation page of MSCI’s website at:
https://www.msci.com/index-regulation. 28Notice & disclaimer
This document and all of the information contained in it, including without limitation all text, data, graphs, charts (collectively, the “Information”) is the property of MSCI Inc. or its subsidiaries (collectively, “MSCI”), or MSCI’s licensors, direct
or indirect suppliers or any third party involved in making or compiling any Information (collectively, with MSCI, the “Information Providers”) and is provided for informational purposes only. The Information may not be modified, reverse-
engineered, reproduced or redisseminated in whole or in part without prior written permission from MSCI.
The Information may not be used to create derivative works or to verify or correct other data or information. For example (but without limitation), the Information may not be used to create indexes, databases, risk models, analytics,
software, or in connection with the issuing, offering, sponsoring, managing or marketing of any securities, portfolios, financial products or other investment vehicles utilizing or based on, linked to, tracking or otherwise derived from the
Information or any other MSCI data, information, products or services.
The user of the Information assumes the entire risk of any use it may make or permit to be made of the Information. NONE OF THE INFORMATION PROVIDERS MAKES ANY EXPRESS OR IMPLIED WARRANTIES OR REPRESENTATIONS
WITH RESPECT TO THE INFORMATION (OR THE RESULTS TO BE OBTAINED BY THE USE THEREOF), AND TO THE MAXIMUM EXTENT PERMITTED BY APPLICABLE LAW, EACH INFORMATION PROVIDER EXPRESSLY DISCLAIMS ALL
IMPLIED WARRANTIES (INCLUDING, WITHOUT LIMITATION, ANY IMPLIED WARRANTIES OF ORIGINALITY, ACCURACY, TIMELINESS, NON-INFRINGEMENT, COMPLETENESS, MERCHANTABILITY AND FITNESS FOR A PARTICULAR
PURPOSE) WITH RESPECT TO ANY OF THE INFORMATION.
Without limiting any of the foregoing and to the maximum extent permitted by applicable law, in no event shall any Information Provider have any liability regarding any of the Information for any direct, indirect, special, punitive,
consequential (including lost profits) or any other damages even if notified of the possibility of such damages. The foregoing shall not exclude or limit any liability that may not by applicable law be excluded or limited, including without
limitation (as applicable), any liability for death or personal injury to the extent that such injury results from the negligence or willful default of itself, its servants, agents or sub-contractors.
Information containing any historical information, data or analysis should not be taken as an indication or guarantee of any future performance, analysis, forecast or prediction. Past performance does not guarantee future results.
The Information should not be relied on and is not a substitute for the skill, judgment and experience of the user, its management, employees, advisors and/or clients when making investment and other business decisions. All Information
is impersonal and not tailored to the needs of any person, entity or group of persons.
None of the Information constitutes an offer to sell (or a solicitation of an offer to buy), any security, financial product or other investment vehicle or any trading strategy.
It is not possible to invest directly in an index. Exposure to an asset class or trading strategy or other category represented by an index is only available through third party investable instruments (if any) based on that index. MSCI does
not issue, sponsor, endorse, market, offer, review or otherwise express any opinion regarding any fund, ETF, derivative or other security, investment, financial product or trading strategy that is based on, linked to or seeks to provide an
investment return related to the performance of any MSCI index (collectively, “Index Linked Investments”). MSCI makes no assurance that any Index Linked Investments will accurately track index performance or provide positive investment
returns. MSCI Inc. is not an investment adviser or fiduciary and MSCI makes no representation regarding the advisability of investing in any Index Linked Investments.
Index returns do not represent the results of actual trading of investible assets/securities. MSCI maintains and calculates indexes, but does not manage actual assets. Index returns do not reflect payment of any sales charges or fees an
investor may pay to purchase the securities underlying the index or Index Linked Investments. The imposition of these fees and charges would cause the performance of an Index Linked Investment to be different than the MSCI index
performance.
The Information may contain back tested data. Back-tested performance is not actual performance, but is hypothetical. There are frequently material differences between back tested performance results and actual results subsequently
achieved by any investment strategy.
Constituents of MSCI equity indexes are listed companies, which are included in or excluded from the indexes according to the application of the relevant index methodologies. Accordingly, constituents in MSCI equity indexes may include
MSCI Inc., clients of MSCI or suppliers to MSCI. Inclusion of a security within an MSCI index is not a recommendation by MSCI to buy, sell, or hold such security, nor is it considered to be investment advice.
Data and information produced by various affiliates of MSCI Inc., including MSCI ESG Research LLC and Barra LLC, may be used in calculating certain MSCI indexes. More information can be found in the relevant index methodologies on
www.msci.com.
MSCI receives compensation in connection with licensing its indexes to third parties. MSCI Inc.’s revenue includes fees based on assets in Index Linked Investments. Information can be found in MSCI Inc.’s company filings on the Investor
Relations section of www.msci.com.
MSCI ESG Research LLC is a Registered Investment Adviser under the Investment Advisers Act of 1940 and a subsidiary of MSCI Inc. Except with respect to any applicable products or services from MSCI ESG Research, neither MSCI nor
any of its products or services recommends, endorses, approves or otherwise expresses any opinion regarding any issuer, securities, financial products or instruments or trading strategies and MSCI’s products or services are not intended
to constitute investment advice or a recommendation to make (or refrain from making) any kind of investment decision and may not be relied on as such. Issuers mentioned or included in any MSCI ESG Research materials may include
MSCI Inc., clients of MSCI or suppliers to MSCI, and may also purchase research or other products or services from MSCI ESG Research. MSCI ESG Research materials, including materials utilized in any MSCI ESG Indexes or other
products, have not been submitted to, nor received approval from, the United States Securities and Exchange Commission or any other regulatory body.
Any use of or access to products, services or information of MSCI requires a license from MSCI. MSCI, Barra, RiskMetrics, IPD and other MSCI brands and product names are the trademarks, service marks, or registered trademarks of MSCI
or its subsidiaries in the United States and other jurisdictions. The Global Industry Classification Standard (GICS) was developed by and is the exclusive property of MSCI and Standard & Poor’s. “Global Industry Classification Standard
(GICS)” is a service mark of MSCI and Standard & Poor’s.
MIFID2/MIFIR notice: MSCI ESG Research LLC does not distribute or act as an intermediary for financial instruments or structured deposits, nor does it deal on its own account, provide execution services for others or manage client
accounts. No MSCI ESG Research product or service supports, promotes or is intended to support or promote any such activity. MSCI ESG Research is an independent provider of ESG data, reports and ratings based on published
methodologies and available to clients on a subscription basis. We do not provide custom or one-off ratings or recommendations of securities or other financial instruments upon request.
Privacy notice: For information about how MSCI ESG Research LLC collects and uses personal data concerning officers and directors, please refer to our Privacy Notice at https://www.msci.com/privacy-pledge.
• This consultation may or may not lead to any changes in MSCI’s indexes. Consultation feedback will remain confidential unless a participant
requests that its feedback be disclosed. In that case, the relevant feedback would be published at the same time as the final results of the
consultation.
29You can also read