2021 Transit Development Plan Update - May 2021 Presented to Greenville Transit Authority Prepared by Connetics Transportation Group - Greenville, SC
←
→
Page content transcription
If your browser does not render page correctly, please read the page content below
2021 Transit Development Plan
Update
May 2021

Presented to Greenville Transit Authority
Prepared by Connetics Transportation Group
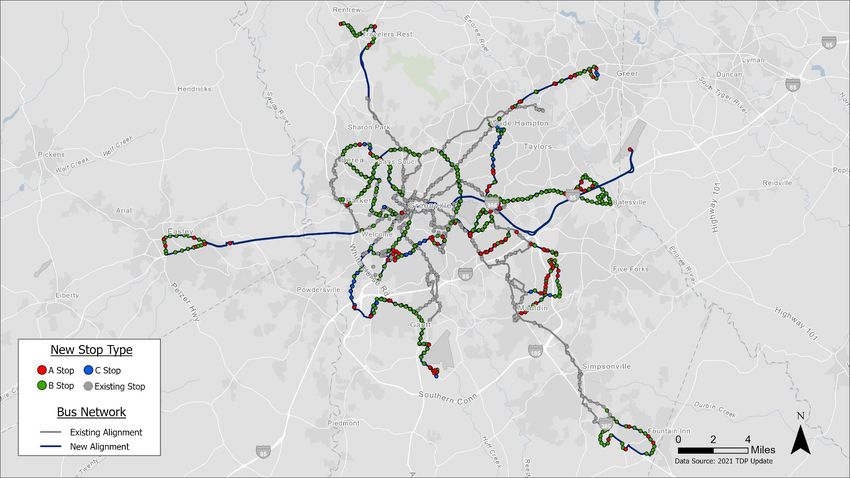
Table of Contents

Executive Summary ..................................................................................................................................................... 1
Fixed Route Service Expansion Update ...................................................................................................................... 6
Capital Cost Update ................................................................................................................................................... 16
Countywide Demand Response Plan ....................................................................................................................... 22

List of Figures

Figure 1. Projected Annual Greenlink Operating Budget by Time Period (FY20$, in M) ......................................... 3
Figure 2. Projected Annual Greenlink Capital Budget (FY20$, in M)........................................................................ 3
Figure 3. Proposed Radial Routes .............................................................................................................................. 8
Figure 4. Proposed Connector Routes........................................................................................................................ 9
Figure 5. Proposed Crosstown Routes ..................................................................................................................... 10
Figure 6. Proposed Circulator Routes....................................................................................................................... 11
Figure 7. Job Coverage for Expanded Fixed Route Network ................................................................................... 15
Figure 8. Stop Location Analysis ............................................................................................................................... 17
Figure 9. Peer Operators of Countywide Demand Response .................................................................................. 22
Figure 10. Zone Concept Overview ........................................................................................................................... 25
Figure 11. Zone Concept Anchor Points ................................................................................................................... 26

List of Tables

Table 1. Projected Operations Cost by Project........................................................................................................... 4
Table 2. Projected Capital Cost by Project ................................................................................................................. 5
Table 3. Fixed Route Expansion Changes .................................................................................................................. 6
Table 4. Fixed Route Expansion Service Summary ................................................................................................... 7
Table 5. Projected Operating Cost for Fixed Route Expansion................................................................................ 12
Table 6. GAP Productivities by Route Added ............................................................................................................ 13
Table 7. Bus Stop Infrastructure Needs by Route ................................................................................................... 19
Table 8. Vehicle Procurement Plan .......................................................................................................................... 21
Table 9. Peer Operator Population Density .............................................................................................................. 23
Table 10. Demand Response Peer Analysis ............................................................................................................ 23
Table 11. Zone Concept Ridership and Operating Statistics .................................................................................. 27
Table 12. Zone Concept Annual Cost Estimates ..................................................................................................... 27
Executive Summary
The dawn of the 2020s is an exciting time for the Greenville metropolitan area. The region continues to expand,
with robust population and employment growth. Between 2010 and 2019 the county population grew by 16%,
adding to 72,000 residents. Residential, commercial, and office development is abundant, and Greenville has
densified as more residents move to the county. This growth is putting pressure on the region to provide more
urban amenities and services, including Greenlink transit service.

A Necessary Update
As development changes where people live and work in Greenville County, and how they commute between the
two, it is necessary to review previous assumptions and ensure future plans match the evolving landscape. This
document is an update to the 2020-24 Transit Development Plan, which was adopted by the Greenville Transit
Authority Board of Directors in April 2018. Since the previous plan was completed only three years ago, it is
generally agreed that the previous analysis, findings, and decisions are still appropriate. Thus, this document
focuses on the changes to travel markets and developments that have occurred in the intervening three years,
and updates transit service recommendations to best serve Greenville residents.

The TDP Update focuses on three specific analyses:

    •   A review and update to the fixed route service expansion plan;
    •   An analysis of future capital costs, including new maintenance facility, additional bus stop locations,
        and accompanying vehicle plan for the proposed service expansion plan; and
    •   A plan for countywide demand response service to provide transit service to residents of the outer parts
        of Greenville County who do not have access to fixed route bus service.

The Next Ten Years
A significant expansion of Greenlink services is planned over the next ten years to meet the transportation needs
of Greenville County residents.

Projected Operating Budget Needs
The Greenlink annual operating budget for 2021 is projected at $7.03 million (FY20$), including both fixed route
and GAP paratransit service, but not including the downtown trolley. If all proposed operating plans are realized,
Greenlink would need an additional $16.07 million in annual funds (FY20$) to operate the expanded system.

The full expansion plan includes:

    •   $8.54 million in cost to increase service to the core Greenlink network, including:
            o Increases in Weekday 30-minute peak frequency on core routes
            o Increases in Saturday 30-minute frequency on core routes
            o New Sunday service
    •   $6.79 million in cost for route expansion, including:
            o 15 new routes
            o Adjustments to two existing Greenlink routes (504 and 506)
    •   $0.74 million in additional GAP service, including:

Greenlink 2021 Transit Development Plan Update                                                           Page 1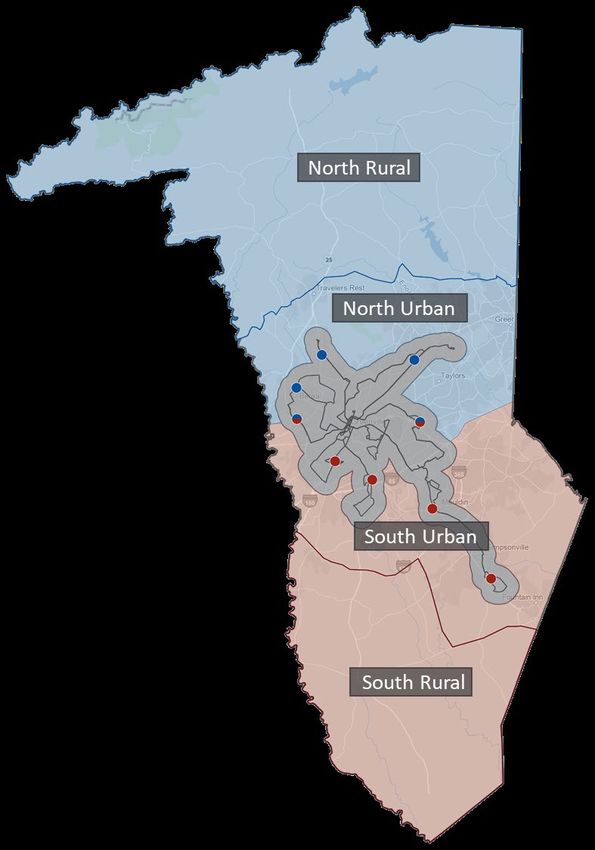
o   Additional Saturday and Sunday service to match service expansion in the core network
             o   Additional geographic coverage to match fixed route expansion

Figure 1 provides the growth in annual operating cost by time period, while Table 1 provides a more detailed
look at operating cost of individual projects.

Projected Capital Budget Needs
A robust capital plan accompanies Greenlink’s proposed service expansion, including new stop infrastructure,
new bus vehicles, and a new maintenance facility. If all proposed capital plans are realized, Greenlink would
need between $55.68 million and $95.33 million (FY20$) in capital dollars to realize the expanded system.
However, the implementation timeline for these projects stretches past 2029, so the year over year impact of
this proposed capital budget is uncertain.

The capital expansion plan includes:

    •   $28.62 million (FY20$) to construct a new maintenance facility
    •   $7.13 million (FY20$) in bus stop improvements for expansion routes
    •   A range of $19.95 million to $59.60 million (FY20$) in bus vehicle capital costs, depending on the type
        of propulsion selected

Figure 2 provides the capital cost by time period, while Table 2 provides a more detailed look at capital cost of
individual projects.

Countywide Demand Response Concept
This TDP Update also explores the feasibility of operating demand response in the outer parts of Greenville
County beyond where fixed route and GAP service would operate. The analysis shows a need between $5.36
million and $7.44 million (FY20$), annually, to operate countywide demand response outside of the expanded
fixed route network. The range of cost depends on whether the concept is directly operated or purchased
transportation.

A capital cost of $1.76 million (FY20$) would also be needed to purchase 22 Ford Transit vehicles for the
countywide demand response concept.

Greenlink 2021 Transit Development Plan Update                                                          Page 2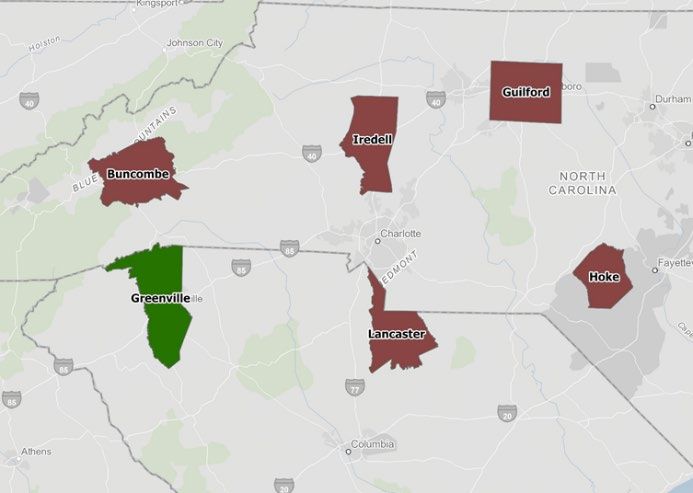
Figure 1. Projected Annual Greenlink Operating Budget by Time Period (FY20$, in M)

                                              Projected Annual Operating Budget (FY20$, in M)
                                   $25.0
  Annual Operating Budget (in M)

                                   $20.0

                                   $15.0

                                   $10.0

                                    $5.0

                                      $-
                                                Existing              2021-24                    2025-29                   After 2029

                                                                        Fixed Route     GAP

Figure 2. Projected Annual Greenlink Capital Budget (FY20$, in M)

                                                           Capital Cost Estimate (FY20$, in M)
                                   $50.0

                                   $45.0

                                   $40.0

                                   $35.0
  Total Capital Cost

                                   $30.0

                                   $25.0

                                   $20.0

                                   $15.0

                                   $10.0

                                    $5.0

                                      $-
                                                    2021-24                        2025-29                             After 2029

                                           Infrastructure Costs   Vehicle Costs (CNG)        Additional Cost for Electric Buses

Note: capital costs in Figure 2 do not include countywide demand response

Greenlink 2021 Transit Development Plan Update                                                                                          Page 3
Table 1. Projected Operations Cost by Project

                                                                                                                           Improvement Annual           Cumulative Annual
   Funding     Improvement                   Implementation
                               Route Type                       Improvement                                                     Operating Cost             Operating Cost
   Priority        Type                           Year
                                                                                                                                  [FY20 dollars]            [FY20 dollars]
                Fixed Route                       Existing      Greenlink Existing Fixed Route Network                 $             6,296,202     $            6,296,202
                    GAP                           Existing      Existing GAP Service (Inflated FY19 + Extended Span)   $               730,579     $            7,026,781
    High        Fixed Route    Systemwide         2021-24       Extend Saturday Span (5:30a-11:30p)                    $               290,454     $            7,317,235
    High            GAP        Systemwide         2021-24       Extend GAP service to match Saturday span              $                19,000     $            7,336,235
    High        Fixed Route    Systemwide         2021-24       Improve all Weekday routes to 30 min frequency         $             3,562,951     $          10,899,186
    High        Fixed Route    Systemwide         2021-24       Improve all Saturday routes to 30 min frequency        $             1,764,081     $          12,663,267
    High        Fixed Route    Systemwide         2021-24       Add Sunday service (60 min frequency; 12 hours)        $               435,681     $          13,098,948
    High            GAP        Systemwide         2021-24       Extend GAP service to match Sunday Span                $                28,000     $          13,126,948
    High        Fixed Route       Radial          2021-24       Discontinue 504 - Anderson                             $              (917,352)    $          12,209,596
    High        Fixed Route       Radial          2021-24       Discontinue 506 - Woodside                             $              (961,324)    $          11,248,272
    High        Fixed Route       Radial          2021-24       504 via Anderson/Gantt                                 $             1,641,345     $          12,889,617
    High        Fixed Route       Radial          2021-24       504 via Mills                                          $               942,732     $          13,832,348
    High        Fixed Route       Radial          2021-24       506 via Old Buncombe                                   $               895,514     $          14,727,862
    High        Fixed Route       Radial          2021-24       506 via Cedar Lane                                     $               883,709     $          15,611,571
   Medium       Fixed Route     Circulator        2025-29       Prisma Circulator                                      $               275,292     $          15,886,863
   Medium       Fixed Route       Radial          2025-29       Laurens/Woodruff                                       $             1,605,105     $          17,491,968
   Medium       Fixed Route     Crosstown         2025-29       Blue Ridge/Pleasantburg/Halton                         $             1,022,068     $          18,514,036
   Medium       Fixed Route     Connector         2025-29       Greer Connector                                        $               290,757     $          18,804,793
   Medium       Fixed Route     Connector         2025-29       Pelham Connector                                       $               307,133     $          19,111,926
   Medium       Fixed Route     Connector         2025-29       Travelers Rest                                         $               305,313     $          19,417,239
   Medium       Fixed Route       Radial          2025-29       US 123 All Day                                         $               607,897     $          20,025,136
   Medium           GAP        Systemwide         2025-29       GAP service for short term route expansion             $               395,000     $          20,420,136
    Low         Fixed Route     Crosstown        After 2029     Faris/Haywood                                          $               646,345     $          21,066,480
    Low         Fixed Route     Circulator       After 2029     East Pelham Circulator                                 $               320,779     $          21,387,259
    Low         Fixed Route     Circulator       After 2029     Fountain Inn                                           $               291,667     $          21,678,926
    Low         Fixed Route     Connector        After 2029     GSP Connector                                          $               439,044     $          22,117,971
    Low         Fixed Route     Crosstown        After 2029     Howell                                                 $               343,916     $          22,461,887
    Low         Fixed Route     Circulator       After 2029     Mauldin Circulator                                     $               338,973     $          22,800,860
    Low             GAP        Systemwide        After 2029     GAP service for long term route expansion              $               299,000     $          23,099,860

Greenlink 2021 Transit Development Plan Update                                                                                                         Page 4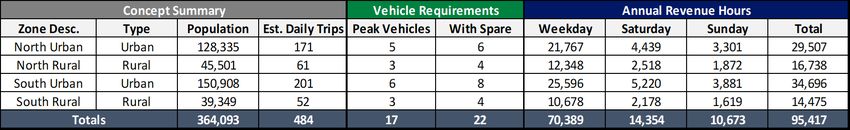
Table 2. Projected Capital Cost by Project
                                                                                                                                              Vehicle Capital Cost [FY20$]     Infrastructure          Annual Capital Costs [FY20$]
                    Improvement                    Implementation
Funding Priority                     Route Type                                                     Improvement                                  low               high            Cost [FY20$]         low                  high
                          Type                          Year
                      Fixed Route                                   Greenlink Existing Fixed Route Network                                                                                         $              -   $                 -
                          GAP                                       Existing GAP Service (Inflated FY19 + Extended Span)                                                                           $              -   $                 -
                   Fixed Route/GAP                                  Existing Trolleys & Spares                                                                                                     $              -   $                 -
     High             Fixed Route    Systemwide       2021-24       Extend Saturday Span (5:30a-11:30p)                                                                                            $              -   $                 -
     High                 GAP        Systemwide       2021-24       Extend GAP service to match Saturday span                                                                                      $              -   $                 -
     High                Capital                      2021-24       New Maintenance Facility                                                                                   $      28,620,000   $     28,620,000   $        28,620,000
     High                Capital                      2021-24       Purchase new vehicles for 30 minute service & service modifications   $      3,300,000   $     5,700,000                       $      3,300,000   $         5,700,000
     High             Fixed Route    Systemwide       2021-24       Improve all Weekday routes to 30 min frequency                        $             -    $            -                        $              -   $                 -
     High             Fixed Route    Systemwide       2021-24       Improve all Saturday routes to 30 min frequency                       $             -    $            -                        $              -   $                 -
     High             Fixed Route    Systemwide       2021-24       Add Sunday service (60 min frequency; 12 hours)                       $             -    $            -                        $              -   $                 -
     High                 GAP        Systemwide       2021-24       Extend GAP service to match Sunday Span                               $             -    $            -                        $              -   $                 -
     High             Fixed Route       Radial        2021-24       504 Split - Anderson/Donaldson                                        $      1,100,000   $     3,800,000   $         746,300   $      1,846,300   $         4,546,300
     High             Fixed Route       Radial        2021-24       504 Split - Mills via Marue                                           $        550,000   $     1,900,000   $         129,700   $        679,700   $         2,029,700
     High             Fixed Route       Radial        2021-24       506 Split - Cedar Lane                                                $        550,000   $     1,900,000   $         244,100   $        794,100   $         2,144,100
     High             Fixed Route       Radial        2021-24       506 Split - Old Buncombe                                              $        550,000   $     1,900,000   $         346,800   $        896,800   $         2,246,800
    Medium            Fixed Route     Circulator      2025-29       Prisma Circulator                                                     $        100,000   $       100,000   $         168,200   $        268,200   $           268,200
    Medium            Fixed Route       Radial        2025-29       Laurens/Woodruff                                                      $      2,200,000   $     7,600,000   $         542,700   $      2,742,700   $         8,142,700
    Medium            Fixed Route     Crosstown       2025-29       Blue Ridge/Pleasantburg/Halton                                        $      1,650,000   $     5,700,000   $         819,900   $      2,469,900   $         6,519,900
    Medium            Fixed Route     Connector       2025-29       Greer Connector                                                       $        550,000   $     1,900,000   $         496,700   $      1,046,700   $         2,396,700
    Medium            Fixed Route     Connector       2025-29       Pelham Connector                                                      $        550,000   $     1,900,000   $         582,000   $      1,132,000   $         2,482,000
    Medium            Fixed Route     Connector       2025-29       Travelers Rest                                                        $        550,000   $     1,900,000   $         288,600   $        838,600   $         2,188,600
    Medium            Fixed Route       Radial        2025-29       US 123 All Day                                                        $      1,100,000   $     3,800,000   $         368,200   $      1,468,200   $         4,168,200
    Medium               Capital                      2025-29       Spares for short term route expansion                                 $      1,750,000   $     4,850,000                       $      1,750,000   $         4,850,000
    Medium                GAP        Systemwide       2025-29       GAP service for short term route expansion                            $        300,000   $       300,000                       $        300,000   $           300,000
     Low              Fixed Route     Crosstown      After 2029     Faris/Haywood                                                         $      1,100,000   $     3,800,000   $         661,400   $      1,761,400   $         4,461,400
     Low              Fixed Route     Circulator     After 2029     East Pelham Circulator                                                $        550,000   $     1,900,000   $         326,800   $        876,800   $         2,226,800
     Low              Fixed Route     Circulator     After 2029     Fountain Inn                                                          $        550,000   $     1,900,000   $         296,300   $        846,300   $         2,196,300
     Low              Fixed Route     Connector      After 2029     GSP Connector                                                         $        550,000   $     1,900,000   $          26,000   $        576,000   $         1,926,000
     Low              Fixed Route     Crosstown      After 2029     Howell                                                                $        550,000   $     1,900,000   $         549,600   $      1,099,600   $         2,449,600
     Low              Fixed Route     Circulator     After 2029     Mauldin Circulator                                                    $        550,000   $     1,900,000   $         519,500   $      1,069,500   $         2,419,500
     Low                 Capital                     After 2029     Spares for long term route expansion                                  $      1,100,000   $     2,850,000                       $      1,100,000   $         2,850,000
     Low                  GAP        Systemwide      After 2029     GAP service for long term route expansion                             $        200,000   $       200,000                       $        200,000   $           200,000

Greenlink 2021 Transit Development Plan Update                                                                                                                                                                 Page 5
Fixed Route Service Expansion Update
The Transit Development Plan adopted in 2018 included 19 new routes for service expansion. Many of these
routes were in the outer parts of Greenville County, although a few were slated for the Greenville urban core.
For the TDP Update all 19 routes were revisited-- some routes were eliminated, and others were realigned to
account for development patterns, discussions with elected officials, and conversations with community
stakeholders. The fixed route expansion is still recommended to begin in 2025, after additions to core service
are complete.
Table 3 shows the comparison between the 2018 plan and the TDP Update. Four routes were eliminated from
the 2018 plan while 15 patterns were kept and updated as noted in the table.
Table 3. Fixed Route Expansion Changes
2021 TDP Update
2018 TDP
Kept/Eliminated Notes
Cedar Lane Kept Split 506
Old Buncombe Kept Split 506
US 123 Commuter Kept Now proposed all day route
Cleveland/Haywood Eliminated
combined with extended
Gantt Kept route 504 via Anderson
Blue Ridge/Pleasantburg/Halton Kept
White Horse Eliminated
Laurens/Woodruff Kept
Church/Mills Kept now 504 via Mills
Mauldin Kept
US 276 commuter Eliminated
Greer Kept
I-85 commuter Kept now GSP Connector
Howell Kept
Faris/Haywood Kept
I-385 commuter Eliminated
Pelham Kept
Fountain Inn Kept
Travelers Rest Kept
Greenlink 2021 Transit Development Plan Update Page 6Routes for Expansion
The proposed expansion package includes 17 routes, consisting of the 15 patterns mentioned above and two
additional routes: the Prisma Circulator and the East Pelham Circulator. This section describes the 17 route
patterns recommended for fixed route expansion. Table 4 includes a summary of headway, span by day of
operation, annual revenue hours, and annual operating cost.
Table 4. Fixed Route Expansion Service Summary
Implementation Weekday Saturday Sunday
Route Priority headway span headway span headway span
504 via Anderson/Gantt 2021-24 30 min 18 hrs 30 min 18 hrs 60 min 12 hrs
504 via Mills 2021-24 30 min 18 hrs 30 min 18 hrs 60 min 12 hrs
506 via Old Buncombe 2021-24 30 min 18 hrs 30 min 18 hrs 60 min 12 hrs
506 via Cedar Lane 2021-24 30 min 18 hrs 30 min 18 hrs 60 min 12 hrs
Laurens/Woodruff 2025-29 30 min 18 hrs 30 min 18 hrs 60 min 12 hrs
US 123 all day 2025-29 60 min 14 hrs 60 min 10 hrs - -
Blue 2025-29
Ridge/Pleasantburg/Halton 45 min 14 hrs 45 min 10 hrs - -
Pelham Connector 2025-29 60 min 14 hrs - - - -
Greer Connector 2025-29 60 min 14 hrs - - - -
Travelers Rest Connector 2025-29 60 min 14 hrs - - - -
Prisma Circulator 2025-29 30 min 14 hrs - - - -
Faris/Haywood After 2029 45 min 14 hrs 45 min 10 hrs - -
Howell After 2029 60 min 14 hrs 60 min 10 hrs - -
GSP Connector After 2029 60 min 14 hrs - - - -
E. Pelham Circulator After 2029 30 min 14 hrs - - - -
Mauldin Circulator After 2029 30 min 14 hrs - - - -
Fountain Inn Circulator After 2029 60 min 14 hrs - - - -
Figures 3 through 6 summarize proposed routes by service type: radial, connector, crosstown, or circulator.
These route types are the same as used in the Transit Development Plan completed in 2018.
Greenlink 2021 Transit Development Plan Update Page 7Figure 3. Proposed Radial Routes
504 via Anderson/Gantt
From Greenlink Transit Center
To Donaldson Center Airport
Fluor Field, the Dunean Plant, Carolina Academy, Eagle Trace Apartments, Resthaven
Major Destinations
Memorial Gardens, Michelin PRIME
Anderson Rd, Staunton Bridge Rd, Stables Rd, Piedmont Hwy, Lenhardt Grove Rd, White
Operating Streets
Horse Rd, Augusta Rd, Perimeter Rd
Replace the one-way service along Anderson Rd on the existing 504 Anderson with bi-
Function
directional service and provide service to Donaldson Center
504 via Mills
From Greenlink Transit Center
To White Horse Flea Market
Prisma Health Greenville Memorial Hospital, K-Mart Plaza Food Lion, the VA Outpatient
Major Destinations
Clinic, Anderson Road Plaza
Operating Streets Church St, Mills Ave, Marue Dr, Faris Rd, Grove Rd, White Horse Rd, Anderson Rd
Cover the sections of the existing 504 Anderson along Mills Ave that are not covered by the
Function
proposed 504 via Anderson/Gantt
506 via Cedar Lane
From Greenlink Transit Center
To Berea Plaza
Major Destinations Kroc Center, the Woodside Mill, the Lofts of Greenville, Hunter’s Park Apts
Operating Streets Academy St, Birnie St, Woodside Ave, Cedar Lane Rd
Function Replace the southern half of the one-way loop on the existing 506 Woodside
506 via Old Bumcombe
From Greenlink Transit Center
To Berea Plaza
Major Destinations Heritage Place, Lakeview Middle School, Swamp Rabbit Trail, Oakmont East Nursing Center
Operating Streets Buncombe St, Pete Hollis Blvd, Old Buncombe Rd, Sulphur Springs Rd
Function Replace the northern half of the one-way loop on the existing 506 Woodside
US 123 All Day
From Greenlink Transit Center
To Easley, SC
Kroc Center, Walmart at Easley Town Center, R.H. Getty’s Middle School, downtown Easley,
Major Destinations
Easley YMCA
Operating Streets Academy St, Easley Bridge Rd, US-123/Calhoun Memorial Hwy, and E Main St
Function Connect Greenville and Easley
Laurens / Woodruff
From Greenlink Transit Center
To Verdin Rd
Verdae Village, Magnolia Park Town Center, the Shops at Greenridge, and the Shoppes at
Major Destinations
Woodruff
Operating Streets Laurens Rd, Verdae Blvd, and Woodruff Rd
Extend Service along Woodruff Rd and overlap with the existing route 510, providing the
Function
opportunity for a combined 15-minute headway along Laurens
Greenlink 2021 Transit Development Plan Update Page 8Figure 4. Proposed Connector Routes
Travelers Rest
From Furman University
To North Greenville Hospital (Travelers Rest, SC)
Major Destinations Travelers Rest Walmart, Food Lion, Travelers Rest High School
Operating Streets Poinsett Hwy, US-25, & N. Main St
Function Connect Greenville and Travelers Rest via timed transfer with the existing 503-Poinsett
Greer Connector
From Taylors Square Walmart
To South Beverly Ln (Greer, SC)
Target at North Hampton Market, Food Lion, Greer Walmart Neighborhood Market, Greer
Major Destinations
Library
Operating Streets Wade Hampton Blvd
Connect Greenville and Greer, SC via timed transfer with the existing 505-Rutherford and
Function
508 - Wade Hampton
Pelham Connector
From Haywood Mall
To Destinations along Dry Pocket Rd
Patewood Medical Campus, Milestone Way businesses, Beacon Hill, the Village at
Major Destinations
Thornblade
Operating Streets Pelham Rd, The Parkway, Batesville Rd
Extend service to commerial and industrial development along Pelham Rd via timed
Function
connection with existing 509-E. North and 602-Woodruff Connector
GSP Connector
From Greenlink Transit Center
To Greenville-Spartansburg International Airport
Major Destinations Downtown Greenville, GSP
Operating Streets I-85, I-385
Function Express service connecting downtown to the airport
Greenlink 2021 Transit Development Plan Update Page 9Figure 5. Proposed Crosstown Routes
Blue Ridge/Pleasantburg/Halton
From White Horse Commons Walmart
To Patewood Medical Campus
Haywood Mall, Forest View Plaza, the Greenville Convention Center, Bob Jones University,
Major Destinations
Cherrydale Point Shopping Center
Operating Streets Blue Ridge Dr, Pleasantburg Dr, Halton Rd and Patewood Dr
Function Provide crosstown service, connecting several existing, radial routes outside of downtown
Howell Crosstown
From Haywood Mall
To Taylors Square Walmart
Major Destinations Patewood Medical Campus, BI-LO, The Palisades
Operating Streets Patewood Dr, Pelham Rd, Howell Rd
Function Provide direct service between the Taylors Square Walmart and the Haywood Mall
Faris/Haywood Crosstown
From Patewood Medical Campus
To Prisma Health Greenville Memorial Hospital
Major Destinations Haywood Mall, Goodwill, Forest View Plaza, Greenville Technical College
Operating Streets Faris Rd, Pleasantburg Dr, Laurens Rd, Haywood Rd, Patewood Dr
Function Provide direct service between the Patewood Medical Campus and Prisma Health
Greenlink 2021 Transit Development Plan Update Page 10Figure 6. Proposed Circulator Routes
Mauldin Circulator
From Downtown Mauldin
To Surrounding Areas
Brookfield Corporate Center, the Mauldin Cultural Center, Mauldin High School, Mauldin
Major Destinations
Middle School, Mauldin Elementary and Crescentwood Village
Operating Streets E Butler Rd, Murray Dr, Miller Rd, Corn Rd, Bridges Rd, and Holland Rd
Function Provide curculation in and around Mauldin, SC
Prisma Circulator
From Prisma Health Greenville Memorial Hospital
To Surrounding Areas
VA Outpatient Clinic, Prisma Health OB/GYN Center, medical offices at the intersection of W
Major Destinations
Faris and Memorial Medical Dr, and Marue Drive between Henrydale and W. Faris
Operating Streets Grove Rd, W Faris Rd, Marue Dr
Function Connect Primsa Health to the surrounding medical offices
East Pelham Circulator
From The Parkway and Batesville Rd
To Pelham Rd east of I-85
The Villages at Thornblade, the Marriott Hotel, Mainstay Suites, Wyndham Hotel, and
Major Destinations
Pelham Davis Circle
Operating Streets Dry Pocket Rd, Batesville Rd, Pelham Rd, Interstate Blvd, and The Parkway
Function Connect commercial and industrial developments along Pelham Rd east and west of I-85
Fountain Inn Circulator
From Downtown Fountain Inn
To Surrounding Areas
Prisma Health Hillcrest Hospital, Walmart, and employers along Southchase Blvd including
Major Destinations
AVX and Grainger Distribution
Operating Streets Main St, Grandview Dr, Southchase Blvd, Nelson Dr, N Woods Dr
Function Provide curculation in and around Fountain Inn, SC
Greenlink 2021 Transit Development Plan Update Page 11Projected Operating Cost
Operating cost was estimated for the fixed route expansion plan. The first step was to develop operations and
maintenance (O&M) unit costs for Greenlink service. The 2019 National Transit Database cost data was used
and then inflated to 2020 dollars using a 1.3 percent inflation rate. The unit costs (in FY20$) account for distinct
parts of the Greenlink agency:
• $33.78 per revenue hour for vehicle operations costs
• $2.50 per revenue mile for vehicle maintenance costs
• $66,806 per peak bus for the variable administration costs, defined as the cost of running the Greenlink
administration that can vary depending on the amount of service being operated
A fourth unit cost, for fixed administration costs, was not included since these costs would not change regardless
of the amount of service operated.
The second step was to estimate revenue hours, revenue miles, and peak buses for each expansion route. The
frequency and span mentioned previously was used for this estimate, as well as a high-level travel time estimate.
The results are shown in Table 5 by route. Note that changes to routes 504 and 506 both include savings by
discontinuing the existing route along with the cost of replacing with two new routes.
Table 5. Projected Operating Cost for Fixed Route Expansion
Annual
Peak Buses
Revenue Revenue Operating
in
Hours Miles Cost
Operation
Route (FY20$)
Discontinue 504 - Anderson (11,808) (153,976) (2) ($917,352)
504 via Anderson/Gantt 18,018 332,986 3 $1,641,345
504 via Mills 11,808 164,131 2 $942,732
Discontinue 506 - Woodside (11,808) (171,570) (2) ($961,324)
506 via Old Buncombe 11,808 145,238 2 $895,514
506 via Cedar Lane 11,808 140,515 2 $883,709
Laurens/Woodruff 23,616 216,086 4 $1,605,105
US 123 all day 7,280 91,364 2 $607,897
Blue Ridge/Pleasantburg/Halton 12,450 160,467 3 $1,022,068
Faris/Haywood 8,300 92,960 2 $646,345
Howell 4,150 54,780 1 $343,916
Pelham Connector 3,640 46,956 1 $307,133
GSP Connector 3,640 99,736 1 $439,044
Greer Connector 3,640 40,404 1 $290,757
Travelers Rest Connector 3,640 46,228 1 $305,313
E. Pelham Circulator 3,640 52,416 1 $320,779
Prisma Circulator 3,640 34,216 1 $275,292
Mauldin Circulator 3,640 59,696 1 $338,973
Fountain Inn Circulator 3,640 40,768 1 $291,667
Greenlink 2021 Transit Development Plan Update Page 12Additional GAP Service
Service expansion will also require an expansion of Greenville Area Paratransit (GAP) service to new geographic
areas. The cost of expansion was derived by using information on GAP service reported by Greenlink in the 2019
National Transit Database (the latest available). This information was used to calculate GAP productivity, that is,
the number of revenue hours of GAP service for every hour of fixed route service operated. This productivity was
then adjusted to account for geography and day of week, as shown in Table 6. A core route is one that operates
within Greenville city, where densities are higher and trips are shorter, thus requiring slightly less GAP service.
An outer route would operate in suburban and rural areas, where trips are longer and more GAP service would
be required.
Table 6. GAP Productivities by Route Added
Additional Revenue Hours of GAP Service
Day of Week
Core Route Outer Route
Weekday 2.0 2.5
Saturday 0.5 1.0
The cost of GAP service is estimated at $77.98 per revenue hour (FY20$). For the 2025-29 period, seven routes
are recommended for implementation (three core and four outer routes). Thus, GAP would require 5,055 revenue
hours and an annual cost of $395,000 (FY20$) to satisfy demand in these new areas.
For the period after 2029, six routes are recommended for implementation (two core and four outer routes). GAP
would require 3,830 revenue hours at an annual cost of $299,000 (FY20$) to satisfy demand in these new
areas.
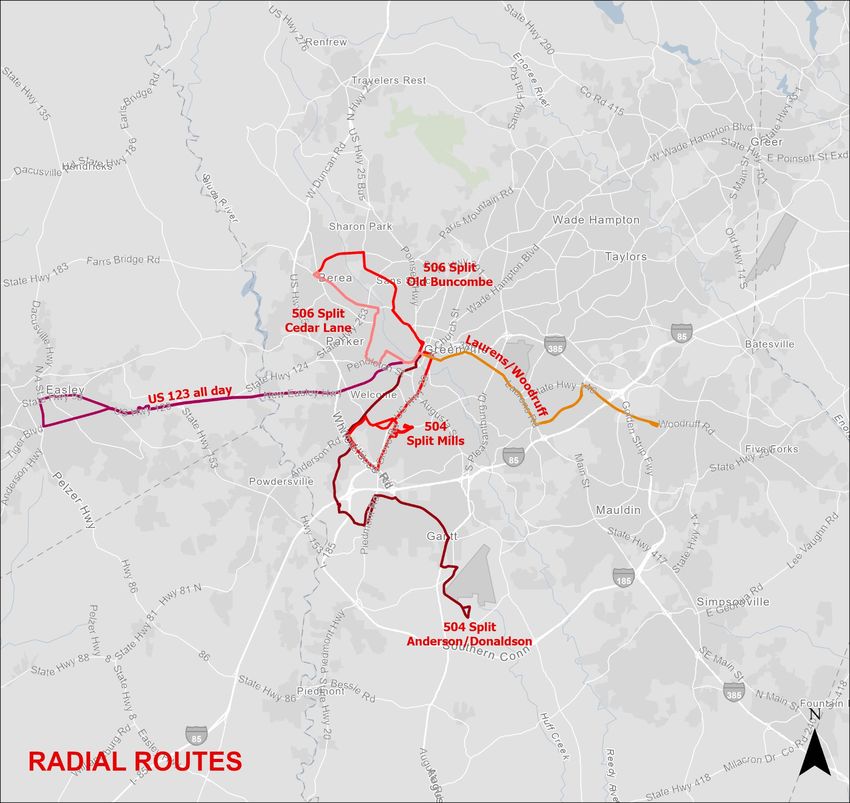
Greenlink 2021 Transit Development Plan Update Page 13Employment Analysis
Access to jobs is a key goal of the expanded fixed route network. However, detailed jobs data can be difficult
to obtain. To that end, Greenlink engaged United Ministries (UM), a local nonprofit with the purpose of offering
“programs that serve and empower those in our community who are striving to achieve self-sufficiency” also
identifies access to jobs as a primary goal. In early 2021, UM staff collected jobs data to better connect
disadvantaged individuals with access to job opportunities. This data was pulled from ReferenceUSA, which, at
the time of writing, has the most comprehensive jobs listing available for public consumption. United Ministries
staff grouped jobs into seven simple categories based on SIC/NAICS codes and the skills required for several
different types of jobs, approaching the database as a potential source of information based off of the skillset
of the individual (including previous jobs held), but also what transferable skills would allow that individual to
transition to in the future.
Those categories are:
1. Operating equipment, working safely and efficiently
2. Building things, working outside, or using hand tools
3. Communicating, salesmanship, or leadership
4. Cooking, cleaning, or other hospitality skills
5. Using computers or working with office teams
6. Taking care of others or protecting others
7. Jobs requiring a college degree
The TDP Update conducted an employment analysis based off this dataset to understand how the expanded
network will help achieve Greenlink’s goal to increase access to jobs via public transit. A buffer analysis was
conducted for all stop locations of the existing and expanded network to understand how many jobs are
near the proposed fixed route expansion plan. The map analysis is shown in Figure 7.
For the existing network, approximately 45% of jobs in Greenville County are within 0.25 miles of the Greenlink
network. When expanding that buffer to 0.5 miles the existing network covers approximately 53% of jobs. By
contrast, the expanded network covers 66% of jobs within 0.25 miles, and 73% of jobs
within 0.5 miles. Thus, 20% more of employment opportunities in Greenville County is accessible to Greenlink
riders with the expanded network.
Greenlink 2021 Transit Development Plan Update Page 14Figure 7. Job Coverage for Expanded Fixed Route Network Greenlink 2021 Transit Development Plan Update Page 15
Capital Cost Update
The capital cost update consists of three components: the bus maintenance facility, bus stop infrastructure for
fixed route service expansion, and the vehicle plan for service expansion.

Bus Maintenance Facility
Greenlink is in the process of designing a new maintenance facility to replace the existing one located at 154
Augusta Street in Greenville. The new facility would be located on a vacant site at the intersection of Arcadia
Street and O Jones Street in north Greenville.

The cost of the facility is estimated to be $28.62 million dollars (FY20$). This is 6% higher than the 2017
estimate of the facility due to inflation. Additional propulsion infrastructure – a CNG pump and electric chargers
– are not included in the capital cost above.

Bus Stop Infrastructure
The fixed route expansion plan will require Greenlink to also expand bus stops into outer areas of Greenville
County. This section presents the methodology and capital cost for this expansion.

Methodology
Capital costs were calculated by first identifying stop locations. Remix route planning software aided this
process. Remix identified stop locations for all planned expansion routes, assigning stops at approximately 0.25-
mile intervals. These stops were then reviewed, adjusted, and in some cases, eliminated to avoid dangerous
intersections or places where topography or the built environment simply would not allow a stop to be placed.
The result is shown in Figure 8. A total of 611 stop locations were identified for the 17 new routes.

Greenlink 2021 Transit Development Plan Update                                                           Page 16
Figure 8. Stop Location Analysis

Greenlink 2021 Transit Development Plan Update   Page 17
The 611 stops were then assigned to one of three stop types.

Type A
•   Includes a shelter, trash can, 12-ft x 6-ft concrete pad, and pole sign.
•   These stops were assigned to high traffic locations.
•   The estimated cost of an A stop is $26,000, including:
        o $13,500 for concrete pad
        o $12,450 for shelter/bench/ad sign/security lighting
        o $1,175 for trash can
        o $80 for pole sign
Type B
•   Includes a trash can, 8-ft x 5-ft concrete pad, and pole sign.
•   The estimated cost of a B stop is $6,100, including:
        o $4,850 for concrete pad
        o $1,175 for trash can
        o $80 for pole sign
Type C
•   Includes a trash can, 8-ft x 5-ft concrete pad, and pole sign.
•   Assigned to locations where additional permitting or easement will be needed.
•   The estimated cost of a C stop is $7,600, including:
        o $4,850 for concrete pad
        o $1,175 for trash can
        o $80 for pole sign
        o $1,500 for permitting

Bus Stop Capital Cost
The total estimated capital cost of bus stop infrastructure installation is $7.13 million (FY20$). Since routes are
planned for implementation from 2025 and beyond, this cost would not be incurred all at once and is essentially
pay-as-you-go for the fixed route expansion plan. The most expensive project would be the Blue
Ridge/Pleasantburg/Halton route, expected to cost $819,900. The least expensive is the GSP Connector, at
$26,000, since only one stop would need to be installed at the GSP Airport. Table 7 provides a summary of the
count and cost for this project by route.

Greenlink 2021 Transit Development Plan Update                                                            Page 18
Table 7. Bus Stop Infrastructure Needs by Route
A B C Stop Capital Cost
Stops Stops Stops Count (FY20$)
All Routes 158 432 51 641 $ 7,130,800
Blue Ridge/
Pleasantburg/Halton 13 79 0 92 $ 819,900
504 via Anderson/Gantt 13 47 16 76 $ 746,300
Faris/Haywood 17 26 8 51 $ 661,400
Pelham Connector 13 40 0 53 $ 582,000
Laurens/Woodruff 18 11 1 30 $ 542,700
Mauldin Circulator 14 23 2 39 $ 519,500
Greer Connector 15 15 2 32 $ 496,700
Howell 13 16 15 44 $ 549,600
US 123 All Day 9 22 0 31 $ 368,200
506 via Old Buncombe 6 28 5 39 $ 364,800
E. Pelham Circulator 6 28 0 34 $ 326,800
Fountain Inn Circulator 6 23 0 29 $ 296,300
Travelers Rest 5 26 0 31 $ 288,600
506 via Cedar Lane 2 29 2 33 $ 244,100
Prisma Connector 6 2 0 8 $ 168,200
504 via Mills 1 17 0 18 $ 129,700
GSP Connector 1 0 0 1 $ 26,000
Vehicle Plan
Service expansion will require a robust vehicle procurement plan. As noted above, Greenlink is currently debating
whether to use compressed natural gas (CNG) or electric propulsion for 40-ft vehicles procured for service
expansion. Both propulsion systems are addressed in the vehicle procurement plan.
The following vehicle costs were used in this estimate:
• 18-ft cutaway vehicles: $100,000 per vehicle
• CNG 35-ft bus: $550,000 per vehicle
• Electric 35-ft bus: $950,000 per vehicle (includes electric charger installed in maintenance facility)
Between 2021 and 2024 proposed service expansion includes operation of 30-minute headways on the core
Greenlink network. Greenlink is planning to purchase six CNG buses and six electric buses to operate this service
expansion. This purchase is already funded.
From 2025 onward, the propulsion for 40-ft buses is unknown. If CNG propulsion is selected, then 36 additional
vehicles will be needed, including:
• Seven 18-ft cutaway vehicles
• 29 35-ft CNG vehicles
Greenlink 2021 Transit Development Plan Update Page 19If electric propulsion is selected, then charging and battery life becomes an issue. Greenlink is preparing to
charge electric vehicles overnight at its new maintenance facility. However, the on-street performance of electric
batteries gives some concern. While battery life will undoubtedly improve over the next few years, Greenlink is
conservatively assuming a ratio of 2:1 compared to CNG vehicle requirements.
If electric propulsion is selected, then approximately 63 total vehicles will be needed, including:
• Seven 18-ft cutaway vehicles
• 56 35-ft electric vehicles
Due to the current 2:1 replacement ratio between electric propulsion and diesel, the capital cost of the vehicle
plan assuming electric buses ranges from $19.95 million to $59.60 million (FY20$). Table 8 provides a more
detailed look at operating cost of individual projects.
Greenlink 2021 Transit Development Plan Update Page 20Table 8. Vehicle Procurement Plan
35'-40' Vehicles
Funding Improvement Implementation Cutaway
Route Type Improvement CNG Electric Other Vehicles
Priority Type Year Vehicles
Fixed Route Greenlink Existing Fixed Route Network 13
GAP Existing GAP Service (Inflated FY19 + Extended Span) 5
Fixed Route/GAP Existing Trolleys & Spares 12
High Fixed Route Systemwide 2021-24 Extend Saturday Span (5:30a-11:30p)
High GAP Systemwide 2021-24 Extend GAP service to match Saturday span
High Capital 2021-24 New Maintenance Facility
High Capital 2021-24 Purchase new vehicles for 30 minute service & service modifications 6 6
High Fixed Route Systemwide 2021-24 Improve all Weekday routes to 30 min frequency
High Fixed Route Systemwide 2021-24 Improve all Saturday routes to 30 min frequency
High Fixed Route Systemwide 2021-24 Add Sunday service (60 min frequency; 12 hours)
High GAP Systemwide 2021-24 Extend GAP service to match Sunday Span
High Fixed Route Radial 2021-24 504 Split - Anderson/Donaldson 2 4
High Fixed Route Radial 2021-24 504 Split - Mills via Marue 1 2
High Fixed Route Radial 2021-24 506 Split - Cedar Lane 1 2
High Fixed Route Radial 2021-24 506 Split - Old Buncombe 1 2
Medium Fixed Route Circulator 2025-29 Prisma Circulator 1
Medium Fixed Route Radial 2025-29 Laurens/Woodruff 4 8
Medium Fixed Route Crosstown 2025-29 Blue Ridge/Pleasantburg/Halton 3 6
Medium Fixed Route Connector 2025-29 Greer Connector 1 2
Medium Fixed Route Connector 2025-29 Pelham Connector 1 2
Medium Fixed Route Connector 2025-29 Travelers Rest 1 2
Medium Fixed Route Radial 2025-29 US 123 All Day 2 4
Medium Capital 2025-29 Spares for short term route expansion 1 3 5
Medium GAP Systemwide 2025-29 GAP service for short term route expansion 3
Low Fixed Route Crosstown After 2029 Faris/Haywood 2 4
Low Fixed Route Circulator After 2029 East Pelham Circulator 1 2
Low Fixed Route Circulator After 2029 Fountain Inn 1 2
Low Fixed Route Connector After 2029 GSP Connector 1 2
Low Fixed Route Crosstown After 2029 Howell 1 2
Low Fixed Route Circulator After 2029 Mauldin Circulator 1 2
Low Capital After 2029 Spares for long term route expansion 2 3
Low GAP Systemwide After 2029 GAP service for long term route expansion 2
Greenlink 2021 Transit Development Plan Update Page 21Countywide Demand Response Plan This section presents the feasibility of operating demand response service for the parts of Greenville County where fixed route service does not currently operate and is not proposed to operate as part of the fixed route expansion plan. This analysis identified and reviewed peer agency demand response operations, developed operation characteristics for a demand response concept in Greenville County, and estimated potential ridership and operating costs. Peer Analysis A peer analysis was conducted using National Transit Database (NTD) 1 information for agencies operating demand response service in similar locations to Greenville County. A total of 15 peer agencies were identified, each operating demand response service in South Carolina, North Carolina, or northern Georgia. Each of the 15 operators was further investigated, and the list was narrowed to five preferred agencies that specifically provide county-wide demand response service. Figure 9. Peer Operators of Countywide Demand Response 1 2019 NTD data products - https://www.transit.dot.gov/ntd Greenlink 2021 Transit Development Plan Update Page 22
Table 9. Peer Operator Population Density
Population
Service Area Service Area
Demand Response Service Density
Pop (sq mi)
(pop/sq mi)
Mountain Mobility 238,318 657 363
Guilford County Mobility Services 248,111 646 384
ICATS Demand Response 161,202 576 280
Lancaster Area Ride Service 95,380 555 172
Hoke Area Transit Service 52,671 392 134
Peer Average 159,136 565 282
Greenville Area Paratransit 189,426 94 2,015
Table 10 presents the operational data for the five peers, along with a comparison to Greenlink GAP service. The
analysis review offers valuable insight into the applicability, operational metrics, and costs of county-wide
demand response services. The peer counties are similar in land area to Greenville County, but total population
varies. Greenville County has approximately twice the population of its peers; however, if the existing GAP service
area is excluded (as future demand response service would be provided for those outside of the current
Greenlink service area), then the balance of Greenville County is 189,426. This is comparable to Buncombe and
Guilford operators.
Table 10. Demand Response Peer Analysis
Annual Annual Annual Daily Annual
Operation Days of Peak Daily Trips Daily Trips Cost/
Demand Response Service Revenue Revenue Passenger Passenger Operating
Type operation Vehicles per Capita per Rev Hr RevHr
Miles Hours Trips Trips Expenses
Mountain Mobility PT 306 31 921,185 50,700 115,662 378 $2,850,669 0.0016 2.28 $56.23
Guilford County Mobility Services DO 255 21 406,127 18,558 44,918 176 $762,442 0.0007 2.42 $41.08
ICATS Demand Response DO 255 23 616,953 39,061 76,696 301 $1,638,617 0.0019 1.96 $41.95
Lancaster Area Ride Service DO 248 20 358,346 27,857 27,424 111 $615,305 0.0012 0.98 $22.09
Hoke Area Transit Service DO 255 11 462,434 24,675 55,795 219 $1,032,327 0.0042 2.26 $41.84
Peer Average 264 21 553,009 32,170 64,099 237 $1,379,872 0.0019 1.98 $40.64
Greenville Area Paratransit DO 306 5 92,644 7,211 9,455 31 $562,332 0.0002 1.31 $77.98
The remaining peers operate in less populated areas but provide adequate county-wide demand response
service for comparison. Mountain Mobility for Buncombe County likely offers the most similar operating
conditions to Greenville County. It is also the only peer agency that purchases transportation (PT), as the other
peers directly operate (DO) their demand response service. The peer averages for peak vehicles (21) and daily
passenger trips (237) are much larger than Greenlink’s GAP service, indicating that a substantial addition of
resources will be required to provide a countywide demand response service for Greenville.
Peer Performance Metrics
Review of the five preferred peers resulted in the calculation of key performance metrics, including daily trips
per capita, daily trips per revenue hour, and cost per revenue hour. These metrics provided insight into potential
demand, service productivity, and operational cost of future demand response service in Greenville County.
Daily trips per capita is a measurement of demand and can be applied to Greenville County to estimate daily
passenger trips (i.e. ridership). This analysis removed Hoke Area Transit Service from the calculation, as it
operates in more rural conditions and is considered an outlier for this metric. As a result, the daily trips per capita
assumed for Greenville County Demand Response is 0.0013 rides per resident.
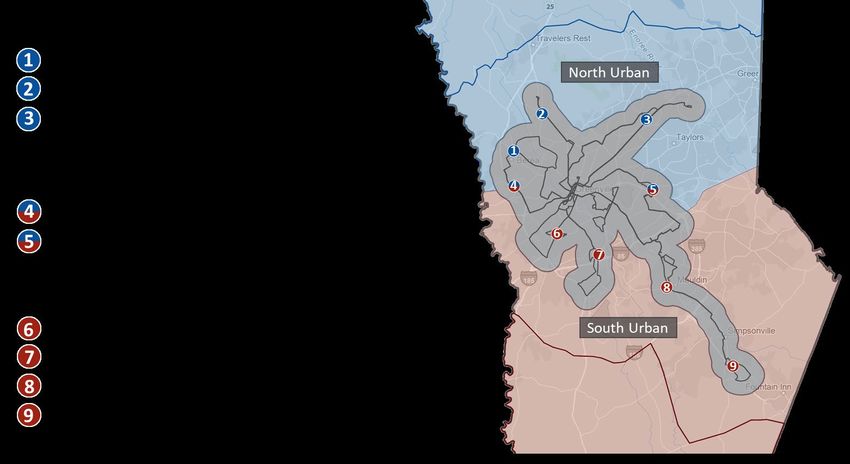
Greenlink 2021 Transit Development Plan Update Page 23Daily trips per revenue hour indicate how productive the service is by estimating the number of passenger trips provided for each hour of service operated. This measure will fluctuate based on the built environment. For example, more urbanized areas tend to have origins and destinations closer together and can compound multiple trips together for higher productivities. Lower density areas require longer trip distances, resulting in lower productivities. The peer analysis indicates that daily trips per revenue hour metrics range from approximately 1.0 to 2.4. For this analysis it was assumed service in urban areas result in 2.0 trips per revenue hour while service in rural areas result in 1.25 trips per revenue hour. Cost for demand response service can vary based on operating conditions and service provider. Most of the peer agencies directly operate their demand response service. Mountain Mobility is the lone agency that purchases service. Because Greenlink already operates GAP service, the cost of directly operated demand response was assumed to be $77.98 per revenue hour, the same as GAP cost per revenue hour. Cost for purchased demand response service was assumed to be $56.23 per revenue hour (i.e., Mountain Mobility’s service rate), with the assumption that Greenlink would manage a purchased transportation contract with current staff. Proposed Greenville County Demand Response Concept The demand response concept was developed to serve the outer parts of Greenville County. This section presents details on the operational elements, user experience, and expected operating and capital cost of the service. Zone Concept The demand response concept would include four zones in outer Greenville County, shown in Figure 10. Door to door travel would be allowed within the zone, but travel outside each zone would require transfer to Greenlink fixed route service. All zones would be anchored to 1-2 specific “in-town” locations that allow for transfer to the existing Greenlink fixed route network. Boundaries for these zones were created based on population densities and/or geographic break points. The elongated north-south nature of Greenville County and the existing Greenlink GAP service boundary resulting in a general split of north and south sides using I-85 on the east and Saluda Dam Rd in the west. The zones were further subdivided into “urban” and “rural” areas that reflect expected demand. The north and south urban zones extend approximately two to seven miles outward from the existing Greenlink GAP service boundary with the North Urban zone ending near Travelers Rest and the South Urban zone generally ending at I-185 and Highway 418. The remaining areas in Greenville County were classified as north and south rural zones. Anchor points for north and south zones were selected across the entire system at designated key points (e.g., grocery/commercial areas or medical facilities) that offer transfer opportunities to existing Greenlink fixed route services. These points are the only locations outside of the zone that the rider would be able to access. Identified transfer locations include three northern points, four southern points, and two points that serve both north and south zones. The anchor points are subject to change and can be limited based on origin location specified through Greenlink’s potential future policies. The following figures depict an overview of the zone concepts and provides details of each anchor point including the fixed route services they connect to. Greenlink 2021 Transit Development Plan Update Page 24
Figure 10. Zone Concept Overview

Service Characteristics
A ride on the demand response service would require a reservation 24 hours in advance, like Greenville Area
Paratransit service. The concept was assumed to operate at an identical span of service to the proposed fixed-
route system, including 18 hours on weekdays, 18 hours on Saturdays, and 12 hours on Sundays. 2

Service Policies
General assumptions were made for the demand response concept.

Eligibility
     •    Any Greenville County resident living outside of the core service area, generally defined as 0.75 miles
          from the expanded Greenlink fixed route network.

Ride Requests
     •    Rider can make a request to use the service no later than 24 hours prior to their trip. They will provide
          details on pick up and drop off locations and may schedule a return trip request.

2Span of service provided matches the Transit Development Plan Update recommended hours of service and does not reflect existing
operations.

Greenlink 2021 Transit Development Plan Update                                                                 Page 25
• Software for ride requests to be determined, depending on whether service is directly operated or
purchased transportation.
• Greenlink may allow for standing/recurring ride requests.
Trip Details
• Rider will be given a 30-minute time window for a pickup.
• Once onboard the vehicle, the driver will typically drop off passengers in the order that they were picked
up (if trips are shared) but may deviate if on-vehicle software recommends.
• Rider will be dropped off at destination (in-zone) or at anchor point if transferring to the fixed route
system.
Figure 11 provides a proposed anchor point system where riders could transfer to Greenlink fixed route services.
Greenlink would need to develop detailed written policies that outline specific eligibility, ride requirements, and
user costs prior to implementation.
Figure 11. Zone Concept Anchor Points
Greenlink 2021 Transit Development Plan Update Page 26Ridership Estimate
The peer analysis performance metrics developed in the previous section were utilized to estimate rider demand,
shown in Table 11. The rider estimate, combined with trips per revenue hour and service characteristics, resulted
in the fleet and revenue hour requirements.
Ridership Productivity
• Daily trips per capita – 0.0013
• Trips per revenue hour (urban) – 2.00
• Trips per revenue hour (rural) – 1.25
Service Spans and Days of Operation
• Weekday – 18 hours; 255 days annually
• Saturday – 18 hours; 52 days annually
• Sunday/Holiday – 12 hours; 58 days annually
Table 11. Zone Concept Ridership and Operating Statistics
Based on the above productivity and operating plan, a total of 484 daily trips are estimated to be served in the
four zones.
Capital Cost Estimate
This plan assumes Ford Transit vehicles would be used to operate all demand response service. At a cost of
$80,000 each, Greenlink would need $1.76 million (FY20$) in capital funding to implement the concept.
Operating Cost Estimate
As noted above, this analysis remains uncommitted to whether this concept should be directly operated or
purchased transportation. Table 12 presents costs for both direct and purchased options. Rates from the peer
analysis were used to develop these costs.
Table 12. Zone Concept Annual Cost Estimates
Concept Summary Annual Purchased Transportation Cost Estimate Annual Directly Operated Transportation Cost Estimate
Zone Desc. Type Weekday Saturday Sunday Total Weekday Saturday Sunday Total
North Urban Urban $1,223,882 $249,576 $185,582 $1,659,041 $1,697,455 $346,148 $257,392 $2,300,994
North Rural Rural $694,281 $141,579 $105,277 $941,137 $962,928 $196,362 $146,013 $1,305,303
South Urban Urban $1,439,153 $293,474 $218,224 $1,950,851 $1,996,022 $407,032 $302,665 $2,705,719
South Rural Rural $600,410 $122,437 $91,043 $813,890 $832,735 $169,813 $126,271 $1,128,818
Totals $3,957,727 $807,066 $600,126 $5,364,919 $5,489,140 $1,119,354 $832,340 $7,440,834
Purchased transportation, assumed to be $56.23 per revenue hour, would cost $5.36M (FY20$) annually to
operate the four zones. Directly operated, assumed at $77.98 per revenue hour, would cost $7.44M (FY20$)
annually to operate.
Greenlink 2021 Transit Development Plan Update Page 27You can also read