STINMOD+ - University of Canberra
←
→
Page content transcription
If your browser does not render page correctly, please read the page content below
Independent Modelling of Federal Budget 2018-19

                                 STINMOD+ |

          On Tuesday 8 May 2018, the Australian Federal Government unveiled its budget
          proposal and associated vision for policy priorities.

          NATSEM independently modelled some selected budget measures, including the
          multi-step tax reform, reverted medicare levy increase and more. This brochure
          briefly reports some of our findings.

natsem.canberra.edu.au                                                     governanceinstitute.edu.au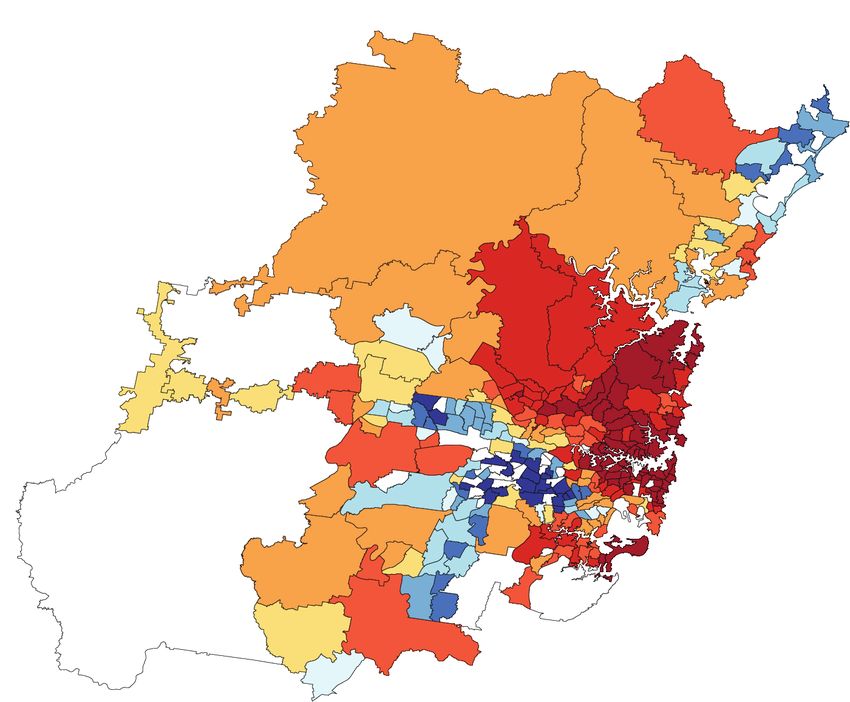
Federal Budget 2018: Continuing the Populist Turn

The 2018 Federal Budget has been launched at a time of greater economic certainty largely due to an improving
global outlook and a sharp rise in revenue. Over the next four years, the budget predicts an average growth in rev-
enue of 6.2%. To put this into historical perspective; that is almost double the average revenue growth experienced
by the Labour governments of Kevin Rudd and Julia Gillard and the Abbott government. It is noteworthy that
Treasury did not predict this spectacular turn in fortune just five months ago when it conducted the mid-year eco-
nomic and fiscal outlook (Myefo). Political scientists and commentators all over Australia will question why econo-
mists continue to get these forecasts so wrong. Budgets provide the evidence-base to inform the key decisions of
government. They frame the nature of the public policy agenda, and scope what is possible in policy terms. Poor
forecasting diminishes the quality of economic decision-making.

So where has the revenue come from? The largest contribution comes from income tax due to employment growth
and higher than expected prices for commodities. In addition, company tax is anticipated to grow by $15 billion over
the year; an increase of 22%. Personal income tax is also expected to increase by 6.3% over the next four years de-
spite tax cuts and wage growth is expected to rise to 3.5% by June 2021.

However, the 2018 Federal Budget has also proved wholly predictable in the sense that the Treasurer continued
with the populist turn established in the last budget in the run-up to the next federal election. Sweeteners have been
provided to Middle Australia with an increase in the low income tax offset; although the real number of people
who will benefit is difficult to ascertain and the biggest cuts will occur with the movement to a flat tax in July 2022.
Moreover, strategic investment in public transport projects, home care and pensions could help the government
consolidate its voter base.

In short, battlelines between government and opposition have now been clearly drawn for the next election with
Bill Shorten sure to focus on the inequity of Australians earning between $41,000 and $200,000 being taxed at the
same rate of just 32%. Moreover, the move towards a flat tax will inevitably be a painful process and is likely to attract
significant critical attention in the coming months.

Fiscal Outlook

The total revenue in FY 2018-19 is expected to be $486                               Revenue:
                                                                                     $486 Billion
billion, which is about 23.1% of the total GDP in Australia.
                                                                                     (23.1% of the
With revenue being lower than expenses, the government                               GDP)
expects a net operating deficit estimated at $2.4 billion in
2018-19. The social security and welfare, health, defence and
education functions account for nearly two-thirds of the to-
tal expenses, with social security and welfare ($176 billion)
being the largest expense in 2018-19.

Start monitoring

                     5pm - 6pm:                                6pm - 7pm:                                7pm - 8pm:                     8pm - 9pm:
                     auspol budget, big                        budget emergency break                    tax cut, budget auspol, debt   costello slams
                     infrastructure budget                                                               deficit disaster               deficit disaste

     Source: Twitter.com. The data was collected by NATSEM. Data bars report the number of tweets during a 10 minutes interval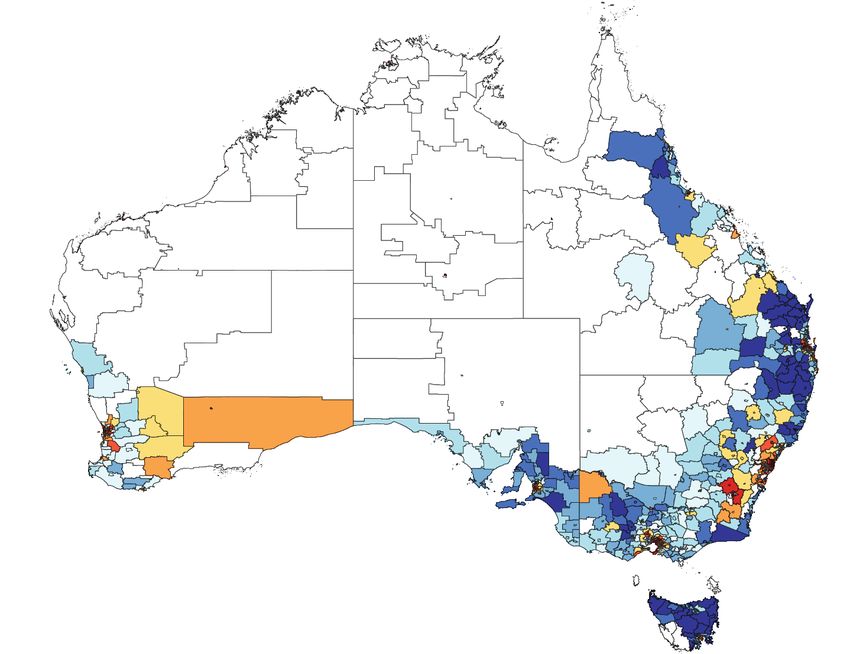
Population

                  As the 2018 budget measures are planned to be implemented in multiple phases, we model the impact of the
                  budget measures at each milestone. This includes Phase 1, 2018-19, when the low and middle income tax offset
                  will be introduced and one of the tax thresholds will be adjusted. Phase 2, 2022-23, will include a change of the
                  low income tax offset to replace the low and middle income tax offset, and further tax threshold changes will be
                  implemented. Phase 3, 2024-25, will complete the last step of the personal income tax reform with the removal
                  of the second highest tax bracket. Besides tax change, our modelling in all sections also includes the dropped
                  Medicare levy change and increased pensioner work bonus as part of the proposed budget measures.

                  All these measures will affect people depending on their income levels and household types. This section re-
                  views how different household types and different income levels are affected by the 2018-19 Federal Budget
                  measures. In absolute terms, high income earners are most likely to benefit from the tax reform once it is fully
                  implemented which will occur in stages. The measures put in place for the upcoming financial year, 2018-2019,
                  will mostly benefit middle income earners due to the changes in tax offset criteria. Lower income earners, how-
                  ever, will benefit less than middle income earners as they already pay no or little tax. Couples, on average, benefit
                  more due to the possible dual earning capacities and associated higher income levels.

                                 Disposable Income Change                                                                                   2018-19
                                                                                                                                            Measures
                                    Q2     Q3       Q4    Q5
                                                                                                                                            2022-23
                                                                                                                                            Measures

                                                                                                                                            2024-25
                                                                                                                                            Measures

                                                                   Annual household pre-tax income
                 The income quintile used for the income unit type analysis is calculated using households’ current equivalised
                 disposable incomes. The disposable income change is plotted with the absolute income level, with vertical ref-
                 erence lines indicating the positions of total pre-tax income quintile thresholds.

                           Policy Impact by Income Unit Type

                           Q1 Q2 Q3 Q4 Q5 Q1 Q2 Q3 Q4 Q5 Q1 Q2 Q3 Q4 Q5 Q1 Q2 Q3 Q4 Q5

                                2018-19 Measures

                                2022-23 Measures

                                2024-25 Measures

                                       Single                   Single Parent                      Couple Only        Couple with Children

8pm - 9pm:                               9pm - 10pm:                            10pm - 11pm:                     11pm - 12pm:
costello slams turnbull, debt            budget amp howard, size union          annual budget pay, australias    budget deficit, federal budget
deficit disaster                         budget                                 national debt,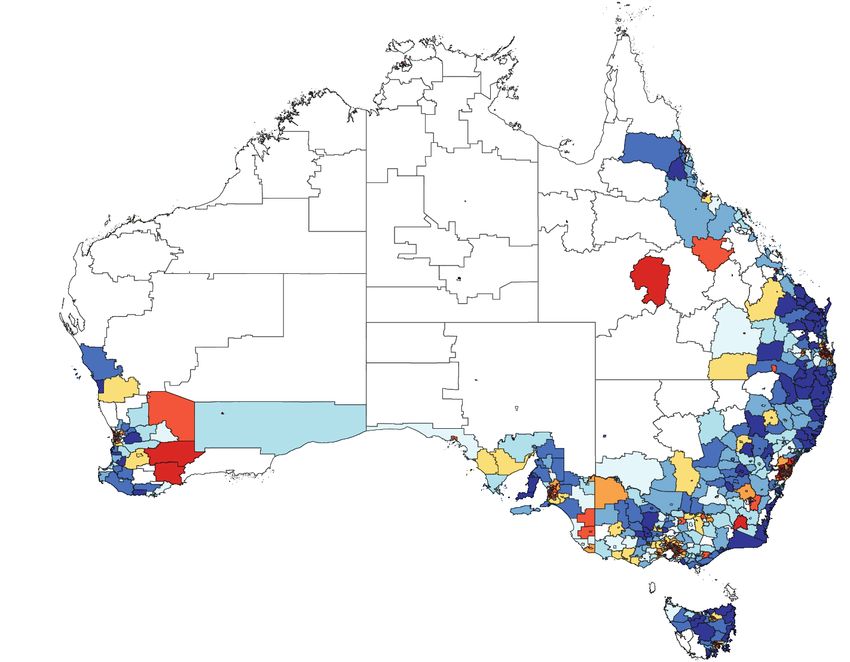
Winners and Losers

          This section examines a range of most commonly observed household types in Australia and identifies who benefit
          the most and the least from the proposed reforms. Generally, no one would be worse off due to the budget mea-
          sures focusing on tax cuts. Middle income earners benefit the most in the financial year 2018-19 thanks to the intro-
          duction of the low and middle income tax offset and an increase in tax threshold. Those earning an average full-time
          salary of $83,000 per year would get a maximum tax offset of $530 back in the upcoming financial year. However,
          in the long term, individuals with high incomes will benefit the most once the tax reform is fully implemented. For
          example, a couple both earning twice the average full-time salary can expect an extra $13,000 in 2024-25.
                                                                                                                                            $240,000
                           $130,000   Disposable income change in selected income units
Annual disposable income

                                                                                                                                                       Annual disposable income
                           $129,000                                                                                                         $232,000

                           $128,000                                                                                                         $224,000

                           $127,000                                   Average Wage High Wage                                                $216,000

                           $126,000                                        with 2018 budget                                                 $208,000

                                                                          without 2018 budget                                               $200,000
                           $125,000
                                      2015 2016 2017 2018 2022 2024                               2015 2016 2017 2018 2022 2024
                                                                                        Winner and Loser from the 2018 budget impact
          Although there are no significant losers under the 2018                          2018
          budget, a segment of the population will not bene-                                                            Retired
                                                                                           2022
          fit from any of the proposed measures. This includes
          pensioners with no income and the unemployed. They                               2024
          are among the most vulnerable population in Austra-                                                           Unemployed
          lia. The benefit of the measures primarily depends on
          the taxable income. This means that for households
                                                                                                                        Minimum Wage
          with the same income, they may not necessarily enjoy
          the same level of benefit. For instance, a couple both
          at average wage will be better off by $1,060 in 2018-19,                                                      Average Wage
          while a single earner household with the same income
                                                                                                                              High Wage
          (one with high income and one unemployed) will re-
          ceive tax relief of only $135.
                                                                                                  0      1500        3000        4500      6000
                                                                                                  Changes is annual disposable income (in 2018 $)
                  Poverty
                                                                                         Poverty reduction due to 2018 budget measures
           Despite Australia being one of the richest countries in terms                                                                        0.00%
                                                                                                                                                                           Change in poverty rate

           of per capita income, some in the community still struggle with                                                                      -0.20%
           poverty. Using 50% of median household income as the poverty                                                                         -0.40%
           line and keeping it constant in real terms from 2018-19 onwards,
                                                                                                                                                -0.60%
           we estimate the impact of this year’s federal budget measures
           on poverty rates in 2018-19, and 2024-25 for some of the most                                                                        -0.80%
           vulnerable groups in Australia. As shown, the poverty reduction
           effect of the budget is relatively small, with less than one percent-                   Population     Children        Elderly
           age point change in any of the selected groups when the mea-
           sures are fully implemented. The measures seem to have the least                            2018-19     2022-23    2024-25
                                                                                                       Measures
           impact on old age poverty.                                                                              Measures   Measures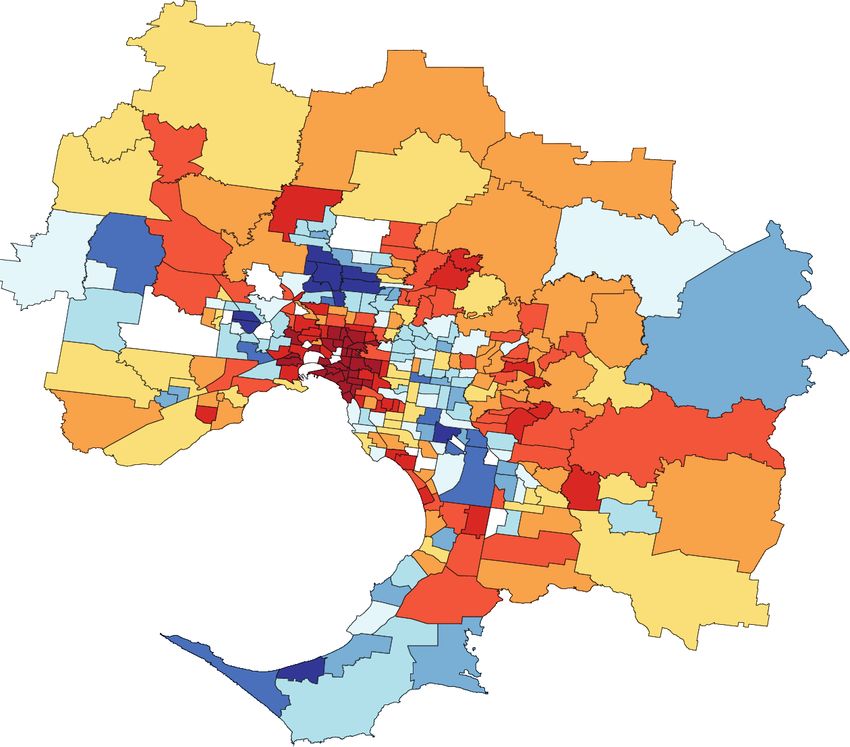
Infrastructure Spend

Estimates of returns on infrastructure over a life cycle      Figure 1:
vary, but estimates of a $4 return on every dollar spent      Budgeted Road and Rail expenditure
has been quoted in this year’s budget papers. This
means that not only is it a good financial investment                                              Roads in Capital Cities
                                                                    Rail
for the Government, it can also provide social returns
to the communities benefiting from the infrastructure.
                                                                               $7.7 Bn     $5.1 Bn

The budget contained $20.4 Bn of new identified road                                     $7.6 Bn
and rail infrastructure (excluding already announced
national initiatives and unidentified future national
priorities), with the largest amount ($5 Bn) for the
Melbourne airport rail link. Expenditure on roads and
rail outside capital cities totalled $8 Bn, while in cap-                                  Roads Outside Capital Cities
ital cities it was $12.4 Bn, mainly due to expenditure
in Melbourne ($7.8 Bn with $5 Bn of this being the
airport rail link).                                           Figure 2:
                                                              Budgeted Road and Rail expenditure by
A total of $12.7 Bn was committed to spending on              Capital City/Outside Capital City
roads, with $5 Bn on roads in capital cities and $7.6 Bn
on roads outside capital cities. $7.7 Bn was committed                                         Capital Cities
to spending on rail, with nearly all this ($7.3 Bn) in cap-
ital cities.
                                                                                             $8 Bn

Spending on rail in capital cities is a positive move in                          $12.4 Bn
terms of reducing traffic congestion; however the ma-
jority of the rail spend of $7.7 Bn is the Melbourne-Air-
port rail link of $5 Bn. While this will reduce the amount
of traffic going from the city to the airport, without this
the spend on roads in capital cities is much higher than      Outside Capital Cities
the spend on rail excluding the airport rail link ($5 Bn
compared to $2.6 Bn). This then raises the question –
do we really need more roads in our cities? Or should         Figure 3:
we be looking to fund alternatives that reduce our reli-      Budgeted infrastructure expenditure by
ance on cars? Many European cities are now excluding          State             Vic
cars from the central district, or at least charging for
cars accessing the central district (London).                                                               WA
                                                                 Tas             $7.8 Bn
There is a commitment to improving roads outside                                             $2.9 Bn
capital cities, with $7.6 Bn committed, more than that                     $0.9 Bn           $1.6 Bn
                                                                              $1.8 Bn                             NSW
committed to roads in capital cities. This is important                                    $0.3 Bn
                                                                                    $5.2 Bn                      NT
for reducing road fatalities in these areas.
                                                               SA

                                                                                                   Qld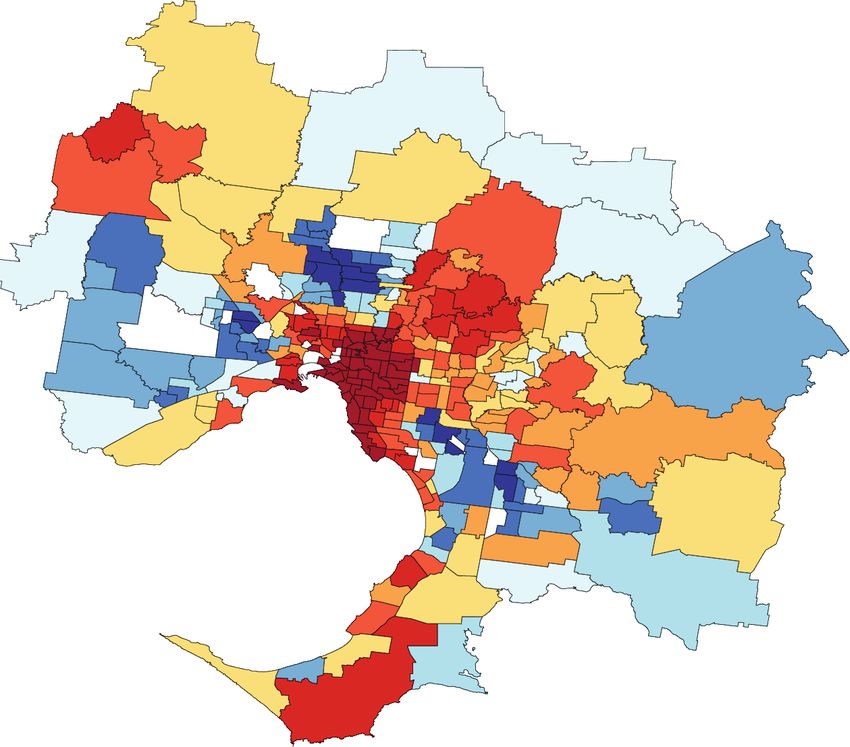
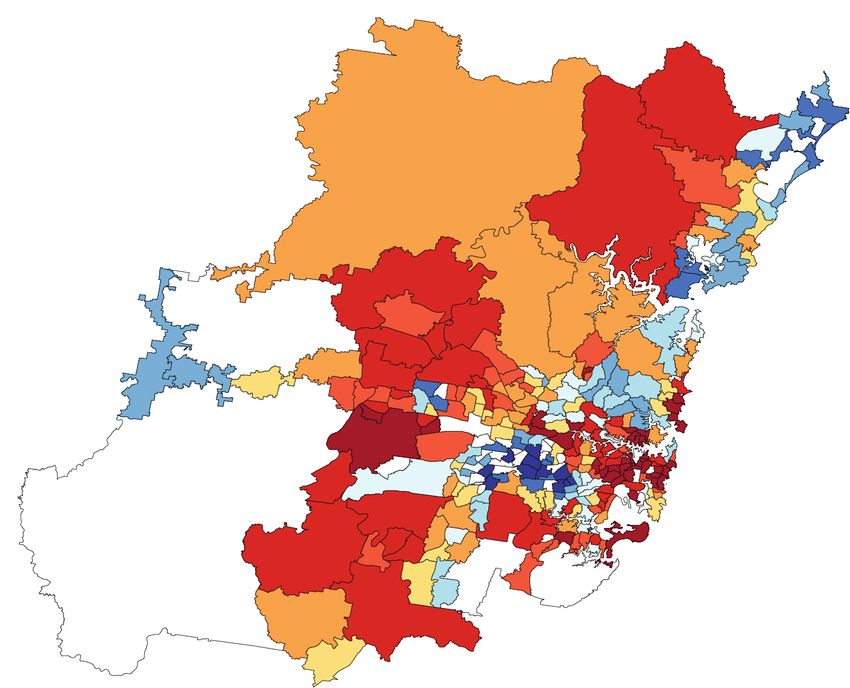
Spatial Distribution

NATSEM has been able to use their innovative small area modelling technique to identify the effect of the tax
and transfer changes in the 2018 budget on a suburb. This shows that for 2018-19 (stage 1 of the tax changes),
the areas that gained most were around the cities, but there were also some regional areas that benefitted. Areas
that benefitted least were in Northern NSW, and some areas of Tasmania, although some areas of Tasmania
were also in the high gain areas. The average gain was from $66 to $268.

In Sydney and Melbourne, after Stage 1 of the tax change, there are a mix of areas with strong gains and low
gains, with some North shore areas of Sydney gaining the highest amount; but some not gaining as much. This
is because stage 1 of the tax changes mainly affected low and middle income earners.

Looking at the proposed 2024-25 changes, the average amounts were much higher ($3,158 to $9,593) and across
Australia the areas that benefitted the most were in cities, and areas surrounding cities. The areas benefitting
least were areas on the far North coast of NSW, and areas in Tasmania, due to the lower incomes in these
areas. Looking at the results for Sydney and Melbourne, we see that higher income areas in Northern Sydney
and inner Melbourne benefit most; and areas that benefit
the least are areas in South-West Sydney; and North
and South-East Melbourne. These are also lower
income areas.

Changes in Annual Disposable Income Per Capita in 2018-19

                                       Average Change in Disposable Income

Greater Melbourne                                      Greater Sydney
Changes in Annual Disposable Income Per Capita in 2024-25

                              Average Change in Disposable Income

Greater Melbourne                                Greater Sydney

               PERSONALISED BUDGET IMPACT

               STINMOD+ online allows anyone to enter their family details and find out what financial
               impact the tax and welfare measures in the budget have on the family. You may visit the
               link https://stinmod.canberra.edu.au/stinmod/family_impact to get a personalised budget
               impact assessment.
Independent Modelling of Federal Budget 2017-18
STINMOD+ |
The National Centre for Social and Economic Modelling (NATSEM) at the University
of Canberra is one of the premier sources of independent quantitative social and eco-
nomic research services and policy advice in Australia, and one of the world’s foremost
centres of excellence for microsimulation, economic modelling and policy evaluation.
STINMOD+ is an advanced tax microsimulation model developed by a team led by Dr
Jinjing Li. The model is designed to evaluate the distributional and fiscal impact of tax
and transfer policies in Australia. It covers all major taxation and welfare schemes in Aus-
tralia and has a longitudinally consistent policy database from 2001 onwards, including
comprehensive income and asset testing. Numbers presented are preliminary estimates
which may contain sampling and non-sampling errors. NATSEM has no affiliation with
any political party and received no external funding to conduct this budget analysis.
For more information about NATSEM, please visit https://natsem.canberra.edu.au/
For more information about STINMOD+, please visit https://stinmod.canberra.edu.au/
This brochure contains analyses from Jinjing Li, Hai Anh La, Robert Tanton, Yogi Vidyattama, Nhung
Nguyen and Michael Jensen.You can also read


