Second Quarter 2021 Earnings Presentation - August 3, 2021
←
→
Page content transcription
If your browser does not render page correctly, please read the page content below

Second Quarter 2021
Earnings Presentation
August 3, 2021

Commitment to Corporate Social Responsibility is
Formed by Five Longstanding Core Values

     Westlake’s sustainability report can be found at https://www.westlake.com/sustainability   2
Advancing Sustainability
Developing Green Products
Vinnolit, a Westlake company, offers certified climate-friendly caustic soda utilizing
renewable energy Guarantees of Origin (GOs). The CO2 footprint of this low-carbon
caustic soda introduced to the market under the brand name GreenVin is reduced by
more than 30% compared to conventional Vinnolit caustic soda. We are continuing
to work to develop additional green products that will drive value while reducing our
carbon footprint. We are continuing to develop products that are in line with our
sustainability goals while meeting the need for greener products.

Protecting the Environment
Westlake has numerous programs designed to promote safe, ethical,
environmentally and socially responsible practices including: a worldwide recycling
program, operating in an energy efficient manner and reducing water usage and
emissions. As discussed in our sustainability report, over a five year period,
Westlake has reduced Sulphur Dioxide emissions to almost zero, reduced energy
usage per ton of global production and achieved a nearly 30% reduction on CO 2
emissions.

Participating in Multi-Industry Associations for Environmental Protection
Westlake is a proud partner with the following organizations to drive sustainable action to eliminate plastic waste, capture more
flexible food packaging waste for recycling and support vinyls’ sustainable impact in the world, along with many other initiatives.

                                                                                                                               3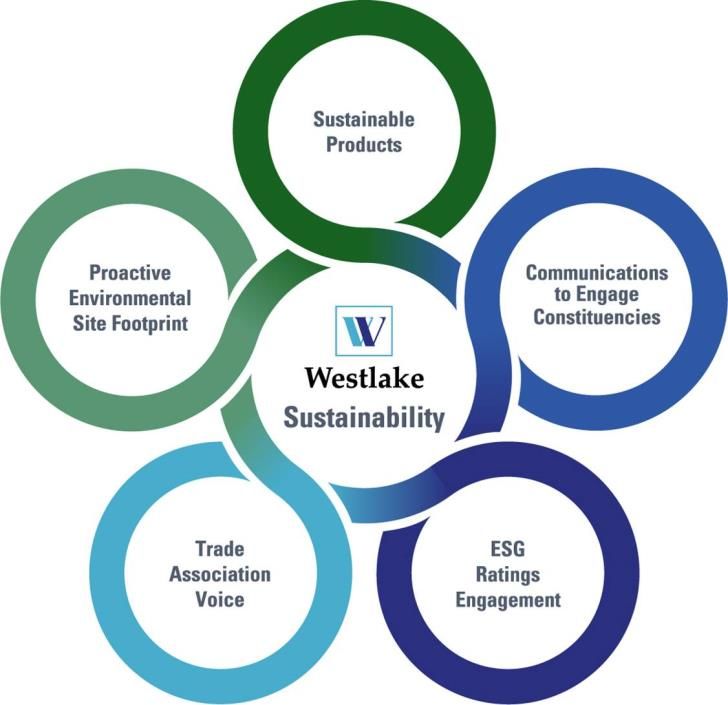
Westlake Chemical Second Quarter 2021 Highlights
1
$522 MM $4.04 $1.8 B $932 MM
Business
Business Highlights
Highlights
Westlake achieved record quarterly net income of $522 million, excluding one-time tax benefits, and record EBITDA
of $932 million, anchored by strong margins across our product offerings and generated $617 million in operating
cash flows
Announced agreement to acquire Boral’s North American building products businesses in roofing; siding, trim and
shutters; decorative stone; and windows, transforming our building and construction materials business
Announced agreement to acquire LASCO Fittings, Inc., a leading manufacturer of injected-molded PVC fittings
Industry
Industry Outlook
Outlook
Continued strength in PVC driven by globally strong demand in new construction, repairs and remodeling activity
Consumer demand remains robust for essential everyday packaged products driving value in polyethylene
4
(1) Reconciliations of EBITDA to the applicable GAAP measure can be found on page 10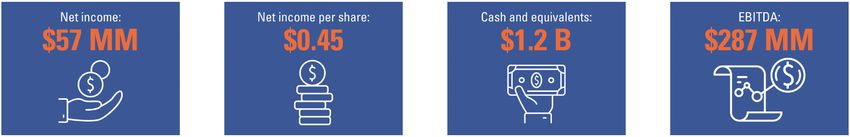
Westlake Chemical Corporation
Second Quarter 2021 Financial Highlights

                                                                         2Q2021 vs.                                                                          YTD 2021 vs.
    ($ in millions)                      2Q2021           1Q2021            1Q2021         2Q2020                          YTD 2021 YTD 2020                    YTD 2020
    Sales                                 $2,859           $2,357              21%          $1,709                           $5,216   $3,641                       43%

    Operating Income                         $720              $346          108%                $36                            $1,066              $172         520%

     Vinyls EBITDA                             $605            $367             65%             $182                               $972              $414         135%
     Olefins EBITDA                            $316            $216             46%              $60                               $532              $158         237%
     Corporate EBITDA                           $11            ($30)               -             ($6)                              ($19)               $1             -
    EBITDA¹                                  $932              $553            69%             $236                             $1,485              $573         159%

Second Quarter 2021 vs. First Quarter 2021          Second Quarter 2021 vs. Second Quarter 2020
+ Higher sales prices for all of our major products + Higher sales prices and margins for most of our
   including PVC resin, polyethylene, building and     major products, including PVC resin and
   construction materials and caustic soda             polyethylene
+ Higher sales volumes for PVC resin                + Higher sales volumes for PVC resin
+ Strong earnings in our building and construction + Strong earnings in our building and construction
   materials business driven by high prices            materials business driven by higher prices and
                                                       volumes
                                                    – Higher feedstock and fuel costs

                                                                                                                                                                            5
           (1)   Reconciliations of EBITDA, Vinyls EBITDA, Olefins EBITDA and Corporate EBITDA to the applicable GAAP measures can be found on pages 10 and 11
Vinyls Segment Performance

                                                                      2Q2021 vs.                                             YTD 2021 vs.
   ($ in millions)                     2Q2021           1Q2021         1Q2021            2Q2020          YTD 2021 YTD 2020    YTD 2020
   Sales                                $2,188           $1,820             20%           $1,348           $4,008   $2,853         40%
   Operating Income                       $435             $200            118%              $20             $635      $93        583%
   EBITDA¹                                $605             $367             65%            $182              $972     $414        135%

Second Quarter 2021 vs. First Quarter 2021          Second Quarter 2021 vs. Second Quarter 2020
+ Higher sales prices for all of our major products + Higher sales prices and margins
   and higher integrated margins                    + Higher sales volumes for PVC resin
+ Higher sales volumes for PVC resin                + Strong earnings in our building and construction
+ Strong earnings in our building and construction     materials business driven by higher prices and
   materials business driven by higher prices          volumes
– Lower caustic sales volumes                       – Higher feedstock and fuel costs

                        Vinyls Segment                                                                 Vinyls Segment
                      2Q 2021 vs. 1Q 2021                                                            2Q 2021 vs. 2Q 2020

                 +18.2%                       +2.1%                                                 +53.5%      +9.0%

                                                                                                                                            6
           (1)   Reconciliations of EBITDA to the applicable GAAP measure can be found on page 11
Olefins Segment Performance

                                                                       2Q2021 vs.                                              YTD 2021 vs.
   ($ in millions)                     2Q2021           1Q2021            1Q2021         2Q2020            YTD 2021 YTD 2020      YTD 2020
   Sales                                 $671             $537               25%           $361              $1,208     $788        53%
   Operating Income                      $277             $180               54%            $25                $457      $87       425%
   EBITDA¹                               $316             $216               46%            $60                $532     $158       237%

Second Quarter 2021 vs. First Quarter 2021                                               Second Quarter 2021 vs. Second Quarter 2020
+ Higher polyethylene sales prices and margins                                           + Higher polyethylene sales prices and margins
– Higher ethane feedstock costs                                                          – Lower polyethylene sales volumes
                                                                                         – Higher ethane feedstock costs

                       Olefins Segment                                                                 Olefins Segment
                      2Q 2021 vs. 1Q 2021                                                             2Q 2021 vs. 2Q 2020

                 +25.5%                        -0.6%                                                +99.9%        -13.9%

                                                                                                                                              7
           (1)   Reconciliations of EBITDA to the applicable GAAP measure can be found on page 11
Financial Reconciliations
Consolidated Statements of Operations
                                                                   Three months
                                                                                        Three months ended June 30,                   Six months ended June 30,
                                                                  ended March 31,
                                                                       2021              2021                  2020                   2021                2020

                                                                                         (In millions of dollars, except per share data)

Net sales                                                     $           2,357     $        2,859       $          1,709        $         5,216     $        3,641
Cost of sales                                                             1,848              1,987                  1,540                  3,835              3,189
Gross profit                                                               509                  872                   169                  1,381                  452
Selling, general and administrative expenses                               136                  125                   104                    261                  224
Amortization of intangibles                                                 27                   27                    27                     54                   54
Restructuring, transaction and integration-related costs                      -                    -                    2                       -                   2
Income from operations                                                     346                  720                    36                  1,066                  172
     Interest expense                                                      (33)                 (36)                  (40)                   (69)                 (71)
     Other income, net                                                      12                   10                     9                     22                   20
Income before income taxes                                                 325                  694                     5                  1,019                  121
     Provision for (benefit from) income taxes                              72                  158                   (19)                   230                  (60)
Net income                                                                 253                  536                    24                    789                  181
     Net income attributable to noncontrolling interests                    11                   14                     9                     25                   21

Net income attributable to Westlake Chemical Corporation      $            242      $           522      $             15        $           764     $            160

Earnings per common share attributable to Westlake Chemical
Corporation:
   Basic                                                      $            1.88     $           4.06     $            0.11      $            5.94   $             1.24
   Diluted                                                    $            1.87     $           4.04     $            0.11      $            5.91   $             1.24

                                                                                                                                                             9
Reconciliation of EBITDA to Net Income, Income from
Operations and Net Cash Provided by Operating Activities
Three months
Three months ended June 30, Six months ended June 30,
ended March 31,
2021 2021 2020 2021 2020
(In millions of dollars)
Net cash provided by operating activities $ 265 $ 617 $ 448 $ 882 $ 509
Changes in operating assets and liabilities and other (2) (67) (454) (69) (232)
Deferred income taxes (10) (14) 30 (24) (96)
Net income 253 536 24 789 181
Less:
Other income, net 12 10 9 22 20
Interest expense (33) (36) (40) (69) (71)
Benefit from (provision for) income taxes (72) (158) 19 (230) 60
Income from operations 346 720 36 1,066 172
Add:
Depreciation and amortization 195 202 191 397 381
Other income, net 12 10 9 22 20
EBITDA $ 553 $ 932 $ 236 $ 1,485 $ 573
10Reconciliation of Vinyls, Olefins and Corporate EBITDA to
Applicable Operating Income (Loss)
Three months ended
March 31, Three months ended June 30, Six months ended June 30,
2021 2021 2020 2021 2020
(In millions of dollars)
Vinyls EBITDA $ 367 $ 605 $ 182 $ 972 $ 414
Less:
Depreciation and Amortization 157 163 154 320 307
Other Income (Expenses) 10 7 8 17 14
Vinyls Operating Income (Loss) 200 435 20 635 93
Olefins EBITDA 216 316 60 532 158
Less:
Depreciation and Amortization 36 37 35 73 70
Other Income (Expenses) - 2 - 2 1
Olefins Operating Income (Loss) 180 277 25 457 87
Corporate EBITDA (30) 11 (6) (19) 1
Less:
Depreciation and Amortization 2 2 2 4 4
Other Income (Expenses) 2 1 1 3 5
Corporate Operating Income (Loss) (34) 8 (9) (26) (8)
Vinyls Operating Income (Loss) 200 435 20 635 93
Olefins Operating Income (Loss) 180 277 25 457 87
Corporate Operating Income (Loss) (34) 8 (9) (26) (8)
Total Operating Income (Loss) $ 346 $ 720 $ 36 $ 1,066 $ 172
11Quarterly Industry Pricing
Average Quarterly Industry Prices (1)
                                                                                                                           Quarter Ended
                                                                            June 30,              September 30,             December 31,               March 31,                 June 30,
                                                                             2020                     2020                      2020                    2021                      2021
       Average domestic prices
       Natural gas ($/MMBtu) (2)                                                        1.8                      2.0                      2.7                        2.8                       2.9
       Ethane (cents/lb) (3)                                                            6.4                      7.4                      7.1                        8.1                       8.7
       Propane (cents/lb) (4)                                                           9.6                    11.9                      13.5                      21.2                      20.7
       Ethylene (cents/lb) (5)                                                         11.0                    19.3                      24.0                      45.1                      43.0
       Polyethylene (cents/lb) (6)                                                     49.0                    61.0                      67.7                      78.0                      99.0
       Styrene (cents/lb) (7)                                                          48.3                    53.8                      59.6                      76.5                      90.5
       Caustic soda ($/short ton) (8)                                                   698                     697                       653                       648                       755
       Chlorine ($/short ton) (9)                                                       175                     176                       193                       234                       309
       PVC (cents/lb) (10)                                                             66.5                    73.3                      84.5                      92.8                     105.0

       Average export prices
       Polyethylene (cents/lb) (11)                                                    38.5                    45.7                      53.2                      76.3                      89.7
       Caustic soda ($/short ton) (12)                                                  319                     260                       219                       249                       333
       PVC (cents/lb) (13)                                                             27.5                    38.5                      55.4                      67.8                      77.8
 1)    Industry pricing data was obtained through IHS Markit ("IHS"). We have not independently verified the data.
 2)    Average Burner Tip contract prices of natural gas over the period.
 3)    Average Mont Belvieu spot prices of purity ethane over the period.
 4)    Average Mont Belvieu spot prices of non-TET propane over the period.
 5)    Average North American spot prices of ethylene over the period.
 6)    Average North American Net Transaction prices of polyethylene low density GP-Film grade over the period.
 7)    Average North American contract prices of styrene over the period.
 8)    Average USGC-CSLi index values for caustic soda over the period. As stated by IHS, "the caustic soda price listing represents the USGC-CSLi values. USGC-CSLi does not reflect contract
       price discounts, implementation lags, caps or other adjustments factors. Additionally, it is not intended to represent a simple arithmetic average of all market transactions occurring during the
       month. Rather, the USGC-CSLi is most representative of the month-to-month caustic soda price movement for contract volumes of liquid 50% caustic soda rather than the absolute value of
       contract prices at a particular point in time. It is intended to serve only as a benchmark."
 9)    Average North American contract prices of chlorine over the period.
 10)   Average North American contract prices of pipe grade polyvinyl chloride ("PVC") over the period. As stated by IHS, "the contract resin prices posted reflect an "index" or "market" for prices
       before discounts, rebates, incentives, etc."
 11)   Average North American export price for low density polyethylene GP-Film grade over the period.
 12)   Average North American low spot export prices of caustic soda over the period.
 13)   Average North American spot export prices of PVC over the period.

                                                                                                                                                                                                     13
Safe Harbor Language
This presentation contains certain forward-looking statements including statements regarding PVC, polyethylene, building products and caustic soda
pricing and demand, continued recovery in key end markets (such as housing starts), our cost control and efficiency efforts, our ability to capture
integrated chain margin, results of reinvestment in our businesses and our reduction in carbon impact. Actual results may differ materially depending
on factors, including, but not limited to, the following: the timing to consummate the previously announced acquisitions (the “Acquisitions”) of (i) Boral
Limited’s North American building products business and (ii) LASCO Fittings, Inc. (“LASCO”); the conditions to the closing of the Acquisitions may not
be satisfied or the closing of the Acquisitions otherwise does not occur; the risk that Hart-Scott-Rodino Antitrust Improvements Act of 1976, as
amended, approval is not obtained or is obtained subject to conditions that are not anticipated; the diversion of management time on transaction-
related issues; the ultimate timing, outcome and results of integrating the operations of the Boral target companies and LASCO and the ultimate
outcome of our operating efficiencies applied to the products and services of the Boral target companies and LASCO; the effects of the Acquisitions,
including the combined company’s future financial condition, results of operations, strategy and plans; and expected synergies and other benefits from
the Acquisitions and our ability to realize such synergies and other benefits; general economic and business conditions; the cyclical nature of the
chemical and building products industries; the availability, cost and volatility of raw materials and energy; uncertainties associated with the United
States, European and worldwide economies, including those due to political tensions and unrest in the Middle East and elsewhere; uncertainties
associated with pandemic infectious diseases, particularly COVID-19; current and potential governmental regulatory actions in the United States and
other countries; industry production capacity and operating rates; the supply/demand balance for our products; competitive products and pricing
pressures; instability in the credit and financial markets; access to capital markets; terrorist acts; operating interruptions (including leaks, explosions,
fires, weather-related incidents, mechanical failure, unscheduled downtime, labor difficulties, transportation interruptions, spills and releases and other
environmental risks); changes in laws or regulations, including trade policies; technological developments; foreign currency exchange risks; our ability
to implement our business strategies; creditworthiness of our customers; and other factors described in our reports filed with the Securities and
Exchange Commission. Many of these factors are beyond our ability to control or predict. Any of these factors, or a combination of these factors,
could materially affect our future results of operations and the ultimate accuracy of the forward-looking statements. These forward-looking statements
are not guarantees of our future performance, and our actual results and future developments may differ materially from those projected in the
forward-looking statements. Management cautions against putting undue reliance on forward-looking statements. Every forward-looking statement
speaks only as of the date of the particular statement, and we undertake no obligation to publicly update or revise any forward-looking statements.
Investor Relations Contacts
Steve Bender Jeff Holy
Executive Vice President & Vice President &
Chief Financial Officer Treasurer
Westlake Chemical
2801 Post Oak Boulevard, Suite 600
Houston, Texas 77056
713-960-9111 14You can also read