EMFF OP 2014-2020 Knowledge Gateway Scheme 2016 Bord Iascaigh Mhara Service Project - Report on BIM Cleaner Fish Programme 2016
←
→
Page content transcription
If your browser does not render page correctly, please read the page content below
EMFF OP 2014-2020
      Knowledge Gateway Scheme
                  2016

   Bord Iascaigh Mhara Service Project

Report on BIM Cleaner Fish Programme 2016
December 2016

2016 CLEANERFISH PROGRAMME NUIG CARNA RESEARCH STATION
                                     FINAL REPORT

BIM put the proposed 2016 BIM cleaner fish programme to tender in late 2015 and NUIG
Carna Research Station was awarded the contract to carry out a programme of work to
develop techniques to produce a minimum of 200,000 juvenile lumpfish >8g (a size suitable
for sea deployment). This work was carried out by a team headed up by Dr Majbritt Bolton-
Warberg at the Carna Research Station facilities in Carna, Co. Galway.

This work is funded by the European Maritime and Fisheries Fund 2014-2020 (EMFF).

Overview of Project
The overall goal of the Cleaner Fish Programme 2016 was to develop techniques to produce
200,000 lumpfish (Cyclopterus lumpus) larvae from eggs using available best practice
methods for delivery to sea for use in an integrated management plan to control lice. The
Cleaner Fish Programme 2016 had a start date of April 1st 2016 and all work was undertaken
at Carna Research Station (CRS), the National 2of Ireland Galway’s base for marine research.
Once juvenile lumpfish reach a suitable size (10-15 g+) they are deployed to sea for use as
cleaner fish. This report provides an overview of all the work undertaken in 2016 under this
project.

Summary of Previous Work
January to April 2016

2015 Cohort grow-out in 2016

In 2015, three distinct groups of lumpsucker were incubated as eggs and reared on site in
Carna for the 2015 Cleanerfish Programme, two from Norway (juveniles imported late
January 2015 and eggs imported in May 2015) and one from the UK. The Norwegian
juveniles and eggs were imported from Flekkefjord, southern Norway. More than 100,000
lumpsucker were reared at CRS in 2015, with approximately 50,000 remaining on site in
January 2016. These fish were not of sufficient size to be transferred from the hatchery
facility to sea prior to Christmas transfer deadlines. At this time they were 6 months post

                                             2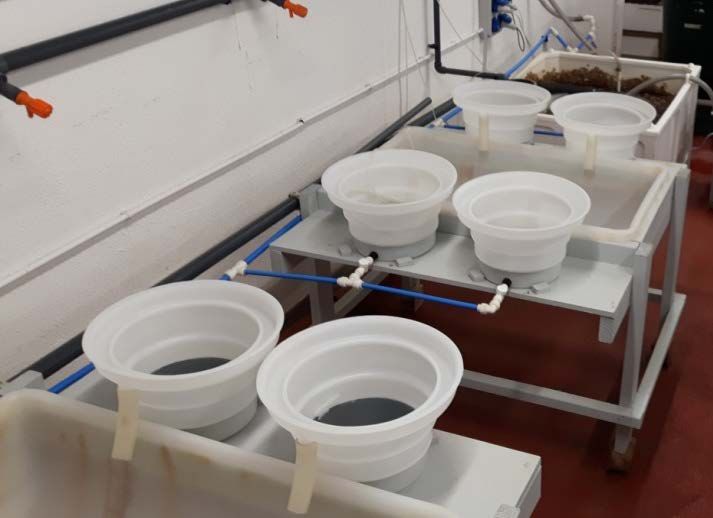
hatch, with the approximate time from hatch to sea transfer in lumpsucker varying from 5
to 8 months. This highlights the variable growth in lumpsucker and the further need to
optimise rearing strategies as well as any other husbandry methods that would facilitate
faster growth while maintaining high survival rates. From January – April 2016, the
remaining juveniles from the 2015 cohort were transferred to sea (see Table 1).

Table 1. Details of 2015 cohort hatchery reared juvenile lumpsucker transfers (date,
destination, #’s, mean weight) to sea in 2016.
                                       Mean                          Mean
                  DATE          #      Wt (g)      DATE       #      Wt (g)
                 14/1/16      2,212      12       29/3/16   2,072      31
                              2,730      19                 1,285      43
                              2,061      22                 1,462      41
                              2,448      23                 1,144      59
                              1,776      12                 2,270      29
                              2,991      13                 1,554      44
                              1,401      20                 1,623      42
                              1,806      22       19/4/16   1,333      37
                              2,155      21                 1,671      39
                              1,601      11                 2,068      36
                 18/3/16      1,200      56                 2,275      37
                              1,023      39                 1,092      40
                              1,186      39                 1,309      36
                                                            1,334      36
                                                            1,177      34
                                                            3,030      17
                  TOTAL      24,590                         26,699

Broodstock for 2016
In July and August 2014, juvenile lumpsucker were captured on seaweed longlines in Ventry
Bay, South West Ireland (ranging from 0.09 g – 15 g). These fish were on-reared at Carna
Research Station and were maintained as potential native Irish broodstock (see Figure 1 for
growth profile of these fish, error bars illustrates variation). The genetic makeup of these
fish is unknown, although fin clips have been taken to be included as part of a study on
population genetics of lumpsucker in the Atlantic Ocean. Some of these fish (2014 cohort, N
~17) became mature during the 2016 spawning season and produced viable eggs. A small
volume of eggs were fertilised by mature 2014 cohort males but very few males (~2)
became mature during the season, necessitating the use of wild caught mature males (see
below for information on spawning).

                                              3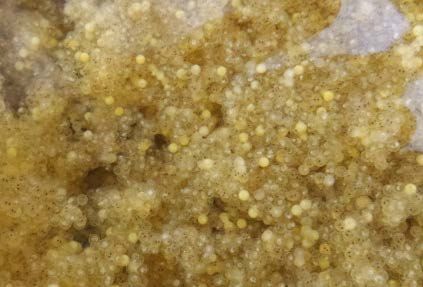
2000

                                 1750

                                 1500

               Mean Weight (g)   1250

                                 1000

                                 750

                                 500

                                 250

                                   0
                                    6/14         12/14      7/15          1/16    8/16        3/17
                                                                   Date

Figure 1. Growth profile (mean weight ± SD) of 2014 wild collected lumpsucker on-reared at
Carna Research Station. The dip in growth observed in August 2016 was due to the death of
several large fish. The remaining broodstock became infected with a fungus and were culled
in October 2016, with the largest fish recorded as 3.2kg.

 In December 2015, lumpsucker broodstock (N = 53) were imported from the UK. These fish
had undergone the mandatory health checks and all paperwork was in order prior to
transport. Initially fish grew well and acclimated to their holding tanks; however, by the end
of February 2016 it became clear that they had a fungal infection (different to the one
isolated from 2014 broodstock which occurred later in the year). All fish were inspected by
the designated veterinarian and in consultation it was deemed necessary to cull all
remaining fish. A thorough processing of the fish was carried out on March 1st 2016 with
samples taken by the Marine Institute for further analysis. Table 2 outlines some of the
information taken from these fish during the processing. Fish remains were disposed of
using a registered haulier, as is standard practice as per CRS’s Fish Health Management Plan.

Table 2. Information obtained from Swansea lumpsucker Broodstock including length,
weight, height, organ weights, sex and colour.
           Length                       Height     Weight    Total gut
   #        (cm)                         (cm)        (g)        (g)         Sex   Liver (g)   Gonad (g)
   1        33.3                         16.2       1701      251.38         F      64.04       66.19
   2        36.6                         18.0       2214      392.18         F     105.95      142.22
   3        32.0                         14.0       1336      239.63         M      50.54      109.94
   4        38.5                         19.1       2620      315.79         F      83.60      130.23
   5        36.7                         16.0       1775      604.95         F     130.32      334.43
   6        35.2                         16.9       1751      324.29         F      88.48       92.80

                                                            4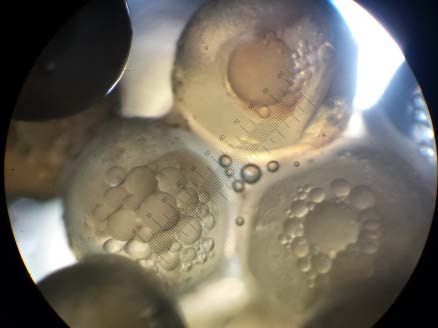
7    33.5    15.2   1674        335.46   F    88.30   132.98
  8    35.5    18.0   2307        504.37   F    91.12   299.72
  9    35.9    16.1   1885        338.91   F   101.54   120.37
 10    25.9    10.6    715        120.28   M    16.15    62.30
 11    36.6    16.0   1763        270.64   F    57.41    86.74
 12    34.3    15.2   1576        259.11   F    68.08    91.42
 13    35.6    16.9   1866        365.58   F    79.08   175.46
 14    35.3    15.8   1769        380.01   F    96.68   179.95
 15    30.0    14.2   1081        167.55   M    24.35    73.08
 16    30.6    13.0   1004        157.68   M    23.41    76.76
 17    30.0    14.0   1136        124.78   F    16.24    30.18
 18    34.8    16.8   2048        434.81   F    85.43   243.67
 19    35.3    17.2   2102        456.95   F   113.42   207.91
 20    27.4    11.1    830        137.44   M    31.83    48.83
 21    28.4    13.1   1035        107.30   F    26.86    12.52
 22    37.6    18.1   2323        168.93   F    39.57    63.27
 23    30.9    14.0   1343        411.05   F   108.12   150.53
 24    35.3    15.4   1675        288.66   F    72.96   110.79
 25    34.9    17.0   2095        419.77   F   109.61   196.57
 26    36.0    18.3   2380        460.08   F   129.72   161.56
 27    33.3    14.3   1283        231.83   F    57.11    80.61
 28    31.0    12.0    944        144.00   F    24.00    35.00
 29    39.0    18.0   2118        400.00   F   103.00   156.00
 30    28.0    11.0    652         91.00   M    18.00    34.00
 31    29.0    14.5   1077        155.00   M    15.00    65.00
 32    30.0    14.0   1275        200.00   F    42.00    48.00
 33    29.5    14.0   1093        139.20   F    24.85    49.20
 34    35.0    15.5   1639        290.15   F    68.71   128.13
 35    31.2    15.5   1476        221.89   M    33.53    78.88
 36    37.3    18.5   2210        333.99   F    88.11   125.01
 37    32.0    15.3   1443        238.52   F    57.25    68.74
 38    36.8    16.8   2067        437.52   F   100.37   238.65
 39    32.5    14.0   1277        202.57   M    36.05    93.43
 40    28.0    13.0    918        164.43   M    35.78    74.17
 41    35.5    18.0   2023        336.53   F    95.76   110.65
 42    33.6    14.8   1523        336.08   F    85.02   169.07
 43    36.0    16.0   1854        377.08   F    87.42   182.28
 44    30.3    12.5   1038        170.91   M    32.78    85.35
MEAN   33.3    15.3   1589        284.28        66.09   118.70
 SD     3.3     2.1    501        123.39        34.26    71.17
 CV    9.95   13.93   31.53        43.41        51.84    59.96

                              5
In addition, two batches of Irish eggs were incubated, on-reared and a selection (N ~100)
maintained as a broodstock source from the 2015 cohort (Figure 2). These fish will start to
mature in the 2017 spawning season and were an average of 5-600 g at the end of
September. The number of these fish has been reduced due to an outbreak of amoebic gill
disease (AGD) but mortalities are currently negligible and treatment (freshwater baths) was
undertaken to reduce the problem. If AGD had progressed too far, fish did not tolerate the
freshwater baths; however, on the whole, the treatments worked well. They did require
several treatments over the summer months to keep AGD at bay.

                            800

                            700

                            600
          Mean Weight (g)

                            500

                            400

                            300

                            200

                            100

                             0
                              1/16   3/16   5/16   6/16   8/16   10/16   11/16
                                                   Date

Figure 2. Growth profile (mean weight ± SD) of 2015 Irish lumpsucker broodstock, hatched
in Carna Research Station. A proportion of this population will spawn for the first time in
2017.

Systems
All tanks and systems (egg cones, recirculation units, larval/juvenile tanks and on-rearing
tanks) were prepared for the upcoming larval run during the first 3 months of 2016. This
included thorough cleaning and disinfection of tanks, ensuring oxygen diffusers were
operating sufficiently, cleaning and disinfection of standpipes, additional standpipes
produced if required etc. A new incubation system (Figure 3) was set up and tested with
cones purchased by a salmon producer (12 L Sterner Family Hatcher units). These were set
up on a small recirculation system which included a sump (490L capacity) containing actively
aerated biomedia, two holding tanks (150 L capacity each), a heater/chiller unit (to maintain

                                                    6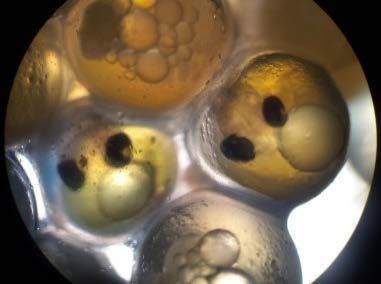
a constant temperature throughout the incubation), a small UV filter and a sock filter (50
µm). This system was topped up with incoming ambient seawater at
•   2 fertilised egg batches (2 different crosses)

          •   0.5 kg total biomass of eggs
          •   20-29% hatch rate (25% average)
          •   Fertilised ova imported from Norway May 12th 2016
          •   5 egg masses
          •
14 23/04/2016 0.546 Donegal Donegal 70.72
15 25/04/2016 0.497 Donegal Donegal 92.40
16* 22/04/2016 1.185 Norway Norway Very poor batch
17* 22/04/2016 1.130 Norway Norway Very poor batch
48.38**
18 22/04/2016 0.970 Norway Norway
19 22/04/2016 0.990 Norway Norway
20 22/04/2016 1.195 Norway Norway 67.94
21 26/04/2016 0.160 Ventry Ventry 24.08 Final egg mass
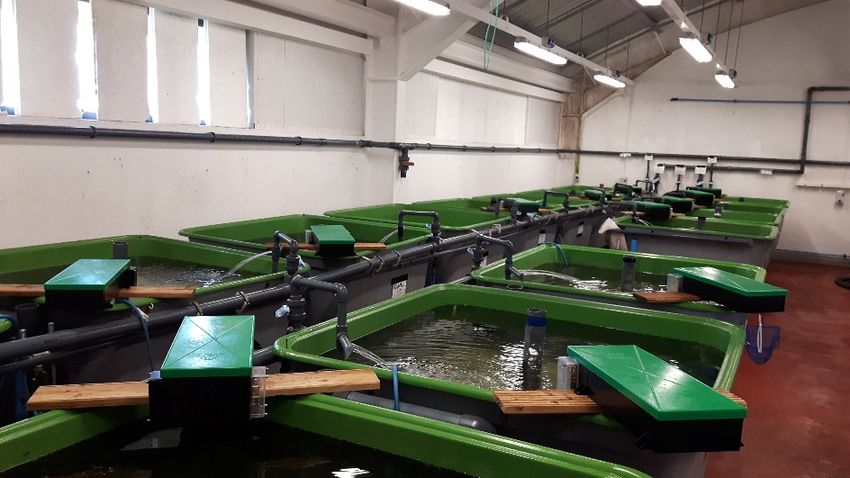
*very poor hatch rate (• When disinfected, a large amount of oil appeared on surface of water (from yolk
sacs) and water became cloudy
• Eggs were ‘soft’ and broke apart easily when handled
• Some eyed ova, which appeared normal
Figures 4 a - c. Lumpsucker egg batch 16 showing many discoloured dead eggs (a),
microscopic view of undeveloped eggs (b) and normally developing eyed ova (c).
Batch 17 (Figures 5 a & b)
• No mucous during handling
• Many dead eggs but less than Batch A, more eyed ova evident
• When disinfected a large amount of oil appeared on surface of water (from yolk
sacs) and water became cloudy
• Eggs ‘soft’ and broke apart easily
• Noticed more ‘debris’ on eggs compared to other batches
Figure 5 a and b. Lumpsucker egg batch 17 showing discoloured dead eggs (a) and
microscopic view of both undeveloped and normally developing eyed ova (b).
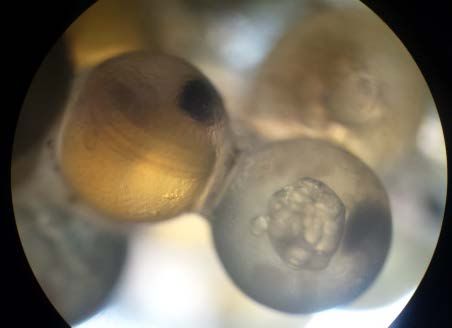
Batches 18 – 20 (Figures 6 a - c)
• All batches of better quality than A & B with more eyed ova and less dead eggs
• Better ‘feel’ to the eggs, less mucous
• Water did not turn cloudy during disinfection and no oil droplets on surface
• Easy to see larval blood pumping and movement
10Figure 6 a - c. General photos for lumpsucker egg batches 18, 19 and 20 showing normally
developed eggs with few dead discoloured ova (a) and microscopic views of both
undeveloped and normally developing eyed ova (b & c).
Table 3 provides summary data on all Norwegian lumpsucker egg batches at Carna Research
Station in May 2016. The two poor egg batches had the lowest hatch rate.
Table 3. Summary information on all lumpsucker egg batches from Norway, including total
weight and hatch rate.
Batch 16 17 18 19 20
Total Weight (g) 1185 1130 970 990 1195
% Hatch 50% of the Norwegian population was stillbetween these two stocks in 2015 (different hatch dates). The smallest fish (Norwegian
stock) are currently at 6 months old, having hatched at the end of May.
1.20
UK 15
IR 15
1.00
NOR 15
2016
0.80
Mean Wts
0.60
0.40
0.20
0.00
0 10 20 30 40 50 60 70 80 90 100 110
DPH
Figure 7. Growth profiles for 4 different lumpsucker populations from hatch to 100 days
post hatch (DPH). The green line denoted 2016 refers to the Norwegian stock. These fish
were more highly stocked than all other cohorts graphed, particularly compared to the
yellow line (Irish 2015 cohort) which had relatively few fish per tank. (Norwegian 2015: 20
fish per L, Irish 2015: 9 fish per L, UK 2015: 9 fish per L, Norwegian 2016: 37 fish per L)
A temperature controlled recirculation system (see above) was used during egg incubation
and thus the temperatures experienced by the various egg batches were set during this
period and were maintained at approximately 9°C. However, it is clear in Figure 8 that
batches 16-20 experienced lower incubation temperatures than all of the other batches.
This is due to the fact that these eggs (Norwegian in origin) were incubated for
approximately 3 weeks at 7°C in Norway prior to transfer to Carna. This could have
contributed to their reduced growth rate along with high stocking densities. The higher
stocking densities (see Table 4) are the biggest contributors to the reduced growth in 2016.
12400
1
350 2
5
300 6
7
250
8
Degree Days (°C)
14
200
15
16_20
150
100
50
0
0 5 10 15 20 25 30 35 40
Days Post Fertilisation
Figure 8. Degree days from spawning until Day 0 (hatch) for all lumpsucker egg batches
incubated at Carna Research Station in 2016
13Table 4. Stocking densities, origin and hatch date of newly hatched lumpsuckers in first
rearing tanks at Carna Research Station in 2016. First rearing tanks are 440 L capacity.
Stocking Density
Hatch Date Origin
(fish/L)
29/3 Irish 22
7/4 Irish 28
18/4 Irish 24
24/4 Irish 15
30/4 Irish 24
7/5 Irish 12
27-28/5 Irish and Norwegian 15-53
1/6 Irish 9
Due to their fast growth rates and the rapid development of size hierarchies within a
population, lumpsucker must be graded relatively regularly (e.g. every 2 - 3 weeks
depending on size). This helps to reduce aggressive encounters and serves to split
biomasses across tanks.
Due to the frequency of grading it is difficult to track a particular group of fish through from
hatch to sea transfer. Figures 10 a and b illustrate the variability in size at age for a
population of lumpsucker. It is clear from both graphs that there is a smaller grade that
persists and these fish will take significantly longer than their siblings to reach transfer size.
1412.00 1 2
3 3a
4 4a
10.00 4b 5
6 6a
6b 7
1N 2N
8.00 2Na 2Nb
3N 3Na
Weight (g)
4N 4Na
5N 5Na
6.00 6N 7N
8N 9N
4.00
2.00
0.00
0 50 100 150 200 250
Days Post Hatch
25.0
Larger y = 7E-05x2.059 R² = 0.1471
Smaller y = 0.0003x1.5446 R² = 0.5401
20.0
15.0
Mean Weight (g)
10.0
5.0
0.0
0 50 100 150 200 250
-5.0
Days Post Hatch
Figures 10 a and b. Mean weight versus days post hatch for all tanks of lumpsucker reared
in 2016. Top graph shows information by tank, where possible to track a tank over several
sampling periods (ie prior to grading). The bottom graph shows the mean weights for
individual tanks (small grades indicated by orange triangles).
15Finally, if we take the mean weights for tanks that are deemed as ‘large’ versus ‘small’
grades, we see the growth curves observed in Figure 11. The variation in sizes is evident
from the error bars associated with the ‘large’ grade of fish from approximately 120 days
post hatch. The error associated with the smaller grade is much reduced because these fish
are constantly being graded out of the tanks and thus the numbers in these tanks are
steadily being reduced. Lumpsucker grow relatively steadily and uniformly (given adequate
feed and space and an optimum temperature) until they reach approximately 1 - 3 g, at
which point, growth rate increases and we start to see larger and larger variations in sizes
(hence the frequent grading required).
20
18 Small
16 Large
14
Mean Weight (g)
12
10
8
6
4
2
0
0 50 100 150 200 250
Days Post Hatch
Figure 11. Growth (mean weight ± SD) profiles of all tanks combined (with tanks designated
as either ‘large’ (= faster growing fish) or ‘small’ (= slower growing fish)) for lumpsucker
reared at Carna Research Station in 2016
Vaccination and Sea Transfer
Prior to sea transfer, fish are dip vaccinated twice at CRS and for their first dip fish must be a
minimum of 1 g. In addition, there should be 300° days (time dependent on temperature:
30 days @10° C) between the second dip and sea transfer. The vaccine is used as follows: 1
L vaccine plus 9 L sea water to make a 10 L bath. This will vaccinate 10,000 fish @1 g or 50
kg of bigger fish. Thus, there must be a minimum of 10,000 1 g fish to ensure that a bath of
16at least 10 L is used, anything less is too little water and will cause undue stress. The bath
must be kept constantly oxygenated.
To date >38,000 fish have been transferred to sea (Table 4), with a further ~12,000 to be
transferred on 20th December. As of December 2016 there were approximately 200,000 fish
on site, equivalent to 376 kg of biomass. The following table (Table 5 – all fish accounted for
including those transferred or awaiting transfer) outlines the current numbers, sizes and
vaccination status of the stock being reared in Carna. Times for vaccination and sea transfer
are approximate. As fish are moved to sea and stocks graded and redistributed, growth will
improve (depending on temperature). Sea transfer may be to ongrowing cages (>5 g
average), smolt nets (>10 g average) or broodstock cages (>20 - 25 g average).
Table 4. Details of fish transfer in November and December, including date, numbers and
mean weight.
Date # Wt (g)
2/11/16 240 7
9/11/16 1209 19
2578 21
1344 25
3867 9
4845 6
3849 9
3918 10
9/12/16 2550 18
14/12/16 13994 7
TOTAL 38394
Table 5. Overview of current lumpsucker stocks being held at Carna Research Station
2nd dip
st
# fish Average Size 1 dip Sea Transfer
(+ 3 weeks)
5,131 >20g Yes Yes 9th Nov
16,479 >5g Yes Yes 9th Nov
2,550 >15g Yes Yes 9th Dec
13,994 >5g Yes Yes 14th Dec
11,865 10g Yes Yes 20th Dec
50,019
1735,000 2g+ Yes Jan
35,511 1g+ Yes Jan-Feb
131,000 1g Feb-Apr
201,511
Lessons Learned in 2016
Growth was inhibited in the youngest fish due to the high stocking densities, despite
improved feeding strategies. Future strategies will focus on the use of additional surface
area and ‘skimming’ larger fish out of tanks at smaller sizes to reduce density dependent
effects on growth. This will also facilitate vaccination but this requires a minimum of 10,000
fish to be carried out effectively (see above). Ideally, regular ‘skimming’ of tanks every few
weeks should provide a more consistent and staggered production (potentially smaller
numbers in each batch), rather than having larger numbers of fish ready but with longer
periods of time between each batch. It was not possible to alleviate the stocking densities
by simply splitting fish into additional tanks as no additional tanks were available. A study
looking at the effects of stocking density on growth over a 6 week period revealed little
difference in growth over a 10 fold difference in stocking density. These data are still being
analysed and thus are not presented here. This highlights that for short term periods, high
stocking density is tolerated but clearly (based on our production tanks), prolonged periods
at high densities does effect growth.
Improvements over 2015
A greater hatch rate was achieved in 2016 (ranging from 20-92%, based on 100,000 eggs per
kg) compared to 2015 (~20% estimated but no counts done). This was highly dependent on
egg source with eggs from the 2014 Carna broodstock females having the lowest hatch rate
(20-44%). These fish were not on a conditioning diet or photoperiod and were first-time
spawners. The highest hatch rate was observed in two batches from Donegal wild
broodstock with 70 and 92% hatch rate estimated. The good batches received from Norway
(18 -20) had hatch rates of 48 – 68% and this is thought to have been affected by the delay
in transport. Clearly, native, wild broodstock yielded the best quality and survival of eggs in
2016. Survival of juveniles was also greater in 2016 and tail nipping, which was a major
problem in 2015, was almost non-existent. The installation of belt feeders (Figure 12)
improved rearing and enabled greater use of time for optimising other husbandry
procedures (e.g. grading, cleaning). A more rigid feeding schedule was employed in 2016,
with strict weaning periods and well established times for moving onto larger feed.
Recently, a new feed size/type has been released by Otohime, called S1. This diet is 1 mm
average and readily replaces the C1 diet (840 – 1400 µm). Switching from C1 to S1 has
18made a significant difference to the cleanliness of the tanks, with C1 (more like a crumb than a pellet) decomposing more rapidly (either as waste faeces or excess feed) than S1. Figure 12. Belt feeders installed over larval/juvenile lumpsucker tanks in Lab 2 at Carna Research Station. Another improvement is the ability to take out fish >5 g (but
You can also read