Work Analysis of Maritime Passenger Terminals for Particular Region Based on Circos Plot Analiza rada pomorskih putničkih terminala za određenu ...
←
→
Page content transcription
If your browser does not render page correctly, please read the page content below
Work Analysis of Maritime Passenger Terminals for
 Particular Region Based on Circos Plot
 Analiza rada pomorskih putničkih terminala za određenu
 regiju na temelju kružnog grafikona

 Srećko Krile                        N. N. Maiorov
 University of Dubrovnik             Saint-Petersburg State University of
 Electric Engineering and            Aerospace Instrumentation
 Computing Department                Department of system analysis and logistics
 e-mail: srecko.krile@unidu.hr       Saint-Petersburg, Russia                                           DOI 10.17818/NM/2019/2.2
                                     e-mail: nmsoft@yandex.ru                                           UDK 656.615
                                                                                                             627.029
                                                                                                        Original scientific paper / Izvorni znanstveni rad
                                                                                                        Paper accepted / Rukopis primljen: 4. 3. 2019.
 Summary
 In terms of a systematic approach, till now it was not possible to investigate separately                KEY WORDS
 sea passenger terminals and the operation of ferry or cruise lines. So it is necessary to
                                                                                                          transport hub
 investigate their mutual influence, analyze the intensities, take into account the influence
                                                                                                          marine passenger terminal
 of the external environment and solve forecasting problems. This circumstance justifies
                                                                                                          passenger traffic
 the need to use new tools and models that allow analyzing the macro-level, consisting of
                                                                                                          ferry line
 all the ports in the region and the available ferry lines. For solving short-term forecasting
                                                                                                          circos plot
 problems, the class of polynomial problems has recommended as well. But, when taking
                                                                                                          traffic intensity
 into account the mutual influence of the terminals and ferry lines on each other, the task
 becomes much more complicated. The discrete nature of the initial data, schedules of ship
 calls which need to be combined into a single array of data, comes to the fore in the study
 of processes. The process of functioning of an individual terminal with varying degrees of
 accuracy can be represented as a sequence of several typical design modes, each of which
 corresponds to a change in a certain set of characteristics and number of ship calls. But
 when solving problems at the macro-level, the article proposes to use optimization based
 on the circos plot. The construction of this type of diagram is associated with the fulfillment
 of certain boundary conditions, which makes it possible to define the boundaries of the
 region, to study and to form the completeness of the initial data. The object of the study
 is the interconnection of selected marine passenger terminals and the existing ferry lines.
 Based on the initial data, transformations were carried out and a circular (circos) plot of
 relations was constructed. Such diagram takes into account the analysis of the mutual
 influence of the terminals of one region. The obtained results make it possible to improve
 the quality of decision making, since a representation of the macro-level planning system
 of the «marine passenger terminals - ferry lines» is formed within the framework of the
 selected marine region.

 Sažetak
 Gledajući sustavno, dosad je bilo nemoguće posebno promatrati putničke terminale i                       KLJUČNE RIJEČI
 aktivnosti trajektnih i brodskih linija. Potrebno je istražiti njihov međusobni utjecaj, analizirati
                                                                                                          prometno čvorište
 intenzitete, uzeti u obzir utjecaj vanjskog okruženja i riješiti probleme predviđanja. Ova
                                                                                                          pomorski putnički terminal
 okolnost opravdava potrebu za korištenjem novih alata i modela koji omogućuju analizu
                                                                                                          putnički promet
 makro-razine, što obuhvaća sve luke u regiji i dostupne trajektne linije. Za rješavanje
                                                                                                          trajektna linija
 problema kratkoročnog prognoziranja, klasa polinomijalnog računa se također preporuča.
                                                                                                          strukturni kružni grafikon
 Međutim, uzimajući u obzir međusobni utjecaj terminala i trajektnih linija jednih na druge,
                                                                                                          prometni intenzitet
 zadatak postaje mnogo složeniji. Diskretna priroda ulaznih podataka, rasporedi ticanja
 brodova, koje je potrebno kombinirati u jedinstven niz podataka, dovodi do problema pri
 takvom istraživanju. Proces funkcioniranja za pojedini terminal s različitim stupnjem točnosti,
 može se prikazati kao niz tipičnih načina modeliranja, od kojih svaki odgovara promjeni u
 određenom skupu karakteristika i učestalosti ticanja brodova. Pri rješavanju problema na
 makro-razini, članak predlaže korištenje strukturnog kružnog grafikona. Konstrukcija ovog
 grafikona povezana je s ispunjenjem određenih rubnih uvjeta, što omogućuje definiranje
 granica regije, proučavanje i oblikovanje cjelovitosti početnih podataka. Cilj istraživanja su
 odabrani brodski terminali i postojeće trajektne linije. Na temelju početnih podataka izvršene
 su transformacije i konstruiran je kružni grafikon njihovih odnosa. Takav grafikon uzima u
 obzir analizu međusobnog utjecaja terminala. Dobiveni rezultati omogućuju poboljšanje
 kvalitete odlučivanja, pošto se u okviru odabrane morske regije formira sustav planiranja
 makro-razine «pomorskih putničkih terminala - trajektnih linija».

“Naše more” 66(2)/2019., pp. 57-61                                                                                                                           57
1. INTRODUCTION / Uvod                                                with Italy and nearest countries. The major Croatian passenger
     Modern processes in the economy directly affect the                   (cruise and ferry) ports are Split, Zadar, Rijeka, Šibenik and
     development and changes of seaports, terminals and transport          Dubrovnik. Dubrovnik is an Adriatic Sea cruise port and city in
     systems. It should be noted that any marine passenger terminal        Croatia, and one of Europe’s historically most prominent and
     has historically been formed and operates under the influence         popular vacation travel destinations. According to the statistical
     of a certain set of unique factors that determine the uniqueness      data from EUROSTAT [4], given in table 1, there is a significant
     of the port today. In view of the introduction of new intelligent     increase in passengers transported to/from main ports of
     systems in transport, the introduction of vehicle traffic             Croatia in quarterly data.
     monitoring systems, the tendency to increase the size of cruise            Ferries in Baltic Sea, passenger shipping on the serve as the
     ships, and a number of others, modern requirements for the            backbone elements of the Baltic transnational macro-region
     operation of marine passenger terminals are increasing. Also,         [5,6,7]. By the Baltic macro-region, we will mean an integrated
     decision time is shorter and shorter. It is under the influence       international region that includes the entire set of economic
     of changes in the external environment, often serving as a            activities and represents a network model of cooperation with
     stimulus, that the process of updating the infrastructure of          the presence of both horizontal and vertical links, with the
     passenger terminals and launching mechanisms to attract new           efforts of 52 seaports out of 184, providing services for both
     ferry and cruise lines to the port begins.                            cruise and ferry transportation of passengers. At the same time,
          The key conditions for the stable operation of the port is the   it is possible to note a tendency towards a change in interests
     growth of the tourist attractiveness of the region, an increase in    among tourists, caused by an increase in interest in the cultural
     the passenger traffic and attendant cargo traffic between the         layer of the northern countries. Over the past three years, there
     ports and, as a result, an increase in the intensity of cruise and    has been a significant increase in cruise lines that the ports of
     ferry ship calls. The port infrastructure should be able to handle    the Baltic Sea are added to their routes. The article [8] presents
     the input flow of ships without failures and possible delays.         the solution of the routing problem for cruise and ferry lines and
     Therefore, in this vein, the task of operational forecasting the      presents a methodological analysis of possible changes.
     number of cruise ships and estimating congestion is extremely              For such regions, any actions or new transport decisions
     important.                                                            taken in one country or region can very quickly affect the
          In the articles [1,2,3] mathematical models for forecasting      development of other territories or the region as a whole, both
     are presented and on their basis the task of forecasting              positively and negatively. Due to the close relationship with
     the intensity of cruise and ferry ships for 2018-2019 for the         other passenger ports, it is necessary to have a toolkit that
     Passenger Port of Saint Petersburg “Marine Facade” is solved.         would allow the results to be associated with data from other
     The presented realized task in the class of polynomial models         ports and to determine the mutual influence.
     and the conditions for achieving prediction accuracy can be
     used at any desired forecast interval. In case of changing the        2. RESEARCH MODEL FOR PASSENGERS PORTS
     parameters of the environment, it is necessary to recalculate. At     AND TERMINALS / Model za istraživanje sustava
     the same time, the obtained dependencies contain information          Putničke luke i terminali
     on the basis of which only a specific specified passenger             Perform a representation of the model of the interaction of
     terminal can be evaluated.                                            terminals in the form of a fig.1
          The class of problems of forecasting polynomial models               On figure 1 X(t) represents the dynamic behavior of the
     does not allow to investigate the mutual influence of terminals       passenger traffic, which enters the passenger terminal system.
     and passenger and ports of the region on each other. This             Each region has a limited set of passenger terminals (Y(N)).
     question is extremely interesting when studying the situation         Ferry lines are organized between the terminal system both on
     of competition in the market for passenger traffic and cargo          a regular basis and seasonally.
     traffic. This task is relevant for the regions of the Adriatic and        To solve the problem of studying the work of the «marine
     Baltic Seas. Due to the proximity of the ports and terminals in       passenger terminal - ferry line» system, it is necessary to
     the border countries and the proximity of various cultural and        introduce the following restrictions:
     historical sites, the uniqueness of these sea regions is revealed.    1. Of the many ports in the region, only passenger terminals
          Ferries in Croatia connect the Croatian coast with all               are selected and the terminals are ranked by intensive ship
     inhabited islands. Ferries to Croatia connect Croatian ports              calls;

                    Table 1 Passengers transported to/from main ports - Croatia - quarterly data (in thousand passengers)
                          Tablica 1. Prevezeni putnici između glavnih luka u Hrvatskoj (kvartalno – u tisućama putnika)
            Ports      2016/Q3     2016/Q4    2017/Q1      2017/Q2     2017/Q3 2017/Q4 2018/Q1            2018/Q2        2018/Q3         2018/Q4
        Dubrovnik            691        103         38           357         777    117      30                374            827             130
        Poreč                150         10          0            56         160     11       0                 58            157              14
        Preko                706        328        294           451         724    324     283                451            737             323
        Pula                 242         55         20           168         231     58      21                173            248              62
        Rovinj                29          3 :                     10          38      1 :                       17             59               4
        Šibenik              286         60         37           139         286     60      34                154            276              62
        Split              2 170        594        441         1 117       2 190    591     445              1 212          2 369             625
        Zadar                918        378        333           542         960    372     322                551            980             375

58                                                                                               S. Krile and N. N. Maiorov: Work Analysis of Maritime....
Figure 1 Representation of the interaction of the systems «Terminal-ferry line»
Slika 1. Prezentacija interakcije u sustavu Terminal - trajektna linija”
2. when considering the statistics of each port operation, data does not allow to analyze the entire system in a complex at
taken at a close time is selected and this discrete state is the macro-level, in this case, taking into account the selected
selected as the main one at T0; passenger terminals. This approach allows you to use system
3. source terminals form two data arrays: dynamics as a method for studying the behavior of the system.
- the first array is one-dimensional and consists of passenger System dynamics is a set of principles and methods for analyzing
terminals n (example based on the ports of the Baltic region dynamic controlled systems with feedback and their application
(St. Petersburg, Copenhagen and others)) for solving technical problems based on a flowchart. But system
dynamics can be used only in the study of the interaction of two
{
Fpass.ter min al ( N i ) = FHelsingborg ; FElsinore (Helsing) ; FSt. Petersburg ;...; FCopenhagen } (1) terminals.
On the other hand, the pie chart is a tool based on the
where FSt. Petersburg - number of calls at the port; N – number of definition of logical relationships between the various data of
passenger terminals in the region. an existing system. As a rule, the relationship diagram is used in
- the second array is a two-dimensional array, the elements conjunction with the affinity diagram, since allows you to build
of which reflect the intensities of ferry or cruise ships between the causes identified with its help in a logical chain. In turn,
specified ports at a selected discrete point in time. In practice, the affinity diagram is intended for grouping and organizing a
the values of both direct and reverse routes are entered. large amount of source data. Grouping occurs on the principle
of uniformity of information. In our case, this diagram is already
(2) determined by a one-dimensional array of existing passenger
terminals and the presence of the existing route network at the
selected discrete point in time.
where is Fi - port of departure; Fj - port of destination; With this approach, with diagram of port interaction (circos
N ( FSt. Petersburg , FHelsingborg ) - the numerical value of the intensity plot), we provide a structured approach to the analysis of
of ships at a given discrete point in time between passenger complex interactions between passenger terminals, which is
terminals. its significant strength. At the same time, the diagram on its
4. cruise and ferry intensities are taken at a selected time T0. elements allows placing additional analytical information (Fig. 2),
When deciding to predict any cruise ship call at the port e.g. work intensity, workload, possible failures and other quality
belongs to the full group of events. indicators for the terminal, school and other percentage data. The
main element of the diagram is a circle, which cyclically combines
(3)
other elements. In the case of two directions between passenger
Based on the formation of the conditions for the full group ports, but having different intensities, a single arc, which displays
of events, the boundaries of the sample are determined. both directions, is introduced.
For Baltic region, based on the analysis of the intensity
of calls to passenger ports, the following terminals, as most
significant, can be distinguished: Helsingborg, Elsinore
(Helsingør), Helsinki, Stockholm, Puttgarden / Fehmarn, Tallinn,
Turku, Mariehamn, St. Petersburg, Rostock, Gothenburg, Ystad,
Trelleborg, Kiel, Copenhagen and several others. For Croatian
region the following terminals, as most significant, can be
distinguished: Dubrovnik, Preko, Split, Zadar, Pula.
3. MODEL IN THE FORM OF THE CIRCULAR
RELATIONSHIP DIAGRAM FOR SYSTEM OF
PASSENGER TERMINALS IN THE REGION / Model
prikaza uz pomoć kružnog grafikona za sustav
putničkih terminala u regiji
When the above conditions are met, the possibility of practical
construction of circular diagrams of relations opens up. When
performing an analysis of the intensity of the transport system Figure 2. Circos plot introduces interaction between ports for
or the workload of nodes, the functionality is widely used, most the study of marine passenger terminals
often presented in graphical or tabular form or, more rarely, in Slika 2. Interakcjijski kružni grafikon za istraživanje pomorskih
the form of two-factor (multi-factor) functions. But this approach putničkih terminala
“Naše more” 66(2)/2019., pp. 57-61 59Based on the application of these diagrams, it is possible
at a qualitatively new level to present the interaction of the
«maritime passenger terminal - cruise / ferry line» systems. When
changing data over time, we can establish mutual influence on
other passenger ports in the Adriatic and Baltic regions.
4. PRACTICAL USE OF CIRCULAR DIAGRAM
(CIRCOS PLOT) FOR THE SYSTEM OF MARINE
PASSENGER TERMINALS
Način prikaza kružnim grafikonom međusobnih
odnosa pomorskih putničkih terminala
For the Baltic and Adriatic regions, we select the ferry traffic
intensity from 11 to 17 February 2019 as the time interval for the
research [9,10]. Of course, the time interval can vary, depending
on the objectives of the study. Baseline data is selected from
the cruise ship and ferry vessel call schedules that are publicly
available. Based on the selected interval, ferry destinations
between the Baltic Sea countries were compiled, as shown
in Table 2 and Table 3. For Croatian terminals input data was
selected from the schedules of ferry companies and according Figure 3. Graph representation of ferry traffic intensities
to resources [11]. One interesting research for time schedule of between selected ports of the Baltic Sea
small ferry destinations can be seen in light of “smart islands” Slika 3 Grafički prikaz intenziteta trajektnog prometa između
initiative [14]. odabranih luka Baltičkog mora
Table 2 Intensities of ferry ships in the Baltic Sea
Tablica 2. Intenzitet trajektnih linija u Baltičkom moru
Passengers Helsinki Stockholm St. Petersburg Tallinn
terminals
Tallinn 15 3 0 0
Helsinki 0 3 2 14
Stockholm 3 0 0 2
St. Petersburg 2 0 0 1
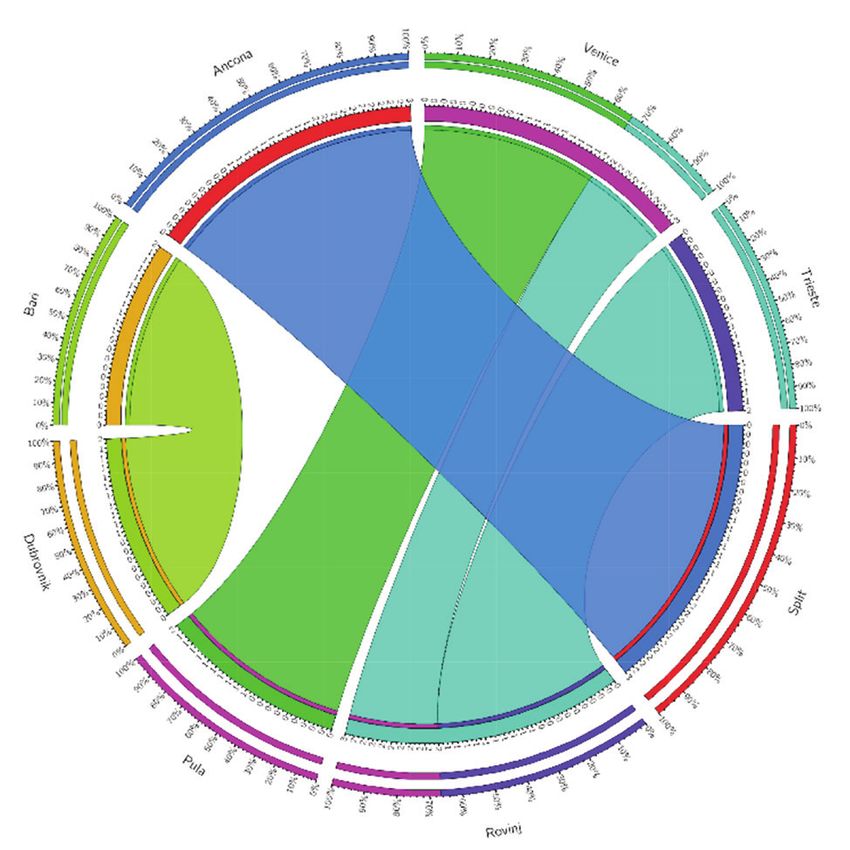
Table 3 Intensities of ferry ships in the Adriatic Sea
Tablica 3. Intenzitet trajektnih linija u Jadranskom moru
Passengers Bari Venice Trieste Ancona
terminals
Dubrovnik 2 0 0 0
Pula 0 2 0 0
Rovinj 0 1 2 0
Split 0 0 0 3
The presented intensity values define the full group of
events. New dynamic data in the system will not be added. The
original tabular data is converted into a matrix form [12,13] and Figure 4. Graph representation of ferry traffic intensities
the result is the desired annular diagram of relations with regard between selected ports of the Adriatic Sea
to the analysis of the shares of routes in the directions (Fig. 3,4). Slika 4. Grafički prikaz intenziteta trajektnog prometa između
Based on the initial data, a specialized file is generated that is odabranih luka Jadranskog mora
loaded into the instrumental environment of circus.
The graph representation also contains analytical
information on the mutual influence of ports, presented in the
form of corresponding circular scales. This analytical material
makes it possible to predict decision making already at the
macro-level of planning, since it also provides information on
the mutual influence of terminals. As a result, the use of circular
diagram (circos plot) makes it possible at the macro-level to
investigate the operation of the «maritime passenger terminal
- ferry line» system.
60 S. Krile and N. N. Maiorov: Work Analysis of Maritime....5. CONCLUSION / Zaključak REFERENCES / Literatura
Based on the need for a comprehensive study of the operation [1] Maiorov, N. N., Fetisov, V. A. Improvement of the quality of the sea passenger
terminal based on methods of forecasting. Our sea. 2018. Vol 65. No. 3. P. 135-
of marine passenger terminals, and analysis of their mutual 140
influence, the need to use circular diagrams (circos plot) [2] Krile, S., Maiorov N., Fetisov V., Forecasting the operational activities of the sea
for representation of traffic influence between ports is passenger terminal using intelligent technologies, Transport Problems, 2018
Vol.13 (Issue 1), pp. 27-36. DOI: 10.21307/tp.2018.13.1.3
substantiated. To obtain the correct simulation results, it is
[3] Yan, S., Chen, H. C., Chen, Y. H. & Lou, T. C. Optimal scheduling model for ferry
necessary to fulfill a number of conditions and limitations. When companies under alliances. Journal of Marine Science and Technology. 2007.
forming the source data, the discrete approach is justified. All Vol 15. No 1. PP. 53–66.
available data should form a complete group of events that fully [4] Passengers transported to/from main ports - Croatia - quarterly data. Available
at: http://appsso.eurostat.ec.europa.eu/nui/show.do?dataset=mar_pa_qm_
describe the interaction of the “maritime passenger terminal hr&lang=en (accessed 11 February 2019)
- ferry line” at a selected discrete point in time. The range of [5] Mezhevich N. M. Baltijskij region i Rossiya na Baltike: specifika pozicionirovaniya
tasks for the macro-level study of sea port systems has been [Baltic region and Russia in the Baltic: positioning specifics ] Available at:
https://www.ut.ee/ABVKeskus/sisu/publikatsioonid/2004/pdf/VF-B.pdf
substantiated. The features of circular diagrams of connections,
(accessed 15.11.2018)
their positive and negative sides are considered. Based on the [6] Baltic Port list 2006. Annual cargo statistic of ports in the Baltic Sea region/ A
initial data, a truncated terminal sample was formed (“Passenger publication from the center for maritime studies university of Turku: — Turku,
Port St. Petersburg“, passenger terminals of Tallinn, Stockholm 2012. 120 p.
[7] Baltic Port Barometer 2012 Available at: http://www.sadamateliit.ee/avalik-
and Helsinki and for Adriatic region Dubrovnik terminal, Split, teave/Baltic-Port-Barometer-2012 (accessed 15.11.2018)
Pula, Rovinj). Taking into account the actual intensity of ferry [8] Chládek, P., Smetanová, D., Krile, S., On some aspects of graph theory
traffic, the matrix form of the initial data presentation was for optimal transport among marine ports. Scientific Journal of Silesian
University of Technology. Series Transport .m 2018 Vol. 101, pp. 37-45. DOI:
implemented and then the required circular diagram (circos
10.20858/sjsutst.2018.101.4.
plot) was constructed, which will assess the mutual influence [9] Directferries.com Available at: https://www.directferries.com/routes.htm
of the passenger terminals. The proposed study approach can (accessed 11.02.2019).
be used for any number of passenger terminals and the model [10] HELCOM.fi. Available at: http://maps.helcom.fi/website/AISexplorer/
(accessed 11.02.2019).
can be scaled. When a system is formed from data diagrams
[11] PORTDUBROVNIK.HR. Available at: http://portdubrovnik.hr/statistika/?id
built over a selected time interval, it is possible to justify system Kat=1&godina=2018 (accessed 11.02.2019).
changes, which cannot be determined by working technique [12] Wang J. M. The study and analysis of model algorithm for dynamic origin-
with separate tables. The result should be used in conjunction destination matrix estimation and prediction. Ningxia Engineering
Technology. 2002. Vol. 1. No. 4. PP. 362–365.
with forecasting in the class of polynomial models, thereby
[13] Circos. Available at: https://sourceforge.net/projects/jcircos/ (accessed
enhancing the solution for the problem of providing the 11.02.2019).
necessary port capacity and reasonable modernization of the [14] Krile, S., Mišković, D., Optimal Use of Container Ships for Servicing Among
infrastructure of sea passenger ports and terminals. Small Ports, Naše more (Our Sea), 2018 Vol. 65, No 1, pp.18-23, DOI: 10.17818/
NM/2018/1.3
“Naše more” 66(2)/2019., pp. 57-61 61You can also read