Mathematical and Computer Modelling
←
→
Page content transcription
If your browser does not render page correctly, please read the page content below
Mathematical and Computer Modelling 51 (2010) 1306–1311

                                                         Contents lists available at ScienceDirect

                                       Mathematical and Computer Modelling
                                                  journal homepage: www.elsevier.com/locate/mcm

Characterizing variations in soil particle size distribution in oasis
farmlands—A case study of the Cele Oasis
Dongwei Gui a,b,c , Jiaqiang Lei a,c,∗ , Fanjiang Zeng a,c , Guijin Mu a,c , Juntao Zhu a,b,c ,
Hui Wang a,b,c , Qiang Zhang a,b,d
a
    Xinjiang Institute of Ecology and Geography, CAS, Urumqi, Xinjiang, 830011, China
b
    Graduate School of the CAS, Beijing, 10039, China
c
    Cele National Station of Observation & Research for Desert-Grassland Ecosystem in Xinjiang, Cele, Xinjiang, 848300, China
d
    Institute of Botany, The Chinese Academy of Sciences, China

article                  info                            abstract
Keywords:                                               Characterizing soil particle size distributions (PSD) and their variation is an important issue
Soil PSD
                                                        in environmental research. In this study, fractal theory was used to analyse the soil PSD and
Fractal characteristic
                                                        its variations in the Cele Oasis, which is located at the southern margin of the Tarim Basin.
Oasis
Farmland                                                The characteristics of the soil PSD were then evaluated to identify the primary factors that
Cele                                                    influence soil PSD. The results showed that the fractal dimension (D) values ranged from
                                                        2.11 to 2.27, and that there were significant differences among groups. Furthermore, the
                                                        D values showed a significant positive correlation with fine particles (
D. Gui et al. / Mathematical and Computer Modelling 51 (2010) 1306–1311 1307
oases are mostly distributed in piedmonts, where the terrain is generally smooth and simple [11]. Many studies have shown
that the oases in Xinjiang have expanded gradually into oasis–desert ecotones over the last 50 years due to population
growth and economic pressure [12]. In the process of oasis growth, farmland is still the dominant land use type. Therefore,
in this paper, the soil PSD in farmland in an oasis was characterized and then investigated to determine what the primary
factors influencing these characteristics were. To elucidate these factors, it is necessary to have a deep understanding of the
laws responsible for changes in the PSD properties and other interrelated properties of soils in oases. The soil organic matter
content (SOM), as the best surrogate for soil quality influenced by land use [13,14], was selected to be contrasted with fractal
parameters.
The oases located on the southern rim of the Taklamakan Desert are extremely arid and frequently subjected to
sandstorms [11]. In this study, the Cele Oasis in the Taklamakan Desert was evaluated. The specific objectives of this study
were: (1) to characterize the soil PSD in farmland in the oasis using fractal theory; (2) to identify the primary factors
responsible for variations in the farmland soil PSD according to the fractal dimension value of the PSD.
1. Materials and methods
1.1. The study area
The Cele Oasis (35◦ 170 5500 –39◦ 300 0000 N, 80◦ 030 2400 E–82◦ 100 3400 E) is located in the central part of the southern marginal
zone of the Taklimakan Desert and the northern piedmont of the Kunlun Mountains. The area is characterized by a typical
continental arid climate, with an annual precipitation of only 35.1 mm; however, the annual evaporation is as high as
2595.3 mm, and the aridity is 20.8. The diurnal–nocturnal difference in air temperature is high, with an annual range in
temperature of greater than 15 ◦ C. Additionally, the study area is perennially windy, with a prevailing wind direction of
NW. The Cele River, which originates in the Kunlun Mountains, is the main river in the Cele Oasis. The average annual runoff
volume in the oasis is 1.27 × 10⁸ m3 . The oasis is surrounded by natural vegetation in its eastern and western parts, while
its southern part connects with mobile dunes and the Gobi desert. The Cele Oasis is a typical desert–oasis ecosystem that is
dominated by aeolian soil [11].
1.2. Sampling and treatment
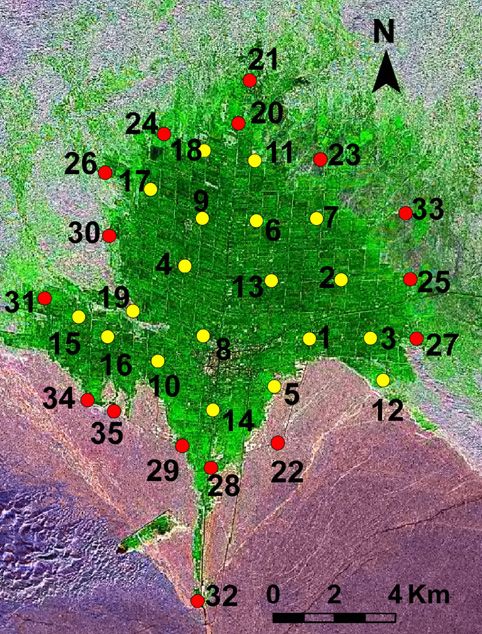
The soil samples (0–20 cm) were collected at random from a total of 35 sampling sites throughout the oasis in September
2008. The distance between adjacent sampling sites never exceeded 2 km, and the farmland use situation was surveyed
while sampling. Three replicates of each soil sample were collected, which resulted in a total of 105 soil samples being
obtained. The soil samples were transported to the laboratory, where they were dried in the shade and then passed through
a 2-mm-mesh sieve, after which the stems were removed.
1.3. Calculation of the D values based on the volume distribution of the soil particle size
The equation used to determine the mass fractal dimension value (Dm ) of soil PSD that was developed by Tyler and
Wheatcraft [15] has been widely used in agrology. Many studies have demonstrated that Dm values can be used to reveal the
structure, property, fertility and degree of degradation of soil [16]. Actually, Tyler and Wheatcraft put forward the volume
fractal dimension value (Dv ) of soil PSD first, but it was difficult to accurately derive the PSD information regarding the
particle volume due to limitations associated with the analysis methods available at that time; therefore, they assumed
that the density of the same soil particles was the same. However, this assumption is obviously not ideal given the actual
situation of soil [17]. Because laser diffraction (LD) technology can be used to obtain the volume information regarding soil
PSD in more particle fractions and independently of the soil particle mass, it is ideal for use in studies conducted to evaluate
PSD and has therefore been widely used in such studies [3,9,18]. Accordingly, Tyler and Wheatcraft’s method [15] was used
in the PSD fractal in this study. The equation is expressed as
V (r < Ri )
3−D
Ri
= (1)
VT Rmax
where r is the particle size, Ri is the particle size of grade i in the particle size grading, V (r < Ri ) is the volume of soil
particles with a diameter less than Ri , VT is the volume of all of the soil particles, Rmax is the maximum diameter of the soil
particles, and D is the fractal dimension value. According to the equation above, the logarithms are taken for both sides of
the equation and the D values of all of the soil samples can be derived based on the slopes of the logarithmic curves that are
fit to the data.
1.4. Laser diffraction analysis
The soil samples were pretreated with H2 O2 (30%, w/w) at 72 ◦ C to destroy the organic matter. The aggregates were
then dispersed by adding sodium hexametaphosphate (NaHMP) and sonicating the samples for 30 s, after which they were
analyzed by a laser diffraction technique using a Longbench Mastersizer 2000 (Malvern Instruments, Malvern, England).1308 D. Gui et al. / Mathematical and Computer Modelling 51 (2010) 1306–1311
Fig. 1. Log–log plots of soil PSD used to calculate the lowest and highest D value.
The laser particle analyzer, which can be used to measure PSD values within a range of 0–20 000 µm, gives the continuous
volume percentage of particle size during analysis. However, the PSD values in the present study were all found to be in the
range of 0.35–1000 µm; therefore, the soil particle sizes in this range were graded into 64 fractions using the software
provided with the laser particle analyzer [9].
Soil organic matter was determined by oil bath—K2 CrO7 titration method [19].
1.5. Data analysis
The measured distribution data and particle size volumes of all soil samples were imported into EXCEL to calculate the D
values.The difference in D value between the farmlands was compared using the multiple comparison and one-way analysis
of variance (ANOVA) procedures. Results were checked by Tukey’s test (p < 0.01). The Pearson’s correlation analysis was
used to analyse the relationships between D and contents of different particle fractions and SOM contents. The K -mean quick
clustering method was used to find the critical D value. All statistical analyses were conducted using the SPSS software (13.0
version).
2. Results and discussion
2.1. The fractal dimension characteristics of soil PSD
Eq. (1) is used to calculate the D values of the soil particle sizes and the D values of each of the sampling sites were found
to range from 2.11 to 2.27, and ANOVA revealed that the D values of farmland soil in the oasis differed significantly (sig = 0).
Additionally, the D values observed in the oasis were significantly lower than the values observed in other regions [20]. The
log–log graph of the minimum and maximum D values of soil samples is shown in Fig. 1.
The log–log scatter diagram was used to derive D values through the slope of the straight line that best fit the data.
Because a single fractal is used, the entire soil PSD extent cannot be contained [21]. Indeed, as shown in Fig. 1, the two ends
of the scatter diagram bend downward in the entire scale interval of PSD. Nevertheless, the fitting result was ideal because
the primary change occurred close to the straight line of the scatter diagram, and the R2 values were all greater than 0.9.
Correlation analysis of the D values and the volume contents of different particle size fractions revealed that there was
a significant positive correlation between the volume percentage of the particle size within 50 µm and the D value, with a
correlation coefficient of 0.68. However, the correlations between the volume percentages of the particle sizes within the 5,
10 and 20 µm fractions and the D values were found to be stronger, as indicated by correlation coefficients of 0.824, 0.812 and
0.791, respectively. Furthermore, a significant negative correlation between the volume percentage of the particle size larger
than 50 µm and the D value was observed, as indicated by a correlation coefficient of −0.75. All correlation analyses passed
a two-tailed test when evaluated at p < 0.01. These findings demonstrate that the PSD-based volume fractal dimension
value (D) can be used to reflect the soil PSD characteristics well, and that the higher the D value is, the higher the content
of soil fine particles will be. Figs. 2 and 3 show the relationship between the change of D values and the volume percentage
compositions of soil particles 50 µm.
2.2. Relationship between the D value of soil PSD and the SOM content
After conducting a typical correlation analysis between the SOM contents in soil samples and the D values, a significant
positive correlation between SOM and D values was observed (Fig. 4). Specifically, the correlation coefficient was 0.65
(p < 0.01). This positive correlation can be explained by the because finer soil particles assisted binding of soil organic
matter (SOM) and nutrients [22,23]. Soil organic matter content is one of the most important indexes in soil quality
assessment [24], and the correlation between the D values and SOM of soil shows that the D values of soil can be used
to objectively identify the changes in soil particle sizes, as well as to reflect changes in the soil quality of farmland.D. Gui et al. / Mathematical and Computer Modelling 51 (2010) 1306–1311 1309
Fig. 2. The correlation between D value and soil particle volume (r < 10 µm).
Fig. 3. The correlation between D value and soil particle volume (r > 50 µm).
Fig. 4. The correlation between D value and SOM.
2.3. Characterization of the variation in PSD and evaluation of the affecting factors
The 35 sampling sites in the oasis were ordinally ranked according to D value (Fig. 5), and the D differencebetween sites
was then compared based on ANOVA procedures and LSD multiple comparisons.
Based on evaluation of the farmland use, no obvious differences were observed in the long-term cultivation and tillage
management, but the utilization years and distribution locations of the farmland did differ. The farmland in the central (or
near central) area of the oasis has been in use for longer periods of time (more than 100 years) than the farmland in the
marginal zone of the oasis (less than 30 years) due to differences in the oasis development process.
According to the change of the D values at all the sampling sites, it is found that farmland cultivated for more than
100 years were significantly higher than those of farmland cultivated for less than 30 years. However, there was no
significant difference in D values among farmlands cultivated for more than 100 years. Similarly, there was no significant
difference in the D values among farmlands that have been cultivated for 30 years. Therefore, the D values were classified
into two groups using the K -mean quick clustering method to further research the relationship between the change in D1310 D. Gui et al. / Mathematical and Computer Modelling 51 (2010) 1306–1311 Fig. 5. The order of D values at sampling sites and the results of the cluster analysis of the D values. (For interpretation of the references to colour in this figure legend, the reader is referred to the web version of this article.) values and the farmland status. The results of the clustering analyses revealed that D values >2.21 were observed in the first group (20 sampling sites in all), while those
D. Gui et al. / Mathematical and Computer Modelling 51 (2010) 1306–1311                                           1311

    The farmland soil PSD characteristics in the Cele Oasis were evaluated using fractal theory and the results revealed that
the volume fractal dimension values of soil could be use to determine the soil PSD characteristics. Additionally, the findings
presented in this study indicated that there is a significant positive correlation between the D value of soil and the content
of soil fine particles, as well as a significant positive correlation between the D value and the soil organic matter content. In
general, the D values of farmland soil in the study area were low, which indicates that the soil texture is poor.
    Analysis of the PSD-based volume fractal dimension value of farmland indicated that there is a significant difference in
D values within the study area. These findings indicate that there is a difference between the soil PSD characteristics in
farmland oases.
    According to the change in D values and the results of K -mean quick clustering, 2.21 is the critical D value. Farmland
cultivation time was found to have an important impact on the soil PSD. Specifically, farmland cultivated for more than
30 years was found to have a more stable PSD, and lands characterized by long-term cultivation and tending were found to
have a more heterogeneous PSD. Conversely, the spatial location of farmland had no regular effect on the soil PSD in general,
except in areas of the oasis near the Gobi desert.
    Taken together, the findings presented here indicate that long-term and rational cultivation patterns and tillage
management in oases will be beneficial to the maintenance of the stability of soil PSD, as well as to the maintenance and
improvement of other soil properties (such as SOM).

Acknowledgements

   The project was supported by the National Basic Research Program of China (973 program 2009CB421302), and
the National Science and Technology Supporting Program of China (2009BAC54B01, 2006BAD26B0202-1), and program
with number 200633130, 200733144-2 and PT0801. The authors also thank the anonymous reviewers for their valuable
comments.

References

 [1] D. Gimtnez, E. Perfect, W.J. Rawls, Ya. Pachepsky, Fractal models for predicting soil hydraulic properties: A review, Engineering Geology 48 (1997)
     161–183.
 [2] G.H. Huang, R.D. Zhang, Evaluation of soil water retention curve with the pore-solid fmctal model, Geoderma 127 (2005) 52–61.
 [3] E. Montero, Rényi dimensions analysis of soil particle-size distributions, Ecological Modelling 182 (2005) 305–315.
 [4] A.N. Kravchenko, C.W. Boast, D.G. Bullock, Multifractal analysis of soil spatial variability, Agronomy Journal 91 (1999) 1033–1041.
 [5] M. Bashkin, T.J. Stohlgren, Y. Otsuki, M. Lee, P. Evangelista, J. Belnap, Soil characteristics and plant exotic species invasions in the Grand Staircase—
     Escalante National Monument, Utah, USA, Applied Soil Ecology 22 (2003) 67–77.
 [6] H. Millan, M. Gonzalez-Posada, M. Aguilar, J. Dominguez, L. Cespedes, On the fractal scaling of soil data. Particle-size distributions, Geoderma 117
     (2003) 117–128.
 [7] R.R. Filgueira, L.L. Fournier, C.I. Cerisola, P. Gelati, M.G. García, Particle-size distribution in soils: A critical study of the fractal model validation,
     Geoderma 134 (2006) 327–334.
 [8] E. Montero, M. Martín, Holder spectrum of dry grain volume-size distributions in soil, Geoderma 112 (2003) 197–204.
 [9] D. Wang, B.J. Fu, W.W. Zhao, Y.F. Wang, Multifractal characteristics of soil particle size distribution under different land-use types on the Loess Plateau,
     China, Catena 72 (2008) 29–36.
[10] Y.F. Hu, J.Y. Liu, D.F. Zhuang, H.X. Cao, H.M. Yan, Fractal dimension of soil prticle size distriution under different land use/land coverage, Acta Pedologica
     Sinica 42 (2) (2005) 36–339 (in Chinese).
[11] D.W. Gui, J.Q. Lei, G.J. Mu, F.J. Zeng, F.X. Yang, Effects of different management intensities on soil quality of farmland during oasis development in
     southern Tarim Basin, Xinjiang, China, International Journal of Sustainable Development & World Ecology 16 (4) (2009) 295–391.
[12] R.J. Hu, Z.L. Fan, Assessment about the impact of climate change on enviroment in Xinjiang since recent 50 years, Arid Land Geography 24 (2) (2001)
     97–103 (in Chinese).
[13] J. Dumanski, C. Pieri, Land quality indicators: Research plan, Agriculture, Ecosystems & Environment 81 (2000) 93–102.
[14] J. Wang, B.J. Fu, Y. Qiu, L.D. Chen, Analysis on soil nutrient characteristics for sustainable land use in Danangou catchment of the Loess Plateau, China,
     Catena 54 (2003) 17–29.
[15] S.W. Tyler, S.W. Wheatcraft, Fractal scaling of soil particle-size distributions: Analysis and limitations, Soil Science Society of America Journal 56
     (1992) 362–369.
[16] Y.Z. Su, H.L. Zhao, W.Z. Zhao, T.H. Zhang, Fractal features of soil particle size distribution and the implication for indicating desertification, Geoderma
     122 (2004) 43–49.
[17] J. Clifton, P. Mcdonald, A. Plater, F. Oldfield, An investigation into the efficiency of particle size separation using stokes’ law, Earth Surface Processes
     and Landforms 24 (1999) 725–730.
[18] J.L. Yang, D.C. Li, G.L. Zhang, Y.G. Zhao, X.G. Tang, Comparison of mass and volume fractal dimensions of soil particle size distributions, Acta Pedologica
     Sinica 45 (3) (2008) 413–419 (in Chinese).
[19] D.W. Nelson, L.E. Sommers, A rapid and accurate method for estimating organic carbon in soil, Proceedings of the Indiana Academy of Science 84
     (1975) 456–462.
[20] D.C. Li, T.L. Zhang, Fractal features of particle size distribution of soils in china, Soil and Environmental Sciences 9 (4) (2000) 263–265 (in Chinese).
[21] E. Kozak, Z. Sokolowski, W. Stepniewski, Y.A. Pachepsky, A modified number-based method for estimating fragmentation fractal dimensions of soils,
     Soil Science Society of America Journal 60 (1996) 1291–1297.
[22] I. Lobe, W. Amenlung, C.C. Du Preez, Losses of carbon and nitrogen with prolonged arable croppingfrom sandy soils of the South African Highveld,
     European Journal of Soil Science 52 (2001) 93–101.
[23] M.A. Fullen, C.A. Booth, R.T. Brandsma, Long-term efects of grass ley set-aside on erosion rates and soil organic matter on sandy soils in east Shropshire,
     UK, Soil & Tillage Research 89 (1) (2006) 122–128.
[24] J. Dumanski, C. Pieri, Land quality indicators: Research plan, Agriculture Ecosystems and Environment 81 (2000) 93–102.
You can also read